PLHIV Stigma Index in Nepal
PLHIV Stigma Index in Nepal
PLHIV Stigma Index in Nepal
- No tags were found...

You also want an ePaper? Increase the reach of your titles
YUMPU automatically turns print PDFs into web optimized ePapers that Google loves.
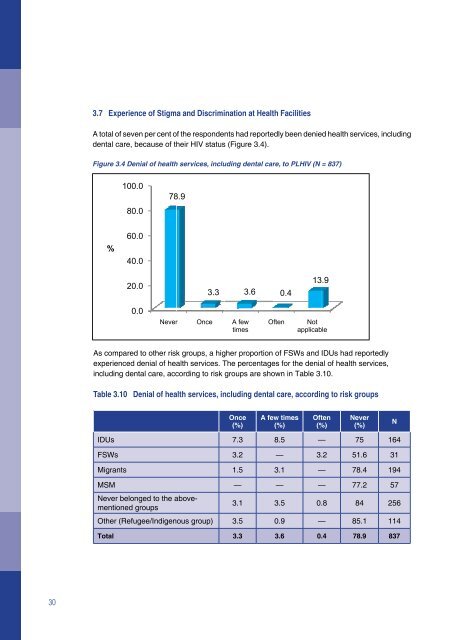
3.7 Experience of <strong>Stigma</strong> and Discrim<strong>in</strong>ation at Health FacilitiesA total of seven per cent of the respondents had reportedly been denied health services, <strong>in</strong>clud<strong>in</strong>gdental care, because of their HIV status (Figure 3.4).Figure 3.4 Denial of health services, <strong>in</strong>clud<strong>in</strong>g dental care, to <strong>PLHIV</strong> (N = 837)There is a wide variation among the respondents belong<strong>in</strong>g to different geographical locations<strong>in</strong> terms of the denial of health services, <strong>in</strong>clud<strong>in</strong>g dental care. As compared to other regions,respondents from the Eastern and Central regions had reported a higher percentage of such<strong>in</strong>stances.Table 3.11 Denial of health services, <strong>in</strong>clud<strong>in</strong>g dental care, accord<strong>in</strong>g to development regions100.078.9Denied health services,<strong>in</strong>clud<strong>in</strong>g dental careEastern Central WesternMid-WesternFar-WesternTotal80.0Yes (%) 12.4 14.7 4.3 1.8 1.1 7.3%60.040.020.03.33.60.413.9No/Not applicable (%) 87.6 85.3 95.7 98.2 98.9 92.7N 153 190 258 57 179 837The study found that respondents have reportedly been denied family plann<strong>in</strong>g services (3%)and SRH services (2%) because of their HIV status (Table 3.12).Table 3.12 Denial of family plann<strong>in</strong>g and reproductive health services0.0NeverAs compared to other risk groups, a higher proportion of FSWs and IDUs had reportedlyexperienced denial of health services. The percentages for the denial of health services,<strong>in</strong>clud<strong>in</strong>g dental care, accord<strong>in</strong>g to risk groups are shown <strong>in</strong> Table 3.10.Table 3.10 Denial of health services, <strong>in</strong>clud<strong>in</strong>g dental care, accord<strong>in</strong>g to risk groupsOnce(%)A few times(%)Often(%)Never(%)IDUs 7.3 8.5 — 75 164FSWs 3.2 — 3.2 51.6 31Migrants 1.5 3.1 — 78.4 194MSM — — — 77.2 57Never belonged to the abovementionedgroupsOnceA fewtimesOftenNotapplicable3.1 3.5 0.8 84 256Other (Refugee/Indigenous group) 3.5 0.9 — 85.1 114NDenial of family plann<strong>in</strong>g servicesMaleFemaleTGpersonYes (%) 2.3 2.9 7.4 2.7TotalNo/Not applicable (%) 97.7 97.1 92.6 97.3N 400 412 27 839Denial of sexual and reproductive health servicesYes (%) 2.8 1.0 7.4 2.0No (%) 97.2 99.0 92.6 98.0N 399 404 27 830The follow<strong>in</strong>g table (Table 3.13) illustrates the percentages of <strong>PLHIV</strong> who had been deniedfamily plann<strong>in</strong>g services and SRH services by region.Total 3.3 3.6 0.4 78.9 83730 31