Annual Report 2010 - MARG Group
Annual Report 2010 - MARG Group
Annual Report 2010 - MARG Group
- No tags were found...

You also want an ePaper? Increase the reach of your titles
YUMPU automatically turns print PDFs into web optimized ePapers that Google loves.
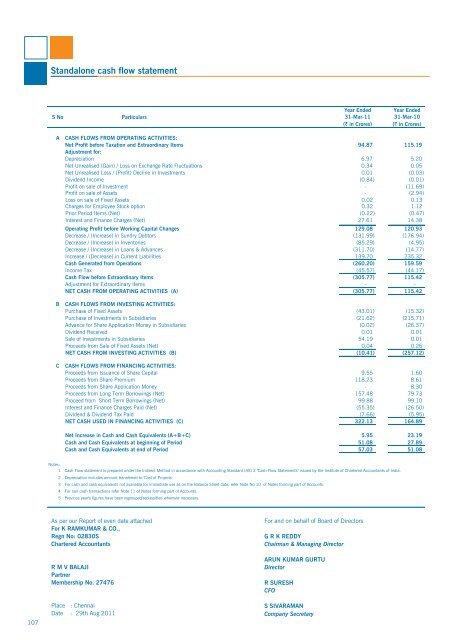
Standalone cash flow statementYear Ended Year EndedS No Particulars 31-Mar-11 31-Mar-10(` in Crores) (` in Crores)ABCCASH FLOWS FROM OPERATING ACTIVITIES:Net Profit before Taxation and Extraordinary Items 94.87 115.19Adjustment for:Depreciation 6.97 5.20Net Unrealised (Gain) / Loss on Exchange Rate Fluctuations 0.34 0.05Net Unrealised Loss / (Profit) Decline in Investments 0.01 (0.03)Dividend Income (0.84) (0.01)Profit on sale of Investment - (11.69)Profit on sale of Assets - (2.94)Loss on sale of Fixed Assets 0.02 0.13Charges for Employee Stock option 0.32 1.12Prior Period Items (Net) (0.22) (0.47)Interest and Finance Charges (Net) 27.61 14.38Operating Profit before Working Capital Changes 129.08 120.93Decrease / (Increase) in Sundry Debtors (131.99) (176.94)Decrease / (Increase) in Inventories (85.29) (4.95)Decrease / (Increase) in Loans & Advances (311.70) (14.77)Increase / (Decrease) in Current Liabilities 139.70 235.32Cash Generated from Operations (260.20) 159.59Income Tax (45.57) (44.17)Cash Flow before Extraordinary Items (305.77) 115.42Adjustment for Extraordinary Items - -NET CASH FROM OPERATING ACTIVITIES (A) (305.77) 115.42CASH FLOWS FROM INVESTING ACTIVITIES:Purchase of Fixed Assets (43.01) (15.32)Purchase of Investments in Subsidiaries (21.62) (215.71)Advance for Share Application Money in Subsidiaries (0.02) (26.37)Dividend Received 0.01 0.01Sale of Investments in Subsidiaries 54.19 0.01Proceeds from Sale of Fixed Assets (Net) 0.04 0.26NET CASH FROM INVESTING ACTIVITIES (B) (10.41) (257.12)CASH FLOWS FROM FINANCING ACTIVITIES:Proceeds from Issuance of Share Capital 9.55 1.60Proceeds from Share Premium 118.23 8.61Proceeds from Share Application Money - 8.30Proceeds from Long Term Borrowings (Net) 157.48 79.73Proceed from Short Term Borrowings (Net) 99.88 99.10Interest and Finance Charges Paid (Net) (55.35) (26.50)Dividend & Dividend Tax Paid (7.66) (5.95)NET CASH USED IN FINANCING ACTIVITIES (C) 322.13 164.89Net Increase in Cash and Cash Equivalents (A+B+C) 5.95 23.19Cash and Cash Equivalents at beginning of Period 51.08 27.89Cash and Cash Equivalents at end of Period 57.03 51.08Notes:1 Cash Flow statement is prepared under the Indirect Method in accordance with Accounting Standard (AS) 3 "Cash Flow Statements" issued by the Institute of Chartered Accountants of India.2 Depreciation includes amount transferred to 'Cost of Projects'.3 For cash and cash equivalents not available for immediate use as on the Balance Sheet date, refer Note No 10 of Notes forming part of Accounts.4 For non cash transactions refer Note 11 of Notes forming part of Accounts.5 Previous year's figures have been regrouped/reclassified wherever necessary.107As per our <strong>Report</strong> of even date attachedFor K RAMKUMAR & CO.,Regn No: 02830SChartered AccountantsR M V BALAJIPartnerMembership No. 27476Place : ChennaiDate : 29th Aug 2011For and on behalf of Board of DirectorsG R K REDDYChairman & Managing DirectorARUN KUMAR GURTUDirectorR SURESHCFOS SIVARAMANCompany Secretary