2006 Business Development Report - Niagara Falls, Ontario, Canada
2006 Business Development Report - Niagara Falls, Ontario, Canada
2006 Business Development Report - Niagara Falls, Ontario, Canada
- No tags were found...

Create successful ePaper yourself
Turn your PDF publications into a flip-book with our unique Google optimized e-Paper software.
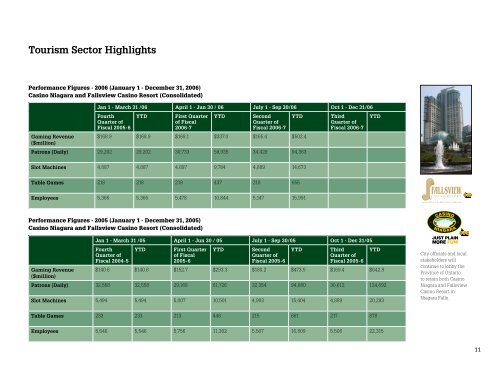
Tourism Sector HighlightsPerformance Figures - <strong>2006</strong> (January 1 - December 31, <strong>2006</strong>)Casino <strong>Niagara</strong> and <strong>Falls</strong>view Casino Resort (Consolidated)Gaming Revenue($million)Jan 1 - March 31 /06 April 1 - Jun 30 / 06 July 1 - Sep 30/06 Oct 1 - Dec 31/06FourthQuarter ofFiscal 2005-6YTDFirst Quarterof Fiscal<strong>2006</strong>-7YTDSecondQuarter ofFiscal <strong>2006</strong>-7YTD$168.9 $168.9 $168.1 $337.0 $165.4 $502.4Patrons (Daily) 29,202 29,202 30,733 59,935 34,428 94,363ThirdQuarter ofFiscal <strong>2006</strong>-7YTDSlot Machines 4,887 4,887 4,897 9,784 4,889 14,673Table Games 218 218 219 437 218 655Employees 5,366 5,366 5,478 10,844 5,147 15,991Performance Figures - 2005 (January 1 - December 31, 2005)Casino <strong>Niagara</strong> and <strong>Falls</strong>view Casino Resort (Consolidated)Gaming Revenue($million)Jan 1 - March 31 /05 April 1 - Jun 30 / 05 July 1 - Sep 30/05 Oct 1 - Dec 31/05FourthQuarter ofFiscal 2004-5YTDFirst Quarterof Fiscal2005-6YTDSecondQuarter ofFiscal 2005-6YTDThirdQuarter ofFiscal 2005-6$140.6 $140.6 $152.7 $293.3 $180.2 $473.5 $169.4 $642.9Patrons (Daily) 32,558 32,558 29,168 61,726 32,354 94,080 30,612 124,692Slot Machines 5,494 5,494 5,007 10,501 4,903 15,404 4,889 20,293YTDCity officials and localstakeholders willcontinue to lobby theProvince of <strong>Ontario</strong>to retain both Casino<strong>Niagara</strong> and <strong>Falls</strong>viewCasino Resort in<strong>Niagara</strong> <strong>Falls</strong>.Table Games 233 233 213 446 215 661 217 878Employees 5,546 5,546 5,756 11,302 5,507 16,809 5,506 22,31511