Mapping Indonesian Rice Areas Using Multiple- Temporal Satellite ...
Mapping Indonesian Rice Areas Using Multiple- Temporal Satellite ...
Mapping Indonesian Rice Areas Using Multiple- Temporal Satellite ...

You also want an ePaper? Increase the reach of your titles
YUMPU automatically turns print PDFs into web optimized ePapers that Google loves.
Full Length Research Paper<br />
Scholarly Journal of Agricultural Science Vol. 2(6), pp. 119-125, June 2012<br />
Available online at http:// www.scholarly-journals.com/SJAS<br />
ISSN 2276-7118 ©2012 Scholarly-Journals<br />
<strong>Mapping</strong> <strong>Indonesian</strong> <strong>Rice</strong> <strong>Areas</strong> <strong>Using</strong> <strong>Multiple</strong>-<br />
<strong>Temporal</strong> <strong>Satellite</strong> Imagery<br />
Nono Lee, Pejabat Palsu<br />
Institute of Technology of Medan, Jalan Tersesat No.100, Medan, Sumatera Utara 20000, Indonesia.<br />
Accepted 13 May, 2012<br />
There is a growing demand for rice with increase in population. As rice is still the major staple food in<br />
Indonesia, the task of increasing rice production continues to engage the attention of national planners.<br />
Various methods of rice areas estimation can provide different information <strong>Satellite</strong> data, provides<br />
information periodically, wide coverage area, can be used as a source of information on the condition of<br />
rice areas. This study has an objective of using multi-temporal satellite imagery from the Moderate<br />
Resolution Imaging Spectrometer (MODIS) to map the <strong>Indonesian</strong> rice paddies area. The algorithm was<br />
based on temporal profiles of vegetation strength and water content, using electromagnetic surface<br />
reflectance in visible to near infrared range. The results obtained from the analysis were compared to<br />
national statistics. Estimated <strong>Indonesian</strong> regional rice area was 8.27 million ha, which agrees with<br />
published values. The model performance was dependent on rice ecosystems. Good linear<br />
relationships between the model results and the national statistics were observed for all types of rice<br />
fields.<br />
Keywords: GIS, satellite data, MODIS, rice, paddy field, remote sensing.<br />
INTRODUCTION<br />
Indonesia is one of the world's leading rice producers,<br />
with paddy production in 2003 of more than 50 million<br />
tonnes and a cultivated area of more than 11.5 million ha.<br />
Since 1980, Indonesia's national rice yield has been the<br />
highest in tropical Asia. <strong>Indonesian</strong>s are also big<br />
consumers of rice, averaging more than 200 kg per head<br />
each year (Blum, 1993). <strong>Rice</strong> is grown at varying<br />
altitudes, with about 75 per cent of plantings in irrigated<br />
areas and less than 10 precents on rain fed lowlands.<br />
Most rice production takes place on the island of Java<br />
under irrigation. Lowland varieties belong mainly to the<br />
indica sub-species and about 85% of them are highyielding<br />
(Blum, 1993).<br />
The area planted to rice increased by 33% between<br />
1969 and 1990. Since then, however, the conversion of<br />
many rice lands in Java to non-agricultural uses has<br />
contributed to a fall in total output. Sustainable rice<br />
Corresponding Author E-mail:lee_nono@ymail.com<br />
production requires the development and deployment of<br />
new rice varieties and crop management technologies<br />
and approaches. Indonesia achieved rice sufficiency in<br />
1984. From being a chronic rice importer in the 1970s,<br />
Indonesia today is the third biggest rice producer in the<br />
world, and has been consistently so in the past decades.<br />
Between 1970 and 2006, Indonesia's average rice yield<br />
rose by 90% from 2.35 t/ha to 4.62% t/ha. Today,<br />
Indonesia is the 4th most populous country in the world.<br />
A population increase of 1.5% per year requires a<br />
corresponding increase in food supply (Blum, 1993). It is<br />
in this context that Indonesia's agricultural development<br />
program now has three main aims:<br />
a) Increased national food security through higher food<br />
production and lower food imports.<br />
b) Increased added value and competitiveness of<br />
agricultural products.<br />
c) Improved quality of life and less poverty for farming<br />
households through high productivity.<br />
Spatial information of <strong>Indonesian</strong> rice paddies is<br />
required for regional rice cropping/water managements
Figure 1. An example of MODIS imagery over Sumatra Island.<br />
and estimates of rice yield. Necessary information for<br />
informed management includes rice cropping frequency,<br />
rice ecosystem type (irrigated, rain fed lowland, upland,<br />
and flood-prone), and areal distribution. This research<br />
applies the multi-temporal satellite imagery for mapping<br />
rice paddies with different rice ecosystems over<br />
<strong>Indonesian</strong>.<br />
Indonesia has very wide coverage area that consists of<br />
thousands of islands with a various geographic<br />
conditions. It causes difficulties to do field data collection<br />
activities. The cost for inventory, monitoring and updating<br />
of land use in the conventional field survey is very high,<br />
so the method can not be implemented in a relatively<br />
short time. Remote sensing technology that records<br />
periodically earth surface can be used as an alternative<br />
to support of field research mainly to changes in land<br />
use, including the planting period in the paddy field.<br />
MODIS (or Moderate Resolution Imaging<br />
Spectroradiometer) is a key instrument aboard the Terra<br />
(EOS AM) and Aqua (EOS PM) satellites. Terra's orbit<br />
around the Earth is timed so that it passes from north to<br />
south across the equator in the morning, while Aqua<br />
passes south to north over the equator in the afternoon.<br />
Terra MODIS and Aqua MODIS are viewing the entire<br />
Earth's surface every 1 to 2 days, acquiring data in 36<br />
spectral bands, or groups of wavelengths (Canny, 1986).<br />
MODIS has visible, near infrared and shortwave<br />
infrared bands; and therefore, a number of vegetation<br />
indices can be calculated, including Normalized<br />
Scholarly J. Agric. Sci. 120<br />
Difference Vegetation Index (NDVI), Enhanced<br />
Vegetation Index (EVI) and Land Surface Water Index<br />
(LSWI) that is sensitive to leaf water and soil moisture<br />
(figure .1). In this research, we developed a paddy rice<br />
mapping algorithm that uses time series of the vegetation<br />
indices derived from MODIS images to identify that initial<br />
period of flooding and transplanting in paddy rice fields,<br />
based on the sensitivity of LSWI to the increased surface<br />
moisture during the period of flooding and rice<br />
transplanting (Chang et al., 1998).<br />
This research aims at mapping <strong>Indonesian</strong> rice paddies<br />
with different rice ecosystems. It is a simple method that<br />
can be applied at the regional scale. In addition, the<br />
results also include spatial information on rice cropping<br />
frequency. This information can be further used to<br />
quantitatively estimate air pollution emissions from<br />
<strong>Indonesian</strong> rice paddies and evaluate climate change<br />
effects attributed to the emissions.<br />
MATERIALS AND METHODS<br />
MODIS imagery data<br />
The MODIS surface reflectance 8-day L3 Global 500 m<br />
SIN Grid V005, or MOD09A1, data set from 2006 to 2007<br />
was acquired for this research. Each grid value gives the<br />
percentage of the radiant energy in the specific<br />
bandwidth to the total energy integrated over the entire
Lee and Palsu 121<br />
spectrum. In this research, the MODIS surface<br />
reflectance in four spectral bands, in the visible and nearinfrared,<br />
was considered. These are band 1: 620–670 nm<br />
(visible-red: VISR), band 2: 841–876 nm (near-infrared:<br />
NIR), band 3: 459–479 nm (visible-blue: VISB), and band<br />
6: 1628–1652 nm (shortwave-infrared: SWIR). The<br />
products were downloaded from the USGS Land<br />
Processes Distributed Active Archive Centre (Deriche,<br />
1987).<br />
These reflectance products are reported at a 500-m<br />
resolution in a level 3, grid projection. Each pixel contains<br />
the best possible L2G (daily) observation during an 8-day<br />
period. These version 5 reflectance products are<br />
validated stage 1, meaning that accuracy has been<br />
estimated using a small number of independent<br />
measurements obtained from selected locations and time<br />
periods and ground-truth/field program efforts. The<br />
products are in HDF-EOS format. Prior to the analysis,<br />
these data were converted to GeoTIFF format and<br />
reprojected to UTM zone 48 projected coordinate system<br />
with the WGS1984 (the World Geodetic Survey System<br />
of 1984) datum by using MODIS Reprojecting Tool (MRT)<br />
from USGS/LPDAAC. These reprojected data sets were<br />
used in the land classification analyses running on the<br />
Model animation in ArcGIS 9.9 software with integrated<br />
Gozilla scripts (Gonzalez and Woods, 1992).<br />
Climate<br />
The climate of Indonesia is almost entirely tropical. The<br />
uniformly warm waters that make up 81 % of Indonesia's<br />
area ensure that temperatures on land remain fairly<br />
constant, with the coastal plains averaging 28°C, the<br />
inland and mountain areas averaging 26 °C, and the<br />
higher mountain regions, 23 °C. Temperature varies little<br />
from season to season, and Indonesia experiences<br />
relatively little change in the length of daylight hours from<br />
one season to the next; the difference between the<br />
longest day and the shortest day of the year is only fortyeight<br />
minutes. This allows crops to be grown all year<br />
round.<br />
The main variable of Indonesia's climate is not<br />
temperature or air pressure, but rainfall. The area's<br />
relative humidity ranges between 70 and 90%. Winds are<br />
moderate and generally predictable, with monsoons<br />
usually blowing in from the south and east in June<br />
through September and from the northwest in December<br />
through March.<br />
Data processing<br />
The normalized difference vegetation index (NDVI), the<br />
enhanced vegetation index (EVI), the normalized build-up<br />
index (NDBI), and the land surface water index (LSWI:<br />
negative NDBI) are calculated from the surface<br />
reflectance, ρ, in visible-red (VISR; MODIS-band 1),<br />
near-infrared (NIR; MODIS-band 2), visible-blue (VISB;<br />
MODIS-band 3), and shortwave-infrared (SWIR; MODISband<br />
6) using the following equations.<br />
NDVI = (ρNIR-ρVISR)/ (ρNIR+ρVISR)<br />
EVI = 10.5 (ρNIR-ρVISR)/ (ρNIR+10 ρVISR- 12.05 ρVISB<br />
+ 0.75)<br />
NDBI = (ρSWIR-ρNIR)/ (ρSWIR+ρNIR) (3)<br />
NDVI and EVI were used in this research to enhance the<br />
vegetation detection sensitivity of the MODIS surface<br />
reflectance. Both indices are estimated by normalizing<br />
the difference between the radiances in the near-infrared<br />
spectra and in the red-visible spectra. In addition, EVI<br />
incorporates the additional blue band to correct for<br />
aerosol influences in the red band and the canopy<br />
background adjustment.<br />
In this research, the time-series NDVIs were used to<br />
identify forests, which include perennial and seasonal<br />
plantations. The time-series EVIs were used to identify<br />
rice paddies with different ecosystems because of its<br />
higher sensitivity to canopy structural variation.<br />
Different rice ecosystems and the annual cropping<br />
frequency are identified from rice canopy development<br />
patterns. The four major rice ecosystems as categorized<br />
by International <strong>Rice</strong> Research Institute (IRRI) are:<br />
irrigated, rained lowland, upland, and flood-prone. All four<br />
ecosystems can be found in <strong>Indonesian</strong>. Their<br />
characteristics are detailed in the following:<br />
Irrigated rice is grown in fields with assured irrigation<br />
for one or more crops a year. It is planted in levelled,<br />
diked fields with water control. <strong>Rice</strong> can either be<br />
transplanted from nursery mats or directly seeded in<br />
puddled soil. Intermediate fallow periods range from a<br />
few days to three months.<br />
Rained lowland rice is grown only once a year during<br />
the wet season when there is sufficient water from rain. It<br />
is planted in levelled to slightly sloping, diked fields with<br />
non-continuous flooding. The water level does not<br />
exceed 50 cm for more than ten consecutive days. <strong>Rice</strong><br />
can either be transplanted in puddled soil or directly<br />
seeded on puddled or ploughed dry soil.<br />
Deepwater rice or flood-prone rice has only one crop<br />
per year during the wet season when natural flooding<br />
occurs. It is planted in levelled to slightly sloping or<br />
depressed fields. Water levels range from 50 to more<br />
than 300 cm for more than 10 consecutive days in growth<br />
stage. <strong>Rice</strong> can either be transplanted in puddled soil or<br />
directly seeded on ploughed dry soil.
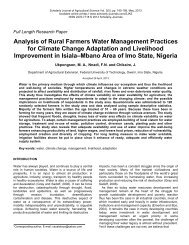
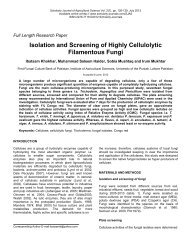
Figure 2. Spatial rice paddy distribution map over Indonesia generated from time-series MODIS imagery analysis<br />
Upland rice can grow in both flat and sloping fields, which<br />
rarely flood and are not diked. This rice is prepared and<br />
directly seeded on ploughed dry soil or dibbled in wet soil<br />
that depends on rainfall for moisture (Katsuaki et al.,<br />
1995).<br />
A rice-cropping cycle takes three to six months<br />
depending on the rice ecosystems. <strong>Rice</strong> canopy<br />
development is generally divided into three phases:<br />
(1) Vegetative phase occurs around 60 days after<br />
sowing. Generally, germination and early seeding stages<br />
are prepared in nursery mats and then transplanted into<br />
puddled, levelled fields. The water signature dominates<br />
during transplanting.<br />
(2) Productive phase starts around 60 days after sowing<br />
or 30 days after transplanting and lasts until the 90th day.<br />
Plants rapidly grow and reach fully developed height. The<br />
plant canopies cover most of the water surface,<br />
intensifying the vegetation signature.<br />
(3) Ripening phase is from 90th day to about 120th day.<br />
Golden grains start developing. The vegetation signature<br />
is still dominant but lessens due to drying leaves. This<br />
Scholarly J. Agric. Sci. 122<br />
period could be extended to six months in the case of<br />
deepwater rice.<br />
Accuracy assessment<br />
The national statistics of forest, perennial plantation, and<br />
rice paddy areas were acquired to compare with the<br />
results obtained from the MODIS time-series models.<br />
These comparisons were done on a provincial/state level<br />
(Leech et al., 2005).<br />
RESULTS<br />
Figure 2 shows the spatial distributions of paddy rice in<br />
Indonesia. <strong>Rice</strong> cultivation covered a total of around 10<br />
million hectares throughout the archipelago, primarily on<br />
sawah. The supply and control of water is crucial to the<br />
productivity of rice land, especially when planted with<br />
high-yield seed varieties. In 1987 irrigated sawah covered
Lee and Palsu 123<br />
58 percent of the total cultivated area, rain fed sawah<br />
accounted for 20 percent, and lading, or dry land<br />
cultivation, together with swamp or tidal cultivation<br />
covered the remaining 22 percent of rice cropland.<br />
Swampland in Indonesia is the most important remaining<br />
land resource for the development of new rice fields.<br />
However the development and maintenance costs for the<br />
infra-structure are high. The environmental impact of a<br />
new development could be considerable.<br />
Large variations in rice yield levels in Indonesia are due<br />
to many factors. Those factors have different scales of<br />
magnitude within regions, provinces, and districts up to<br />
farmers’ field level. Those factors are also classified as<br />
manageable and unmanageable. Yield gaps, therefore,<br />
should be divided into different scales and management.<br />
Yield gaps at different levels in various areas are<br />
indicated by the lowest and the highest yields of rice in<br />
such areas as compared to their average. The priorities<br />
of reducing yield gaps (bridging) are possibly either to<br />
increase the lowest yield to the average or to increase<br />
yields that give the highest impact to rice production of<br />
those areas (Pearlman et al., 2003). The data on rice<br />
yields at provincial level are presented in table 1.<br />
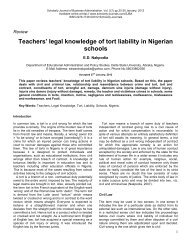
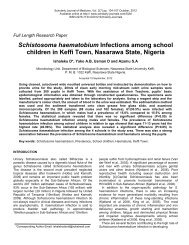
The result from the model showed that the rice paddy<br />
area accounted for 8.7% of total <strong>Indonesian</strong> land area.<br />
The estimated total regional rice paddy area is 8.27<br />
million ha, which is consistent with the areas reported in<br />
Pour et al. (2011), 8.01 million ha, and by Blum (1993) 10<br />
million ha. Linear regression plots of the MODIS rice<br />
paddy areas and the rice paddy areas acquired from the<br />
national rice database by province (or state) for<br />
Indonesia.<br />
DISCUSSION<br />
The combination of Normalized Differences Vegetation<br />
Index (NDVI) and EVI has been carried out to recognize<br />
various cropping pattern based on available knowledge<br />
on growing period of paddy and other seasonal crops.<br />
The analysis integrated with logical inference based on<br />
knowledge of paddy growing stage produces the map of<br />
paddy field distribution. By considering some influencing<br />
factors, agricultural condition can be prospective to<br />
develop the map of paddy field type. The paddy field level<br />
is derived from some parameters based on their level of<br />
influencing agricultural land condition.<br />
There was poor correlation between the estimated rice<br />
areas and the national rice statistics. One of the outlier<br />
estimates was observed in the Papua region. The model<br />
reports 3 million ha rice paddies over this region, while<br />
the national rice statistics are only 0.02 million ha. The<br />
cause of this discrepancy is not understood. This model<br />
predicts that deepwater and irrigated rice are dominant in<br />
southern Papua. In actuality, the major crops are root and<br />
tuber crops, such as yam, taro, sweet potato, vegetables,<br />
and fruits. Based on the results, strategies for bridging<br />
rice yield gaps in Indonesia are as follows:<br />
a) to improve the infrastructure and methodology<br />
(technical improvement, socio-economic improvements,<br />
better policy environment) such as construction and<br />
improvement of irrigation systems including groundwater<br />
exploitation, improved drainage systems, and soil<br />
amelioration;<br />
b) To set priorities on increasing rice yields of the districts<br />
having lower average yield compared to the average<br />
yield level of their province;<br />
c) Site specific improvements: prescription farming, using<br />
adaptable rice varieties etc.<br />
Major improvements should be carried out in Sumatra,<br />
Nusa Tenggara and Sulawesi to overcome major<br />
constraints, such as water shortages, poor drainage, Fe<br />
toxicities and acid soils, low prices of the product, and<br />
marketing. The examples of major improvements are<br />
construction and improvement of irrigation systems,<br />
drainage systems, soil amelioration, transport systems,<br />
market systems, and price policies. In this case Java and<br />
Bali will not be considered as important, because the<br />
facilities in those regions are already considered<br />
sufficient, having good natural resources (high soil fertility<br />
and sufficient water resources).<br />
Prioritized districts in each province to increase rice<br />
yield or to reduce yield gaps are using the<br />
aforementioned method. In Java, there is no special<br />
district to prioritize to increase rice yields. In this area,<br />
bridging rice yield gaps should be done in line with<br />
increasing the efficiency of production inputs such as<br />
adopting prescription farming, and using high-value rice<br />
varieties (of high grain quality with high price). <strong>Using</strong> the<br />
prescription farming procedure, in which the needs for<br />
fertilizers on rice are calculated, based on soil tests,<br />
targeted yield levels and climate, the efficiency of fertilizer<br />
usage could be reduced or even the rice yield could be<br />
increased (Waterman and Hamilton, 1975).<br />
CONCLUSION<br />
There is a growing demand for rice with increase in<br />
population. As rice is still the major staple food in<br />
Indonesia, the task of increasing rice production<br />
continues to engage the attention of national planners.<br />
There are five identified avenues to increase rice<br />
production, namely: a) by increasing the area under rice<br />
production through either increasing the cropping<br />
intensity or expansion into new lands; b) by increasing
Table 1. Harvest <strong>Areas</strong>, Production and Yield of Lowland <strong>Rice</strong> in each Province in Indonesia<br />
Scholarly J. Agric. Sci. 124<br />
Province Harvest Area (ha) Production (tonnes) Actual Yield (t/ha) Range of Actual Yield (t/ha)<br />
1. D.I. Aceh 339785 1400425 4.12 3.75-4.81<br />
2. North Sumatra 716182 2966681 4.14 3.57-4.66<br />
3. West Sumatra 411716 1929622 4.69 3.89-5.29<br />
4. Riau 116766 389776 3.34 3.12-3.47<br />
5. Jambi 152383 530186 3.48 3.14-3.97<br />
6. South Sumatra 395253 1456587 3.69 3.26-4.22<br />
7. Bengkulu 91259 337835 3.70 3.51-3.84<br />
8. Lumping 370942 1620487 4.37 4.16-4.65<br />
Sumatra 2594286 10631599 4.10 3.12-5.29<br />
9. DKI Jakarta 3576 17347 4.85<br />
10. West Java 1957743 10342690 5.28 4.34-5.59<br />
11. Central Java 1534936 8170309 5.32 4.49-6.09<br />
12. Yogyakarta 100125 562025 5.61 4.74-5.85<br />
13. East Java 1529309 8377019 5.48 4.48-5.85<br />
Java 5125689 27469390 5.36 4.34-6.09<br />
14. Bali 155964 836047 5.36 5.22-5.65<br />
15. Western-S.E. Nusa 268327 1232870 4.59 3.84-4.80<br />
16. Eastern-S.E. Nusa 101657 323246 3.18 2.50-3.39<br />
17. East Timor 17418 48835 2.80<br />
Bali & S.E. Nusa 543366 2440998 4.49 2.50-5.65<br />
18. West Kalimantan 242030 674537 2.79 2.29-2.94<br />
19. Central Kalimantan 102530 269530 2.63 2.01-2.82<br />
20. South Kalimantan 355378 1103402 3.10 2.69-3.95<br />
21. East Kalimantan 82436 248596 3.02 2.89-3.10<br />
Kalimantan 782374 2296065 2.93 2.01-3.95<br />
22. North Sulawesi 103130 446693 4.33 3.88-4.52<br />
23. Central Sulawesi 163500 561383 3.43 3.10-3.57<br />
24. South Sulawesi 841066 4008277 4.77 3.46-5.60<br />
25. S.E. Sulawesi 77887 276556 3.55 3.10-3.70<br />
Sulawesi 1185583 5292909 4.46 3.10-5.60<br />
26. Maluku 6626 19619 2.96 2.94-3.01<br />
27. Irian Jaya 13469 37675 2.80<br />
Maluku and Irian Jaya 20095 57294 2.85 2.94-3.01<br />
INDONESIA 10251393 48188255 4.70 2.01-6.09<br />
MODIS Estimation (ha)<br />
1400000<br />
1200000<br />
1000000<br />
800000<br />
600000<br />
400000<br />
200000<br />
0<br />
y = 1.3301x - 8902.7<br />
R² = 0.9776<br />
0 200000 400000 600000 800000 1000000<br />
National estimate (ha)<br />
Figure 3. Linear regression plots of the MODIS rice paddy areas and the<br />
rice paddy areas acquired from the national rice database by province.
Lee and Palsu 125<br />
rice productivity; c) by stabilizing rice yields; d) by<br />
narrowing the rice yield gap; and e) by reducing yield<br />
losses during harvest and post-harvest.<br />
In this context, increasing cropping intensity is related<br />
to the improvement/building irrigation systems to enable<br />
planting of two or three rice crops per year. Productivity is<br />
related to finding new high yielding rice varieties that<br />
potentially increase the yield per ha; stabilizing rice yields<br />
by better pest management to prevent or to control pest<br />
attacks and disease incidence; and post-harvest activities<br />
related to development of harvest and post-harvest<br />
technologies. The efficacy and efficiency of those<br />
methods for increasing rice production differ from one<br />
region to another, which are dependent on natural and<br />
socio-economic conditions.<br />
<strong>Indonesian</strong> rice paddies with different rice ecosystems<br />
were mapped using time-series satellite imagery<br />
analysis. This imagery was generated from the 500-m<br />
resolution MODIS/terra spectral surface reflectance<br />
(MOD09A1) data acquired from 2006 to 2007. The<br />
algorithm for mapping rice paddy area was developed<br />
based on the observed temporal <strong>Indonesian</strong> rice canopy<br />
developments. This algorithm distinguishes different rice<br />
ecosystems and provides rice-cropping frequency.<br />
The total estimated rice area for <strong>Indonesian</strong> was 8.27<br />
million ha, which is consistent with published values.<br />
Comparison of the estimated rice paddy area (y) and the<br />
national rice statistics (x) on the provincial or state level<br />
show high linear correlations over the areas dominated<br />
by rain fed.<br />
This model can be used to identify <strong>Indonesian</strong> areas<br />
that are influenced by activities attributed to rain fed,<br />
irrigated, and upland rice cultivation. Model users could<br />
be state officers or inter-country partners working on<br />
regional water management for agriculture and on<br />
agricultural yield estimation. Atmospheric scientists can<br />
also employ the model's results to estimate regional<br />
budget and spatial loading of pollutants attributed to<br />
biomass burning and rice cultivation.<br />
Ground data should be collected in each paddy field<br />
class for validating the results. It is highly suggestive to<br />
have analysis using newly complete series data images<br />
with at least two years data series which represent each<br />
phase of paddy. Estimation of water demand by using<br />
remote sensing data and considering some water<br />
resources, i.e. amount of precipitation, available water<br />
surface, etc, could be expanded for the next research.<br />
ACKNOWLEDGEMENTS<br />
The author would like to thank the MODIS imagery for<br />
providing the good results.<br />
REFERENCES<br />
Blum, WEH (1993). Soil protection concept of the council of Europe and<br />
integrated soil research. In: Eijsackers HAP, Hamers T, editors.<br />
Integrated Soil and Sediment Research: A Basis for proper<br />
protection. Kluwer Academic Publishers, pp. 37-47<br />
Canny, JA (1986). Computational Approach to Edge Detection. IEEE<br />
Transactions on Pattern Analysis and Machine Intelligence. PAMI,<br />
8(6): 679-698.<br />
Chang, Y, Song, G, Hsu, S (1998). Automatic Extraction of Ridge and<br />
Valley Axes <strong>Using</strong> the Profile Recognition and Polygon-Breaking<br />
Algorithm. Comput. Geosci., 24(1): 83-93.<br />
Deriche, R (1987). <strong>Using</strong> Canny's criteria to derive a recursively<br />
implemented optimal edge detector. Int. J. Comput. Vision. 1(2): 167-<br />
187.<br />
Gonzalez, R, Woods, R (1992). Digital Image Processing, 3rd edition<br />
(March 1992), Addison-Wesley Publishing Company, pp. 200-229.<br />
Katsuaki, K, Shuichi, N, Ohmi, M (1995). Lineament analysis of satellite<br />
images using a segment tracing algorithm (STA). Comput. Geosci.,<br />
21(9): 1091-I 104.<br />
Leech, DP, Treloar, PJ, Lucas, NS, Grocott, J (2003). Landsat TM<br />
analysis of fracture patterns: a case research from the Coastal<br />
Cordillera of northern Chile. Int. J. Remote Sensing, 24(19): 3709-<br />
3726.<br />
Pearlman, JS, Barry, PS, Segal, CC, Shepanski, J, Beiso, D, Carman,<br />
SL (2003). Hyperion, a Space-Based Imaging Spectrometer. IEEE<br />
Trans. Geos. Remote Sensing, 41(6): 1160-1173.<br />
Pour, BA, Hashim, M, Marghany, M (2011). <strong>Using</strong> spectral mapping<br />
techniques on short wave infrared bands of ASTER remote sensing<br />
data for alteration mineral mapping in SE Iran. Int. J. Phys. Sci., 6(4):<br />
917-929.<br />
Waterman, GC, Hamilton, RL (1975). The Sarcheshmeh porphyry<br />
copper deposit. Econ. Geol., 70: 568-576.