LATEST TRENDS on URBAN PLANNING and ... - Portal
LATEST TRENDS on URBAN PLANNING and ... - Portal
LATEST TRENDS on URBAN PLANNING and ... - Portal
- No tags were found...

You also want an ePaper? Increase the reach of your titles
YUMPU automatically turns print PDFs into web optimized ePapers that Google loves.
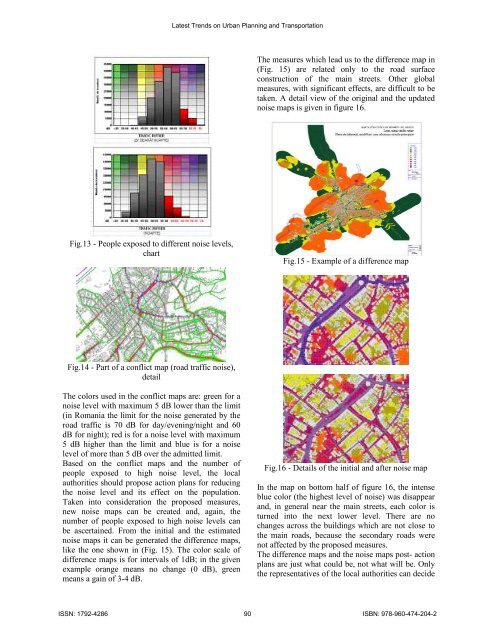
Latest Trends <strong>on</strong> Urban Planning <strong>and</strong> Transportati<strong>on</strong>The measures which lead us to the difference map in(Fig. 15) are related <strong>on</strong>ly to the road surfacec<strong>on</strong>structi<strong>on</strong> of the main streets. Other globalmeasures, with significant effects, are difficult to betaken. A detail view of the original <strong>and</strong> the updatednoise maps is given in figure 16.Fig.13 - People exposed to different noise levels,chartFig.15 - Example of a difference mapFig.14 - Part of a c<strong>on</strong>flict map (road traffic noise),detailThe colors used in the c<strong>on</strong>flict maps are: green for anoise level with maximum 5 dB lower than the limit(in Romania the limit for the noise generated by theroad traffic is 70 dB for day/evening/night <strong>and</strong> 60dB for night); red is for a noise level with maximum5 dB higher than the limit <strong>and</strong> blue is for a noiselevel of more than 5 dB over the admitted limit.Based <strong>on</strong> the c<strong>on</strong>flict maps <strong>and</strong> the number ofpeople exposed to high noise level, the localauthorities should propose acti<strong>on</strong> plans for reducingthe noise level <strong>and</strong> its effect <strong>on</strong> the populati<strong>on</strong>.Taken into c<strong>on</strong>siderati<strong>on</strong> the proposed measures,new noise maps can be created <strong>and</strong>, again, thenumber of people exposed to high noise levels canbe ascertained. From the initial <strong>and</strong> the estimatednoise maps it can be generated the difference maps,like the <strong>on</strong>e shown in (Fig. 15). The color scale ofdifference maps is for intervals of 1dB; in the givenexample orange means no change (0 dB), greenmeans a gain of 3-4 dB.Fig.16 - Details of the initial <strong>and</strong> after noise mapIn the map <strong>on</strong> bottom half of figure 16, the intenseblue color (the highest level of noise) was disappear<strong>and</strong>, in general near the main streets, each color isturned into the next lower level. There are nochanges across the buildings which are not close tothe main roads, because the sec<strong>on</strong>dary roads werenot affected by the proposed measures.The difference maps <strong>and</strong> the noise maps post- acti<strong>on</strong>plans are just what could be, not what will be. Onlythe representatives of the local authorities can decideISSN: 1792-4286 90 ISBN: 978-960-474-204-2