Annals of Internal Medicine - Helmut Horten Stiftung
Annals of Internal Medicine - Helmut Horten Stiftung
Annals of Internal Medicine - Helmut Horten Stiftung

Create successful ePaper yourself
Turn your PDF publications into a flip-book with our unique Google optimized e-Paper software.
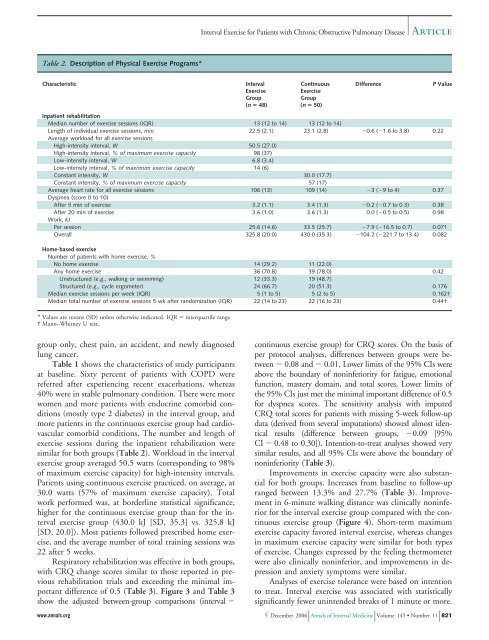
Table 2. Description <strong>of</strong> Physical Exercise Programs*<br />
Characteristic Interval<br />
Exercise<br />
Group<br />
(n � 48)<br />
group only, chest pain, an accident, and newly diagnosed<br />
lung cancer.<br />
Table 1 shows the characteristics <strong>of</strong> study participants<br />
at baseline. Sixty percent <strong>of</strong> patients with COPD were<br />
referred after experiencing recent exacerbations, whereas<br />
40% were in stable pulmonary condition. There were more<br />
women and more patients with endocrine comorbid conditions<br />
(mostly type 2 diabetes) in the interval group, and<br />
more patients in the continuous exercise group had cardiovascular<br />
comorbid conditions. The number and length <strong>of</strong><br />
exercise sessions during the inpatient rehabilitation were<br />
similar for both groups (Table 2). Workload in the interval<br />
exercise group averaged 50.5 watts (corresponding to 98%<br />
<strong>of</strong> maximum exercise capacity) for high-intensity intervals.<br />
Patients using continuous exercise practiced, on average, at<br />
30.0 watts (57% <strong>of</strong> maximum exercise capacity). Total<br />
work performed was, at borderline statistical significance,<br />
higher for the continuous exercise group than for the interval<br />
exercise group (430.0 kJ [SD, 35.3] vs. 325.8 kJ<br />
[SD, 20.0]). Most patients followed prescribed home exercise,<br />
and the average number <strong>of</strong> total training sessions was<br />
22 after 5 weeks.<br />
Respiratory rehabilitation was effective in both groups,<br />
with CRQ change scores similar to those reported in previous<br />
rehabilitation trials and exceeding the minimal important<br />
difference <strong>of</strong> 0.5 (Table 3). Figure 3 and Table 3<br />
show the adjusted between-group comparisons (interval �<br />
Continuous<br />
Exercise<br />
Group<br />
(n � 50)<br />
Difference P Value<br />
Inpatient rehabilitation<br />
Median number <strong>of</strong> exercise sessions (IQR) 13 (12 to 14) 13 (12 to 14)<br />
Length <strong>of</strong> individual exercise sessions, min 22.5 (2.1) 23.1 (2.8) �0.6 (�1.6 to 3.8) 0.22<br />
Average workload for all exercise sessions<br />
High-intensity interval, W 50.5 (27.0)<br />
High-intensity interval, % <strong>of</strong> maximum exercise capacity 98 (37)<br />
Low-intensity interval, W 6.8 (3.4)<br />
Low-intensity interval, % <strong>of</strong> maximum exercise capacity 14 (6)<br />
Constant intensity, W 30.0 (17.7)<br />
Constant intensity, % <strong>of</strong> maximum exercise capacity 57 (17)<br />
Average heart rate for all exercise sessions 106 (13) 109 (14) �3 (�9 to 4) 0.37<br />
Dyspnea (score 0 to 10)<br />
After 5 min <strong>of</strong> exercise 3.2 (1.1) 3.4 (1.3) �0.2 (�0.7 to 0.3) 0.38<br />
After 20 min <strong>of</strong> exercise 3.6 (1.0) 3.6 (1.3) 0.0 (�0.5 to 0.5) 0.98<br />
Work, kJ<br />
Per session 25.6 (14.6) 33.5 (25.7) �7.9 (�16.5 to 0.7) 0.071<br />
Overall 325.8 (20.0) 430.0 (35.3) �104.2 (�221.7 to 13.4) 0.082<br />
Home-based exercise<br />
Number <strong>of</strong> patients with home exercise, %<br />
No home exercise 14 (29.2) 11 (22.0)<br />
Any home exercise 36 (70.8) 39 (78.0) 0.42<br />
Unstructured (e.g., walking or swimming) 12 (33.3) 19 (48.7)<br />
Structured (e.g., cycle ergometer) 24 (66.7) 20 (51.3) 0.176<br />
Median exercise sessions per week (IQR) 5 (1 to 5) 5 (2 to 5) 0.162†<br />
Median total number <strong>of</strong> exercise sessions 5 wk after randomization (IQR) 22 (14 to 23) 22 (16 to 23) 0.44†<br />
* Values are means (SD) unless otherwise indicated. IQR � interquartile range.<br />
† Mann–Whitney U test.<br />
Interval Exercise for Patients with Chronic Obstructive Pulmonary Disease<br />
Article<br />
continuous exercise group) for CRQ scores. On the basis <strong>of</strong><br />
per protocol analyses, differences between groups were between<br />
� 0.08 and � 0.01. Lower limits <strong>of</strong> the 95% CIs were<br />
above the boundary <strong>of</strong> noninferiority for fatigue, emotional<br />
function, mastery domain, and total scores. Lower limits <strong>of</strong><br />
the 95% CIs just met the minimal important difference <strong>of</strong> 0.5<br />
for dyspnea scores. The sensitivity analysis with imputed<br />
CRQ total scores for patients with missing 5-week follow-up<br />
data (derived from several imputations) showed almost identical<br />
results (difference between groups, �0.09 [95%<br />
CI � 0.48 to 0.30]). Intention-to-treat analyses showed very<br />
similar results, and all 95% CIs were above the boundary <strong>of</strong><br />
noninferiority (Table 3).<br />
Improvements in exercise capacity were also substantial<br />
for both groups. Increases from baseline to follow-up<br />
ranged between 13.3% and 27.7% (Table 3). Improvement<br />
in 6-minute walking distance was clinically noninferior<br />
for the interval exercise group compared with the continuous<br />
exercise group (Figure 4). Short-term maximum<br />
exercise capacity favored interval exercise, whereas changes<br />
in maximum exercise capacity were similar for both types<br />
<strong>of</strong> exercise. Changes expressed by the feeling thermometer<br />
were also clinically noninferior, and improvements in depression<br />
and anxiety symptoms were similar.<br />
Analyses <strong>of</strong> exercise tolerance were based on intention<br />
to treat. Interval exercise was associated with statistically<br />
significantly fewer unintended breaks <strong>of</strong> 1 minute or more.<br />
www.annals.org 5 December 2006 <strong>Annals</strong> <strong>of</strong> <strong>Internal</strong> <strong>Medicine</strong> Volume 145 Number 11 821