EOC Newsletter June 2011
EOC Newsletter June 2011
EOC Newsletter June 2011
- No tags were found...

You also want an ePaper? Increase the reach of your titles
YUMPU automatically turns print PDFs into web optimized ePapers that Google loves.
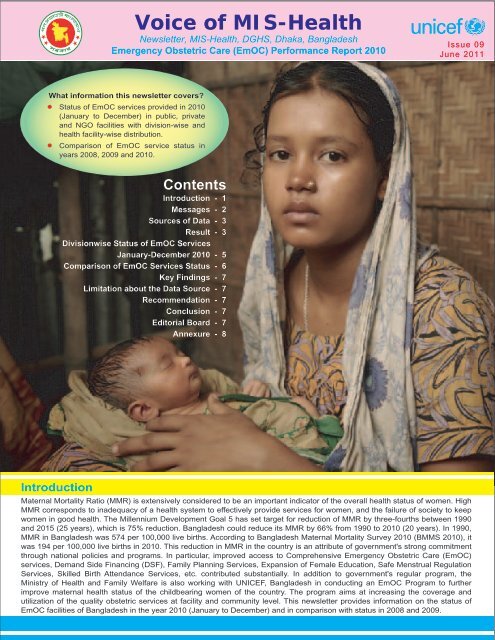
Voice of MIS-Health<strong>Newsletter</strong>, MIS-Health, DGHS, Dhaka, BangladeshEmergency Obstetric Care (EmOC) Performance Report 2010Issue 09<strong>June</strong> <strong>2011</strong>What information this newsletter covers?Status of EmOC services provided in 2010(January to December) in public, privateand NGO facilities with division-wise andhealth facility-wise distribution.Comparison of EmOC service status inyears 2008, 2009 and 2010.ContentsIntroduction - 1Messages - 2Sources of Data - 3Result - 3Divisionwise Status of EmOC ServicesJanuary-December 2010 - 5Comparison of EmOC Services Status - 6Key Findings - 7Limitation about the Data Source - 7Recommendation - 7Conclusion - 7Editorial Board - 7Annexure - 8IntroductionMaternal Mortality Ratio (MMR) is extensively considered to be an important indicator of the overall health status of women. HighMMR corresponds to inadequacy of a health system to effectively provide services for women, and the failure of society to keepwomen in good health. The Millennium Development Goal 5 has set target for reduction of MMR by three-fourths between 1990and 2015 (25 years), which is 75% reduction. Bangladesh could reduce its MMR by 66% from 1990 to 2010 (20 years). In 1990,MMR in Bangladesh was 574 per 100,000 live births. According to Bangladesh Maternal Mortality Survey 2010 (BMMS 2010), itwas 194 per 100,000 live births in 2010. This reduction in MMR in the country is an attribute of government's strong commitmentthrough national policies and programs. In particular, improved access to Comprehensive Emergency Obstetric Care (EmOC)services, Demand Side Financing (DSF), Family Planning Services, Expansion of Female Education, Safe Menstrual RegulationServices, Skilled Birth Attendance Services, etc. contributed substantially. In addition to government's regular program, theMinistry of Health and Family Welfare is also working with UNICEF, Bangladesh in conducting an EmOC Program to furtherimprove maternal health status of the childbearing women of the country. The program aims at increasing the coverage andutilization of the quality obstetric services at facility and community level. This newsletter provides information on the status ofEmOC facilities of Bangladesh in the year 2010 (January to December) and in comparison with status in 2008 and 2009.
MessageDirector GeneralDirectorate General of Health ServicesMohakhali, DhakaBangladesh has made a remarkable progress in maternal mortality reduction. Maternal Mortality Ratio in Bangladesh wasestimated at 574 per 100,000 live births in 1990. It was 322 per 100,000 live births in 2001. Bangladesh Maternal MortalitySurvey 2010 shows the current figure to be 194 maternal deaths per 100,000 live births. The trend indicates that we willachieve our target (143.5 per 100,000 live births) by 2015. As the dateline is near, difficulty may also be much more toachieve more progress. In this regard, we would need to continue positive intervention so that we can reach the target by2015.It is a great pleasure for me to know that the 9th issue of "Voice of MIS-Health" on EmOC performances is going to bepublished by MIS-Health, DGHS in collaboration with UNICEF. I wish to offer my thanks to UNICEF for their technical andlogistic support in such an important area of health development.It is expected that this newsletter will give some programmatic direction to the development policy makers, and healthmanagers of different levels about the EmOC services in Bangladesh. Finally, I would like to thank every one who workedhard directly and behind the screen for publishing this newsletter successfully.(Professor Dr. Khondhaker Md. Shefyetullah)MessageDirectorManagement Information SystemDirectorate General of Health ServicesMohakhali, DhakaOver the past decade, there has been substantial progress in maternalmortality reduction in Bangladesh. Bangladesh Maternal Mortality Survey2010 shows current maternal mortality rate to be 194 per 100,000 live births.However, our MDG5 target for year 2015 is 143.5 per 100,000 live births.Therefore, we must increase our efforts to attain the expected target.I am delighted that the 9th issue of the newsletter of "Voice of MIS-Health" isgoing to be published from the office of Director, MIS-Health of DGHS. Thenewsletter will cover the data and analysis related to Emergency ObstetricCare (EmOC) provided at facilities throughout the country for the period ofJanuary to December 2010. The information shown in the newsletter hasbeen provided by different public and private health facilities.I hope that the facility specific data will guide and help the policy makers andother concerned to take future step in improving the maternal and neonatalhealth services in equitable manner. It also reflects the status of EmergencyObstetric Care throughout the country, which is crucial to save women's andnew-born's life during complication.I like to thank all who were involved in developing and editing the newsletterand special thanks to UNICEF for providing technical and financial support.The effort will be fruitful if we can use the information for the betterment ofour women and children who deserve quality and equitable health services.MessageDirectorPrimary Health CareDirectorate General of Health ServicesMohakhali, DhakaI am very happy to learn that the MIS-Health of DGHS ispublishing the 9th issue of its "Voice of MIS-Health"newsletter with support from UNICEF Bangladeshhighlighting the EmOC performances.We have achieved substantial progress in reducingmaternal mortality rate. Now, it is 194 per 100,000 livebirths, which were 322 per 100,000 live births in 2001.We are achieving much more progress to improve thematernal health condition in the next sector program. So,we may believe that we would be able to achieve theMDG5 by 2015.It is expected that this newsletter will help us tounderstand progressing trend of EmOC performance.From this lesson, we would be benefited achieving thegoal.I congratulate the MIS-Health, DGHS for its valuableendeavors. I would like to extend my sincere thank toeveryone who worked hard to publish this newsletter.(Prof. Dr. Abul Kalam Azad)(Dr. A.B.M. Jahangir Alam)02
Sources of DataData from 690 health facilities consisting 14 Medical CollegeHospitals, 62 District and General Hospitals, 416 Upazila HealthComplexes, 63 Maternal and Child Welfare Centers (MCWCs),and NGOs and Private hospitals from 64 districts, and 7 Othertypes of hospitals have been used for analysis. An estimate ofthe current population, expected births and expectedcomplications of pregnancies has been used. These data havebeen drawn through adjustment of population census data of2001 carried out by Bangladesh Bureau of Statistics (BBS)considering a linear population growth rate of 1.41% per year.The projected populations of year 2010 by division,Table-1. Number of different types of health facilitiesfrom where EmOC Service data werw received in2010Type of hospitalsNo.Medical college hospitals 14District and general hospitals 62Upazila health complexes 416Districts from where NGO providers sent data 64Districts from where private providers sent data 64Maternal and Child Welfare Centers (MCWCs) 63Other Sources 7Total 690district and upazila have been worked out and used togenerate the expected number of births for each area.Finally the expected number of births has been used tocalculate the process indicators.ResultTable-2. Division-wise distribution of EmOC serviceand status in number (Year 2010)Name ofDivisionTotal CesareanDelivery SectionLiveBirthStillBirthMaternalDeathNeonatalDeathBarisal 27,803 14,252 26,980 1,071 143 505Chittagong 82,880 29,740 80,277 3,505 257 501Dhaka 184,234 95,975 180,823 4,887 537 399Khulna 73,605 31,462 72,571 1,641 119 147Rajshahi 86,415 24,168 85,128 2,159 212 165Rangpur 70,397 23,460 69,001 2,393 255 257Sylhet 33,378 11,612 31,453 2,206 177 306Bangladesh 558,712 230,669 546,223 17,862 1,700 2,280Table-2 shows the division-wise distribution of totaldeliveries, caesarean sections, live births, still births,maternal deaths and newborn deaths in the healthfacilities. Data show that there were 558,712 reporteddeliveries at EmOC facilities in the country in 2010 and outof them 546,223 were live births and 17,862 were stillbirths. Among the total deliveries, cesarean sections were230,669. There were 1,700 maternal deaths (reporteddeaths in the health facilities) and 2,280 newborn deaths(only the reported deaths in the facilities).Table-3. Number of populations, expected births and obstetric complications estimated for year 2010 bydivision of BangladeshCategory Barisal Chittagong Dhaka Khulna Rajshahi Rangpur Sylhet TotalPopulation (2001) 8,560,027 25,320,819 40,928,700 15,332,224 17,121,146 14,466,013 8,289,977 130,018,906Population (2010) 9,709,486 28,720,953 46,424,695 17,391,068 19,420,211 16,408,541 9,403,173 147,478,127Expected Births (2010) 199,433 589,928 953,563 357,213 398,891 337,031 193,141 3,029,201Estimated Complications (2010) 29,915 88,489 143,034 53,582 59,834 50,555 28,971 454,380Table-4. Division-wise distribution of status of indicators translated from summary of EmOC data received fromhealth facilities (Year 2010)Category Barisal Chittagong Dhaka Khulna Rajshahi Rangpur Sylhet TotalVisit for ANC service (No.) 63,750 251,178 561,926 230,181 165,960 178,045 65,380 1,516,420Admitted patient (No.) 41,135 105,625 253,992 102,445 120,809 94,639 48,328 766,973Complication treated (No.) 15,610 35,470 98,873 28,612 28,628 18,228 18,409 243,830Normal delivery (No.) 13,445 51,275 86,301 41,465 61,510 45,541 20,689 320,226Forceps / Vacuum / Destructive operation (No.) 34 938 949 336 376 753 621 4,007Vaginal Breech / Face Presentation Delivery (No.) 72 927 1,009 342 361 643 456 3,810Other surgery (No.) 862 4,887 10,193 2,319 3,740 1,987 3,044 27,032Referred in (No.) 1,128 7,349 5,523 2,076 1,515 1,606 1,060 20,257Referred out (No.) 2,482 5,045 10,262 3,602 5,879 5,662 3,395 36,327Visit for PNC services (No.) 18,848 88,611 255,917 65,387 70,881 66,582 30,920 597,146Proportion (%) of all births in EmOC facilities 13.94 14.05 19.32 20.61 21.66 20.89 17.28 18.44Met need (%) for EmOC 52.18 40.08 69.13 53.40 47.85 36.06 63.54 53.66Cesarean section as % of all births 7.15 5.04 10.06 8.81 6.06 6.96 6.01 7.61Case Fatality Rate (CFR) (%) 0.92 0.72 0.54 0.42 0.74 1.40 0.96 0.7003
Table-5. Distribution of status of indicators translated from summary of EmOC data received from type ofhealth facilities (Year 2010)CategoryVisit for ANC serviceAdmitted patientComplicationNormal deliveryForceps /Vacuum / DestructiveoperationVaginal breech/ Face deliveryCesarean sectionTotal deliveryLive birthStill birthOther surgeryReferred inReferred outPNC serviceMaternal deathNeonatal deathNo.%MedicalCollegeHospitalDistrictHospitalUnited Nations Process IndicatorsThe United Nations launched a guideline called United Nations(UN) Process Indicators in 1997 to measure the status ofemergency obstetric care in developed and developing countries.These UN indicators measure (i) the number of hospitals that canprovide care for emergency obstetric conditions per 500,000populations; (ii) the proportion of births in the hospitals; (iii) theproportion of women with obstetric complications treated in thehospitals; (iv) the cesarean section rate; and (v) the case fatalityrate.UpazilaHealthComplexMaternal& ChildWelfareCenterNGOPrivateClinic /HospitalOtherSourceTotalNo. 121,029 145,994 492,604 256,954 191,795 303,722 4,322 1,516,420% 7.98 9.63 32.48 16.94 12.65 20.03 0.29 100No. 122,983 142,161 214,852 50,253 40,531 192,114 4,079 766,973% 16.03 18.54 27.91 6.55 5.26 25.05 0.53 100No. 51,875 56,812 56,530 6,696 4,814 66,314 789 243,830% 21.28 23.30 23.18 2.75 1.97 27.20 0.32 100No. 38,047 49,025 123,005 33,388 23,028 51,250 2,483 320,226% 11.88 15.31 38.41 10.43 7.19 16.00 0.78 100No. 973 252 1,441 251 269 821 0 4,007% 24.28 6.29 35.96 6.26 6.71 20.49 0.00 100No. 868 676 626 438 261 934 7 3,810% 22.76 17.74 16.43 11.50 6.85 24.51 0.18 100No. 40,727 28,602 19,999 9,936 12,256 118,938 211 230,669% 17.66 12.40 8.67 4.31 5.31 51.56 0.09 100No. 80,615 78,555 145,071 44,013 35,814 171,943 2,701 558,712% 14.43 14.06 25.97 7.88 6.41 30.77 0.48 100No. 76,812 75,388 141,197 43,758 35,282 171,150 2,646 546,223% 14.06 13.80 25.85 8.01 6.46 31.33 0.48 100No. 5,048 4,526 4,680 583 865 2,060 100 17,862% 28.26 25.34 26.20 3.26 4.84 11.53 0.56 100No. 8,137 8,857 6,070 618 386 2,719 245 27,032% 30.10 32.76 22.45 2.29 1.43 10.06 0.91 100No. 4,350 6,389 2,265 1,423 1,141 4,689 0 20,257% 21.47 31.54 11.18 7.02 5.63 23.15 0.00 100No. 250 4,821 23,891 2,106 1,866 2,875 518 36,327% 0.69 13.27 65.77 5.80 5.14 7.91 1.43 100No. 62,169 79,581 197,173 63,497 39,288 153,003 2,435 597,146% 10.41 13.33 33.02 10.63 6.58 25.62 0.41 100No. 1,059 389 164 7 26 55 0 1,700% 62.29 22.88 9.65 0.41 1.53 3.24 0.00 100No. 1,338 281 259 15 132 252 3 2,280% 58.68 12.32 11.36 0.66 5.79 11.05 0.13 10004
Table-6. Four United Nations process indicators and recommended levels for emergency obstetric careUN Process IndicatorProportion of all births atfacilityMet need for EmOCCesarean sections aspercentage of all birthsCase fatality rate (CFR)Division-wise Status of EmOC Services(January-December 2010)Proportion (%) of all Births in EmOC FacilitiesFigure-1 shows the division-wise distribution of proportion of allbirths which were taken place in health facilities in the year2010. It reveals that the proportion (%) was the highest inRajshahi division (21.66%) and the lowest in Barisal division(13.94%). The institutional delivery rates in Sylhet, Dhaka,Khulna, Rangpur, Chittagong divisions were between 20.89%and 14.05%. The average for Bangladesh was 18.44%.Figure-1. Division-wise distribution of institutionaldelivery rates [proportion (%) of all births in theEmOC facilities] (January to December 2010)19.32% 20.61% 21.66% 20.89%17.28% 18.44%13.94% 14.05%DescriptionIf less than 15% of all births in the population take place in EmOC facilities, it iscertain that some women who need lifesaving EmOC services are not receiving it.This indicator gives the proportion of women estimated to have obstetriccomplications treated at EmOC facilities. If the met need is less than 100%, one canconclude that some women with complications are not receiving the medical carethey need.Fewer than 5% cesarean sections indicate women who need cesarean sections are notreceiving it. Above 50% indicate bad medical condition or fetal condition of women.CFR measures the quality of EmOC performance at the facility level. This indicatoris thus more meaningful for taking actions locally.complications treatment rate (met need) in different EmOCfacilities in the year 2010. The rate was the highest in Dhakadivision (69.13%) and the lowest in Rangpur division(36.06%). The position of Sylhet division (63.54%) andKhulna division 53.40%) was second and third respectively.Other divisions met between 40.08% and 52.18% of theneed. On average the met need was 53.66% for wholeBangladesh.Cesarean Section as % of all BirthsFigure-3 shows the division-wise distribution of the cesareansection rates as percentage of all births taken place in theEmOC facilities in 2010. It is one of the important indicatorsfor monitoring access to C-EmOC services. It is revealed thatthe highest rate of cesarean births took place in Dhakadivision (10.06%) followed by Khulna division (8.81%). Thelowest rate was in Chittagong division (5.04%). The cesareansection rates varied from division to division. In otherdivisions, the rates were as follows: Barisal (7.15%),Rajshahi (6.06%), Rangpur (6.96%) and Sylhet (6.01%). Thecountry average was 7.61%.BarisalChittagongDhakaKhulnaRajshahiRangpurSylhetBangladeshFigure-3. Division-wise distribution of cesareansection rate (%) in the EmOC facilities by Division(January to December 2010)Met Need (%) for EmOCFigure-2 shows the division-wise distribution of obstetricFigure-2. Division-wise distribution of met need (%)of obstetric care in the EmOC facilities (January toDecember 2010)69.13%52.18%53.40%47.85%36.06%7.15%5.04%10.06%8.81%6.06%6.96%6.01%7.61%63.54%53.66%40.08%BarisalChittagongDhakaKhulnaBarisalRajshahiRangpurChittagongDhakaKhulnaRajshahiRangpurSylhetBangladeshSylhetBangladeshCase Fatality RateThe direct obstetric case fatality rate is the proportion ofwomen admitted to an EmOC facility with major direct obstetric05
complications, or who develop such complications afteradmission, and die before discharge. Case Fatality Rate(CFR) gives rough indication of quality of EmOC services.CFR, among women in Bangladesh, who came with obstetriccomplications to EmOC facilities, was 0.70 in 2010 (Figure-4). It is within the acceptable limit of
Figure-8. Comparison of Case Fatality Rate (%) inEmOC facilities in the year 2008, 2009 and 20101.61.41.210.80.60.40.20BarisalChittagongDhakaKhulnaRajshahiRangpur2008 2009 2010Key FindingsIn Barisal and Chittagong divisions, the proportion of allbirths that took place in 2010 was below the minimumacceptable level of UN process indicator. This may indicatethat some women who needed live saving obstetric care didnot come to the health facility to receive the services(Figure-1).In Chittagong, Rajshahi and Rangpur divisions, the metneed (%) indicates lack of utilizing the facilities/ less referralby the community during the pregnancy relatedcomplications (Figure-2).Nationally substantial increase in institutional delivery rateswas found in 2010 compared to 2009 (Figure-5).The country's average performance for the year 2010 wasbetter in respect to met need (%) for EmOC compared toprevious two years, although in Khulna division, theperformance went a bit lower compared to that in Year 2009(Figure-6).The rates of cesarean sections in the year of 2010 weremore in all divisions compared to the year 2008 and 2009(Figure-7).In some divisions, namely in Khulna and Rajshahi, the casefatality rate was seen to improve, whereas in Rangpurdivision the situation progressed negetively in 2010 than in2009. In Barisal division, the situation remained unchangedin 2010 compared to 2009. The reason is subject to analyzeby the Reproductive Health Program (Figure-8).Limitation About the Data SourceSylhetBangladeshThe MIS-Health receives data from inadequate number ofprivate sources (NGOs and Private Hospitals or Clinics),although the coverage of public facilities is satisfactory. Thislimitation needs to be considered during evaluation of the report.RecommendationThe information reflected in the <strong>Newsletter</strong> has a potential scopeto analyze the EmOC services throughout the country. Thereproductive health program and other concerned may use theinformation to explore the reasons of good and badperformances and act upon it accordingly to improve the EmOCservices.ConclusionObstetric care seeking behavior of the women in Bangladesh isimproving as revealed by the increasing rate of institutionaldeliveries in the EmOC facilities. Ensuring availability of 24/7CEmOC services in the facilities is a big challenge. There isuneven distribution of service qualities in EmOC facilities amongdivisions of Bangladesh. Average case fatality rate in the EmOCfacilities of the country has been found to progress negetively in2010 compared to 2009, which needs attention.Editorial BoardAdvisors1 Professor Dr. Khondhaker Md. ShefyetullahDirector General of Health Services2 Dr. A.B.M. Jahangir AlamDirector, PHC & Line Director, ESD, DGHSChief Editor1 Professor Dr. Abul Kalam AzadDirector, MIS-Health, DGHSAssociate Editor1 Md. Ashraful Islam BabulDeputy Chief (Non -Medical), MIS-Health, DGHSAssistant Editor and Designer1 Md. TaufikuzzamanStatistician, MIS-Health, DGHS2 Nayeem Al MifthahGIS Consultant, MIS-Health, DGHSMembers1 Dr. Nasima AkhterChief, HIU, MIS -Health, DGHS2 Dr. Md. Shahjahan AliDeputy Director, MIS-Health, DGHS3 Dr. Md. Bashirul IslamAssistant Director, MIS -Health, DGHS4 Dr. M. A. Hannan BhuyianDeputy Program Manager, MIS-Health, DGHS5 Mr. Sukhendu Shekhor RoySystem Analyst , MIS-Health, DGHS6 Dr. Monira ParveenHealth Manager, UNICEF, Bangladesh7 Dr. Mohammad Khairul HasanHealth Officer, UNICEF, Bangladesh8 Dr. Sultan Shamiul BasharOSD, MIS-Health, DGHSComposer1 S. M. Rezaul HoqueAssistant Statistician, MIS-Health, DGHS07
AnnexTable-A: Statistical data of 690 facilities during the period January to December, 2010 (including public, private and NGO facilities) 08Type Of DeliveryOutcome ofDeliveryInstitute Name1 Barguna District Hospital , Barguna 20,669 3,100 887 1,265 1,074 283 2 7 313 605 567 46 111 522 78 572 1 5 2.93 34.64 1.51 0.092 Betagi Upzila Health Complex , Barguna 2,774 416 670 134 66 67 0 0 0 67 64 3 2 0 12 432 0 0 2.42 15.86 0.00 0.003 Pathargatha Upazila Health Complex , Barguna 3,970 595 138 276 108 106 0 0 2 108 104 4 0 2 44 175 0 0 2.72 18.14 0.05 0.004 Amtali Upazila Health Complex , Barguna 6,377 957 0 160 39 51 0 0 0 51 51 0 0 0 14 0 0 0 0.80 4.08 0.00 0.005 Bamna Upazila Health Complex , Barguna 1,677 252 18 16 2 13 2 0 0 15 23 1 0 0 1 12 1 0 0.89 0.80 0.00 50.006 MCWC 20,669 3,100 2,222 526 23 314 0 0 0 314 313 1 0 20 45 627 0 0 1.52 0.74 0.00 0.007 Private Clinic & Hospital 20,669 3,100 30 224 0 62 0 0 157 219 218 4 0 0 1 30 0 0 1.06 0.00 0.76 0.008 NGO 20,669 3,100 0 0 0 0 0 0 0 0 0 0 0 0 0 0 0 0 0.00 0.00 0.00 0.00Barguna District Total 20,669 3,100 3,965 2,601 1,312 896 4 7 472 1,379 1,340 59 113 544 195 1,848 2 5 6.67 42.32 2.28 0.159 Sher-e-Bangla Medical College Hospital , Barisa 57,439 8,616 7,082 5,528 3,480 1,576 0 0 2,459 4,035 3,717 393 128 115 16 478 86 465 7.02 40.39 4.28 2.4710 Barisal (100 Beded) Hospital , Barisal 57,439 8,616 1,330 602 42 338 0 2 98 438 431 8 2 14 43 240 0 0 0.76 0.49 0.17 0.0011 Banaripara Upazila Health Complex , Barisa 3,746 562 1,478 1,500 586 708 0 0 332 1,040 1,002 40 0 0 159 1,107 0 0 27.76 104.29 8.86 0.0012 Agailjhara Upazila Health Complex , Barisa 3,659 549 90 50 0 39 0 0 0 39 39 0 0 0 2 75 0 0 1.07 0.00 0.00 0.0013 Babuganj Upazila Health Complex , Barisa 3,605 541 91 25 5 20 0 0 0 20 20 0 0 0 5 10 0 0 0.55 0.92 0.00 0.0014 Bakerganj Upazila Health Complex , Barisa 8,665 1,300 591 118 33 66 0 0 0 66 66 0 0 0 33 66 0 0 0.76 2.54 0.00 0.0015 Gournadi Upazila Health Complex , Barisa 4,384 658 125 106 18 87 0 0 0 87 87 0 0 0 19 84 0 0 1.98 2.74 0.00 0.0016 Hijla Upazila Health Complex , Barisa 4,330 649 290 55 3 51 0 1 0 52 52 0 0 0 3 99 0 0 1.20 0.46 0.00 0.0017 Mehendiganj Upazila Health Complex , Barisa 7,250 1,088 115 115 18 93 0 0 0 93 88 5 0 0 21 84 1 0 1.28 1.66 0.00 5.5618 Muladi Upazila Health Complex , Barisa 4,369 655 376 278 0 101 0 0 0 101 89 12 86 0 33 177 2 0 2.31 0.00 0.00 0.0019 Wazirpur Upazila Health Complex , Barisa 5,937 890 325 228 6 134 0 0 0 134 130 4 4 0 43 252 0 0 2.26 0.67 0.00 0.0020 MCWC 57,439 8,616 4,777 378 52 209 0 3 92 304 300 4 0 2 56 615 0 0 0.53 0.60 0.16 0.0021 Privet Clinc & Hospital 57,439 8,616 2,639 6,308 1,626 679 1 43 3,858 4,581 4,501 127 0 11 15 2,126 1 2 7.98 18.87 6.72 0.0622 NGO 57,439 8,616 7,344 1,481 356 576 0 0 863 1,439 1,438 2 0 0 218 1,342 0 1 2.51 4.13 1.50 0.00Barisal District Total 57,439 8,616 26,653 16,772 6,225 4,677 1 49 7,702 12,429 11,960 595 220 142 666 6,755 90 468 21.64 72.25 13.41 1.4523 Bhola (100 Beded) Hospital , Bhola 41,658 6,249 1,528 1,528 627 586 0 0 69 655 596 69 0 111 65 552 14 0 1.57 10.03 0.17 2.2324 Charfession Upazila Health Complex , Bhola 10,163 1,524 947 905 329 402 0 0 38 440 403 37 0 0 126 575 11 0 4.33 21.58 0.37 3.3425 Manpura Upazila Health Complex , Bhola 1,556 233 56 31 10 21 0 0 0 21 17 4 0 0 6 21 0 0 1.35 4.29 0.00 0.0026 Borhanuddin Upazila Health Complex , Bhola 6,016 902 656 318 142 122 0 0 0 122 120 2 0 0 21 122 0 0 2.03 15.74 0.00 0.0027 Daulatkhan Upazila Health Complex , Bhola 4,226 634 257 116 97 47 10 0 0 57 57 2 0 0 12 44 1 0 1.35 15.30 0.00 1.0328 Lalmohan Upazila Health Complex , Bhola 6,565 985 155 133 83 45 0 0 0 45 39 6 0 0 20 45 0 0 0.69 8.43 0.00 0.0029 Tajumuddin Upazila Health Complex , Bhola 3,117 468 417 58 14 35 0 0 0 35 34 1 0 0 9 37 0 0 1.12 2.99 0.00 0.0030 MCWC 41,658 6,249 1,923 920 0 784 5 1 125 915 915 0 0 0 1 783 0 0 2.20 0.00 0.30 0.0031 Privet Clinc & Hospital 41,658 6,249 504 1,330 313 768 0 0 425 1,193 1,180 20 0 0 1 1,247 2 0 2.86 5.01 1.02 0.6432 NGO 41,658 6,249 0 0 0 0 0 0 0 0 0 0 0 0 0 0 0 0 0.00 0.00 0.00 0.00Bhola District Total 41,658 6,249 6,443 5,339 1,615 2,810 15 1 657 3,483 3,361 141 0 111 261 3,426 28 0 8.36 25.85 1.58 1.7333 Jhalakathi District Hospital , Jhalkath 16,942 2,541 1,953 397 43 133 0 0 68 201 194 7 9 9 95 240 0 0 1.19 1.69 0.40 0.0034 Nalchithi Upazila Health Complex , Jhalkath 5,296 794 244 127 60 65 0 0 0 65 63 2 0 0 29 65 0 0 1.23 7.55 0.00 0.0035 Kathalia(amua) Upazila Health Complex , Jhalkath 3,340 501 68 63 9 43 0 0 0 43 69 1 0 0 6 18 1 1 1.29 1.80 0.00 11.1136 Rajapur Upazila Health Complex , Jhalkath 3,561 534 141 208 127 72 0 0 0 72 69 3 0 5 50 7 2 0 2.02 23.78 0.00 1.5737 MCWC 16,942 2,541 1,931 635 33 215 0 0 331 546 541 8 0 4 102 332 0 0 3.22 1.30 1.95 0.0038 Private Clinics & Hospitals 16,942 2,541 93 654 25 168 0 0 471 639 638 1 0 1 12 27 0 0 3.77 0.98 2.78 0.0039 NGO 16,942 2,541 2,100 9 0 9 0 0 0 9 9 0 0 0 2 548 0 0 0.05 0.00 0.00 0.00Jhalakhati District Total 16,942 2,541 6,530 2,093 297 705 0 0 870 1,575 1,583 22 9 19 296 1,237 3 1 9.30 11.69 5.14 1.0140 Patuakhali (250 Beded) Hospital , Patuakhal 35,827 5,374 540 2,778 2,249 321 0 8 493 822 771 60 227 206 391 135 12 9 2.29 41.85 1.38 0.5341 Bauphal Upazila Health Complex , Patuakhal 7,475 1,121 408 333 73 178 0 1 74 253 243 13 0 8 7 253 0 0 3.38 6.51 0.99 0.0042 Kalapara Upazila Health Complex , Patuakhal 4,943 741 3,689 1,090 412 347 14 0 290 651 637 19 1 0 74 570 1 0 13.17 55.57 5.87 0.2443 Dashmina Upazila Health Complex , Patuakhal 2,890 434 182 135 27 108 0 0 0 108 106 2 0 0 27 108 0 0 3.74 6.23 0.00 0.0044 Dumki UHC 1,755 263 2 13 0 13 0 0 0 13 13 0 0 0 0 1 0 0 0.74 0.00 0.00 0.0045 Galachipa Upazila Health Complex , Patuakhal 7,959 1,194 0 101 17 83 0 0 0 83 81 2 0 14 18 16 0 1 1.04 1.42 0.00 0.0046 Mirzaganj Upazila Health Complex , Patuakhal 2,865 430 32 32 11 18 0 0 0 18 17 1 0 3 12 18 0 0 0.63 2.56 0.00 0.0047 MCWC 35,827 5,374 2,760 588 147 324 0 3 201 528 528 7 0 14 105 830 1 0 1.47 2.74 0.56 0.6848 Private Clinics & Hospitals 35,827 5,374 957 2,120 1,100 269 0 0 1,516 1,785 1,759 35 154 65 23 194 2 8 4.98 20.47 4.23 0.1849 NGO 35,827 5,374 1,807 888 188 120 0 0 153 273 260 16 66 0 35 18 0 12 0.76 3.50 0.43 0.00Patuakhali District Total 35,827 5,374 10,377 8,078 4,224 1,781 14 12 2,727 4,534 4,415 155 448 310 692 2,143 16 30 12.66 78.60 7.61 0.3850 Perojpur District Hospital , Perojpur 26,899 4,035 393 776 212 102 0 3 62 167 162 5 66 2 83 231 2 0 0.62 5.25 0.23 0.9451 Mathbaria Upazila Health Complex , Perojpur 6,357 954 415 348 179 104 0 0 74 178 174 4 6 0 88 233 0 0 2.80 18.77 1.16 0.0052 Nazirpur Upazila Health Complex , Perojpur 4,323 648 1,802 1,204 977 637 0 0 340 977 965 26 0 0 16 906 1 1 22.60 150.67 7.87 0.1053 Bhandaria Upazila Health Complex , Perojpur 3,865 580 164 279 0 147 0 0 0 147 129 19 0 0 60 147 0 0 3.80 0.00 0.00 0.0054 Kawkhali Upazila Health Complex , Perojpur 1,814 272 59 58 14 34 0 0 0 34 34 0 0 0 14 34 0 0 1.87 5.15 0.00 0.0055 Nasarabad Upazila Health Complex , Perojpur 5,083 763 627 484 72 418 0 0 0 418 402 16 0 0 72 418 0 0 8.22 9.44 0.00 0.0056 Zia Nagar UHC 1,714 257 308 71 0 55 0 0 16 71 70 1 0 0 0 71 0 0 4.14 0.00 0.93 0.0057 MCWC 26,899 4,035 4,359 737 4 514 0 0 133 647 643 5 0 0 34 785 0 0 2.41 0.10 0.49 0.00Sl. No.Expected Birth(Jan-Dec 2010)EstimatedComplicaions(Jan-Jun 2010)ANC ServicesAdmittedPatientsComplicationstreatedNormalDeliveryForsafe/ Vacum/DestructiveVaginal Breech/FaceCaesareanTotalDeliveryLiveStillBirthBirthOther OperationsRefar InRefar OutPNC ServicesMaternal DeathNeonatal DeathProportion (%) ofall births in EmOCfacilitiesMet need (%) forEmOCCS as % of allbirthsCase Fatality Rate(CFR)
Table-A: Statistical data of 690 facilities during the period January to December, 2010 (including public, private and NGO facilities) (Contd...)09Type Of DeliveryOutcome ofDeliveryInstitute NameSl. No.Expected Birth(Jan-Dec 2010)EstimatedComplicaions(Jan-Jun 2010)ANC ServicesAdmittedPatientsComplicationstreatedNormalDeliveryForsafe/ Vacum/DestructiveVaginal Breech/FaceCaesareanTotalDeliveryLiveStillBirthBirthOther OperationsRefar InRefar OutPNC ServicesMaternal DeathNeonatal DeathProportion (%) ofall births in EmOCfacilitiesMet need (%) forEmOCCS as % of allbirthsCase Fatality Rate(CFR)58 Private Clinics & Hospitals 26,899 4,035 1,202 1,864 479 551 0 0 1,166 1,717 1,695 23 0 0 5 567 1 0 6.38 11.87 4.33 0.2159 NGO 26,899 4,035 453 431 0 14 0 0 33 47 47 0 0 0 0 47 0 0 0.17 0.00 0.12 0.00Pirojpur District Total 26,899 4,035 9,782 6,252 1,937 2,576 0 3 1,824 4,403 4,321 99 72 2 372 3,439 4 1 16.37 48.01 6.78 0.21Barisal Division 199,433 29,915 63,750 41,135 15,610 13,445 34 72 14,252 27,803 26,980 1,071 862 1,128 2,482 18,848 143 505 13.94 52.18 7.15 0.9260 Bandarban District Hospital , Bandarban 7,356 1,103 1,106 871 138 317 0 5 138 460 415 48 3 0 43 322 3 0 6.25 12.51 1.88 2.1761 Lama Upazila Health Complex , Bandarban 1,985 298 7,526 444 89 168 0 6 0 174 153 21 0 0 67 177 0 6 8.77 29.89 0.00 0.0062 Alikadam Upazila Health Complex , Bandarban 882 132 456 149 15 133 2 9 0 144 140 5 0 0 4 224 0 3 16.33 11.34 0.00 0.0063 Nykongchari Upazila Health Complex , Bandarban 1,328 199 245 168 27 123 0 0 0 123 114 9 0 0 20 123 0 0 9.26 13.55 0.00 0.0064 Rowangchari Upazila Health Complex , Bandarban 532 80 832 139 2 101 0 0 0 101 98 3 0 0 2 107 0 0 18.98 2.51 0.00 0.0065 Ruma Upazila Health Complex , Bandarban 618 93 37 60 0 55 0 0 0 55 55 0 5 1 5 56 0 0 8.90 0.00 0.00 0.0066 Thanchi Upazila Health Complex , Bandarban 395 59 0 0 0 0 0 0 0 0 0 0 0 0 0 0 0 0 0.00 0.00 0.00 0.0067 MCWC 7,356 1,103 2,614 393 23 368 0 0 0 368 359 9 0 0 28 677 0 0 5.00 2.08 0.00 0.0068 Private Clinics & Hospitals 7,356 1,103 0 0 0 0 0 0 0 0 0 0 0 0 0 0 0 0 0.00 0.00 0.00 0.0069 NGO 7,356 1,103 0 0 0 0 0 0 0 0 0 0 0 0 0 0 0 0 0.00 0.00 0.00 0.00Bandarban District Total 7,356 1,103 12,816 2,224 294 1,265 2 20 138 1,425 1,334 95 8 1 169 1,686 3 9 19.37 26.65 1.88 1.0270 B.baria (100 Beded) Hospital , B.baria 58,162 8,724 2,342 2,166 745 369 0 0 630 999 923 113 257 99 34 1,535 12 7 1.72 8.54 1.08 1.6171 Bancharampur Upazila Health Complex , B.baria 6,612 992 656 133 17 77 0 0 11 88 80 8 11 0 3 88 0 0 1.33 1.71 0.17 0.0072 Nasirnagar Upazila Health Complex , B.baria 6,204 931 302 59 17 42 0 0 0 42 37 5 0 1 9 39 0 0 0.68 1.83 0.00 0.0073 Sarail Upazila Health Complex , B.baria 6,358 954 556 244 36 188 0 0 3 191 184 7 0 0 23 204 0 1 3.00 3.77 0.05 0.0074 Akhaura Upazila Health Complex , B.baria 3,231 485 107 87 1 81 0 0 0 81 79 5 0 0 3 32 0 3 2.51 0.21 0.00 0.0075 Kashba Upazila Health Complex , B.baria 6,674 1,001 51 51 8 44 0 0 0 44 40 4 1 0 8 42 0 4 0.66 0.80 0.00 0.0076 Nabinagar Upazila Health Complex , B.baria 10,336 1,550 6,930 83 2 58 0 0 0 58 58 0 0 0 21 2,937 0 0 0.56 0.13 0.00 0.0077 MCWC 58,162 8,724 3,929 662 30 564 0 0 24 588 588 1 2 4 2 1,051 0 0 1.01 0.34 0.04 0.0078 Private Clinics & Hospitals 58,162 8,724 535 645 350 206 7 0 317 530 684 5 2 0 34 188 0 0 0.91 4.01 0.55 0.0079 NGO 58,162 8,724 0 0 0 0 0 0 0 0 0 0 0 0 0 0 0 0 0.00 0.00 0.00 0.00Brahmanbaria District Total 58,162 8,724 15,408 4,130 1,206 1,629 7 0 985 2,621 2,673 148 273 104 137 6,116 12 15 4.51 13.82 1.69 1.0080 Chittagong Medical College Hospital , Chittagong 160,052 24,008 18,695 16,184 6,922 6,855 293 274 6,097 13,519 13,036 679 1,368 2,515 0 13,405 128 213 8.45 28.83 3.81 1.8581 Chittagong (200 beded) Hospital , Chittagong 160,052 24,008 2,037 725 204 319 13 4 283 619 611 9 7 81 5 717 0 1 0.39 0.85 0.18 0.0082 Banshkhali Upazila Health Complex , Chittagong 9,503 1,425 1,364 757 264 335 55 11 32 433 409 25 73 101 95 1,229 0 0 4.56 18.52 0.34 0.0083 Fatikchari Upazila Health Complex , Chittagong 10,764 1,615 2,185 2,903 696 2,274 0 13 234 2,521 2,477 56 45 94 104 2,746 0 0 23.42 43.11 2.17 0.0084 Lohagara Upazila Health Complex , Chittagong 6,523 978 634 1,488 234 1,223 2 9 8 1,242 1,188 54 19 0 214 490 0 0 19.04 23.92 0.12 0.0085 Mirersarai Upazila Health Complex , Chittagong 8,713 1,307 1,445 1,936 852 780 154 4 132 1,070 1,047 30 12 0 393 1,040 3 0 12.28 65.19 1.52 0.3586 Potiya Upazila Health Complex , Chittagong 7,845 1,177 1,473 2,183 252 1,945 0 0 18 1,963 1,949 24 0 0 203 2,019 0 0 25.02 21.41 0.23 0.0087 Anwara Upazila Health Complex , Chittagong 5,461 819 280 384 45 326 0 0 0 326 321 5 0 0 48 105 0 0 5.97 5.49 0.00 0.0088 Boalkhali Upazila Health Complex , Chittagong 4,719 708 2,490 444 91 353 0 0 0 353 347 6 0 0 52 754 0 0 7.48 12.86 0.00 0.0089 Chandanaish Upazila Health Complex , Chittagong 4,612 692 388 288 42 237 0 0 0 237 237 0 0 0 36 194 0 0 5.14 6.07 0.00 0.0090 Hathazari Upazila Health Complex , Chittagong 9,693 1,454 1,186 581 105 405 0 2 6 413 408 5 1 0 95 403 0 0 4.26 7.22 0.06 0.0091 Rangunia Upazila Health Complex , Chittagong 7,306 1,096 1,164 181 32 146 0 0 0 146 143 3 0 0 34 266 0 0 2.00 2.92 0.00 0.0092 Rowzan Upazila Health Complex , Chittagong 8,112 1,217 1,071 966 57 843 0 0 0 843 835 8 0 0 66 766 0 1 10.39 4.68 0.00 0.0093 Sandwip Upazila Health Complex , Chittagong 7,165 1,075 744 58 2 56 0 0 0 56 55 1 0 0 2 56 0 0 0.78 0.19 0.00 0.0094 Satkania Upazila Health Complex , Chittagong 8,284 1,243 347 432 44 389 0 0 0 389 372 17 0 0 38 381 0 0 4.70 3.54 0.00 0.0095 Sitakunda Upazila Health Complex , Chittagong 8,198 1,230 2,562 319 66 224 0 0 0 224 219 5 0 0 68 212 0 3 2.73 5.37 0.00 0.0096 MCWC 160,052 24,008 740 167 12 146 0 0 0 146 145 2 0 0 15 149 0 0 0.09 0.05 0.00 0.0097 Private Clinics & Hospitals 160,052 24,008 4,615 1,392 96 696 18 0 521 1,235 1,230 10 15 239 38 1,016 0 0 0.77 0.40 0.33 0.0098 NGO 160,052 24,008 12,405 1,847 200 1,129 6 0 602 1,737 1,779 4 27 615 89 2,300 0 0 1.09 0.83 0.38 0.00Chittagong District Total 160,052 24,008 55,825 33,235 10,216 18,681 541 317 7,933 27,472 26,808 943 1,567 3,645 1,595 28,248 131 218 17.16 42.55 4.96 1.2899 Comilla Medical College Hospital , Comill 112,297 16,845 1,754 4,164 3,193 761 5 11 1,844 2,621 2,482 206 318 23 63 143 26 104 2.33 18.96 1.64 0.81100 Comilla District Hospital , Comilla 112,297 16,845 1,114 1,348 166 383 0 4 656 1,043 1,027 26 102 85 56 1,163 1 9 0.93 0.99 0.58 0.60101 Daudkandi Upazila Health Complex , Comilla 13,383 2,007 8,678 2,769 1,164 1,832 8 12 323 2,175 2,116 61 400 0 78 2,440 0 0 16.25 57.98 2.41 0.00102 Barura Upazila Health Complex , Comilla 8,538 1,281 442 230 56 174 0 0 0 174 160 14 0 0 5 167 0 0 2.04 4.37 0.00 0.00103 Brahmmanpara Upazila Health Complex , Comilla 4,439 666 72 62 6 57 0 0 0 57 54 3 0 0 5 63 0 0 1.28 0.90 0.00 0.00104 Burichong Upazila Health Complex , Comilla 6,339 951 229 167 0 144 0 0 0 144 144 0 4 0 19 123 0 0 2.27 0.00 0.00 0.00105 Chandina Upazila Health Complex , Comilla 7,480 1,122 365 427 58 380 0 0 0 380 353 27 0 0 63 312 0 2 5.08 5.17 0.00 0.00106 Chaddagram Upazila Health Complex , Comilla 9,251 1,388 976 976 32 830 0 0 0 830 822 8 0 0 130 729 0 0 8.97 2.31 0.00 0.00107 Debidwar Upazila Health Complex , Comilla 9,315 1,397 212 233 32 202 0 0 0 202 188 15 0 4 27 170 0 12 2.17 2.29 0.00 0.00108 Homna Upazila Health Complex , Comilla 4,693 704 241 496 134 344 0 10 0 354 342 12 121 0 80 322 0 0 7.54 19.04 0.00 0.00109 Laksham Upazila Health Complex , Comilla 13,330 1,999 1,025 1,225 34 674 0 0 0 674 615 64 0 0 270 435 0 1 5.06 1.70 0.00 0.00110 Meghna UHC 2,627 394 111 10 5 5 0 0 0 5 5 0 0 0 5 5 0 0 0.19 1.27 0.00 0.00111 Mohorgonj UHC 5,802 870 0 0 0 0 0 0 0 0 0 0 0 0 0 0 0 0 0.00 0.00 0.00 0.00112 Muradnagar Upazila Health Complex , Comilla 11,430 1,714 220 136 39 97 0 0 0 97 91 6 0 0 34 83 0 4 0.85 2.27 0.00 0.00113 Nangolkot Upazila Health Complex , Comilla 7,814 1,172 207 207 0 136 1 0 0 137 130 7 17 5 53 135 0 0 1.75 0.00 0.00 0.00114 Titas UHC 4,622 693 263 147 2 82 0 0 0 82 80 3 3 3 5 135 13 0 1.77 0.29 0.00 650.00
Table-A: Statistical data of 690 facilities during the period January to December, 2010 (including public, private and NGO facilities) (Contd...)10Type Of DeliveryOutcome ofDeliverySl. No.Expected Birth(Jan-Dec 2010)EstimatedComplicaions(Jan-Jun 2010)ANC ServicesAdmittedPatientsComplicationstreatedNormalDeliveryForsafe/ Vacum/DestructiveVaginal Breech/FaceInstitute NameCaesareanTotalDeliveryLiveStillBirthBirthOther OperationsRefar InRefar OutPNC ServicesMaternal DeathNeonatal DeathProportion (%) ofall births in EmOCfacilitiesMet need (%) forEmOCCS as % of allbirthsCase Fatality Rate(CFR)115 Sadar South UHC 8,999 1,350 35 35 17 7 0 1 27 35 35 0 0 0 0 0 0 0 0.39 1.26 0.30 0.00116 Rajdebi MCWC 112,297 16,845 17,229 1,124 356 777 0 0 284 1,061 1,115 0 0 51 9 3,554 0 0 0.94 2.11 0.25 0.00117 Privet Clinc & Hospital 112,297 16,845 241 495 204 86 0 5 384 475 471 6 17 0 0 144 0 3 0.42 1.21 0.34 0.00118 NGO 112,297 16,845 1,382 1,112 539 440 0 4 509 953 953 9 153 205 128 1,130 0 0 0.85 3.20 0.45 0.00Comilla District Total 112,297 16,845 34,796 15,363 6,037 7,411 14 47 4,027 11,499 11,183 467 1,135 376 1,030 11,253 40 135 10.24 35.84 3.59 0.66119 Coxs Bazar District Hospital , Coxs Bazar 43,036 6,455 2,584 3,056 1,971 865 6 58 1,506 2,435 2,221 248 13 648 67 2,434 11 33 5.66 30.53 3.50 0.56120 Teknaf Upazila Health Complex , Coxs Bazar 4,916 737 451 921 91 832 0 0 0 832 823 9 0 0 77 222 0 0 16.93 12.34 0.00 0.00121 Chakaria Upazila Health Complex , Coxs Bazar 12,285 1,843 91 77 0 66 0 0 0 66 65 1 0 3 11 50 0 0 0.54 0.00 0.00 0.00122 Kutubdia Upazila Health Complex , Coxs Bazar 2,599 390 31 8 0 7 0 0 0 7 7 0 0 0 6 3 0 0 0.27 0.00 0.00 0.00123 Moheshkhali Upazila Health Complex , Coxs Baza 6,029 904 36 79 12 45 0 0 0 45 43 2 0 0 24 13 0 0 0.75 1.33 0.00 0.00124 Ramu Upazila Health Complex , Coxs Bazar 4,945 742 3,781 877 139 682 1 7 48 738 725 17 0 1 138 710 0 2 14.92 18.74 0.97 0.00125 Ukhyia Upazila Health Complex , Coxs Bazar 3,773 566 1,532 1,074 48 1,030 0 0 0 1,030 1,025 11 0 0 46 980 0 0 27.30 8.48 0.00 0.00126 MCWC 43,036 6,455 10,530 1,107 51 782 0 15 34 831 779 57 0 187 104 2,036 0 3 1.93 0.79 0.08 0.00127 Private Clinics & Hospitals 43,036 6,455 6,359 1,811 219 864 137 179 582 1,762 1,717 67 121 22 16 677 0 2 4.09 3.39 1.35 0.00128 NGO 43,036 6,455 2,674 403 49 350 0 0 0 350 343 7 0 0 53 601 0 1 0.81 0.76 0.00 0.00Coxs Bazar District Total 43,036 6,455 28,069 9,413 2,580 5,523 144 259 2,170 8,096 7,748 419 134 861 542 7,726 11 41 18.81 39.97 5.04 0.43129 Feni District Hospital , Feni 29,496 4,424 3,205 4,256 3,580 1,486 0 37 1,530 3,053 2,923 165 38 1,530 84 3,124 4 0 10.35 80.91 5.19 0.11130 Parsuram Upazila Health Complex , Feni 4,844 727 1,620 685 226 333 1 11 79 424 409 20 103 9 59 1,215 0 0 8.75 31.11 1.63 0.00131 Chhagalnaya Upazila Health Complex , Fen 4,034 605 262 80 29 51 0 0 0 51 48 3 0 3 26 59 0 0 1.26 4.79 0.00 0.00132 Daganbhuiya Upazila Health Complex , Fen 4,951 743 3,478 190 37 120 0 0 4 124 122 2 11 0 39 434 0 0 2.50 4.98 0.08 0.00133 Phulgazi UHC 2,848 427 1,837 128 17 110 0 0 0 110 110 0 0 0 18 631 0 0 3.86 3.98 0.00 0.00134 Sonagazi Upazila Health Complex , Fen 5,740 861 935 111 13 97 0 0 0 97 96 1 0 0 13 665 0 0 1.69 1.51 0.00 0.00135 MCWC 29,496 4,424 11,216 814 161 649 0 0 74 723 718 5 1 0 87 273 0 1 2.45 3.64 0.25 0.00136 Private Clinic & Hospitals 29,496 4,424 4,757 3,356 2,146 860 0 0 2,133 2,993 2,963 35 129 0 8 718 0 0 10.15 48.50 7.23 0.00137 NGO 29,496 4,424 14,076 0 0 0 0 0 0 0 0 0 0 0 0 3,209 0 0 0.00 0.00 0.00 0.00Feni District Total 29,496 4,424 41,386 9,620 6,209 3,706 1 48 3,820 7,575 7,389 231 282 1,542 334 10,328 4 1 25.68 140.33 12.95 0.06138 Khagrachari District Hospital , Khagrachar 12,643 1,896 2,450 1,729 608 834 76 23 223 1,156 1,114 65 305 101 22 1,984 4 0 9.14 32.06 1.76 0.66139 Panchari Upazila Health Complex , Khagrachar 1,555 233 3,602 146 37 108 0 1 0 109 102 7 3 0 26 385 0 5 7.01 15.86 0.00 0.00140 Dighinala Upazila Health Complex , Khagrachar 2,238 336 0 0 0 0 0 0 0 0 0 0 0 0 0 0 0 0 0.00 0.00 0.00 0.00141 Laxmichari Upazila Health Complex , Khagrachar 530 80 1 1 0 1 0 0 0 1 1 0 0 0 0 0 0 0 0.19 0.00 0.00 0.00142 Manikchari Upazila Health Complex , Khagrachar 1,232 185 81 55 12 54 0 0 0 54 46 9 0 0 1 47 0 1 4.38 6.49 0.00 0.00143 Matiranga Upazila Health Complex , Khagrachar 2,470 370 29 29 0 29 0 0 0 29 27 2 0 0 0 29 0 0 1.17 0.00 0.00 0.00144 Mohalchari Upazila Health Complex , Khagrachar 1,091 164 1 0 0 0 0 0 0 0 0 0 0 0 1 0 0 0 0.00 0.00 0.00 0.00145 Ramgarh Upazila Health Complex , Khagrachar 1,307 196 37 37 1 36 0 0 0 36 36 0 0 0 1 18 0 0 2.76 0.51 0.00 0.00146 MCWC 12,643 1,896 130 90 50 25 2 1 13 41 36 5 10 10 1 20 0 0 0.32 2.64 0.10 0.00147 Private Clinic & Hospitals 12,643 1,896 36 14 3 5 0 0 3 8 8 0 0 0 5 0 0 0 0.06 0.16 0.02 0.00148 NGO 12,643 1,896 10 8 2 1 0 0 0 1 1 1 0 0 5 0 0 0 0.01 0.11 0.00 0.00Khagrachari District Total 12,643 1,896 6,377 2,109 713 1,093 78 25 239 1,435 1,371 89 318 111 62 2,483 4 6 11.35 37.60 1.89 0.56149 Laxmipur District Hospital , Laxmipur 36,358 5,454 1,629 1,182 918 325 34 7 165 531 459 72 133 131 5 358 9 0 1.46 16.83 0.45 0.98150 Ramganj Upazila Health Complex , Laxmipur 6,959 1,044 674 145 68 55 0 0 3 58 55 3 0 1 15 47 0 0 0.83 6.51 0.04 0.00151 Ramgati Upazila Health Complex , Laxmipur 9,620 1,443 559 473 82 276 0 0 90 366 360 9 0 2 20 656 1 3 3.80 5.68 0.94 1.22152 Raipur Upazila Health Complex , Laxmipur 5,792 869 2,653 476 173 317 0 0 102 419 402 17 0 49 44 401 0 0 7.23 19.91 1.76 0.00153 MCWC 36,358 5,454 1,683 872 109 739 0 10 87 836 835 3 0 0 24 606 3 1 2.30 2.00 0.24 2.75154 Private Clinic & Hospitals 36,358 5,454 2,471 3,000 2,214 629 65 15 1,869 2,578 2,414 225 2 0 4 644 0 0 7.09 40.60 5.14 0.00155 NGO 36,358 5,454 0 0 0 0 0 0 0 0 0 0 0 0 0 0 0 0 0.00 0.00 0.00 0.00Lakshmipur District Total 36,358 5,454 9,669 6,148 3,564 2,341 99 32 2,316 4,788 4,525 329 135 183 112 2,712 13 4 13.17 65.35 6.37 0.36156 Noakhali (200 beded) Hospital , Noakhal 62,874 9,431 3,643 3,557 616 1,075 2 35 960 2,072 1,841 261 383 26 18 2,695 22 0 3.30 6.53 1.53 3.57157 Companiganj Upazila Health Complex , Noakhal 5,247 787 1,295 865 316 362 1 7 140 510 479 33 0 0 71 124 0 0 9.72 40.15 2.67 0.00158 Hatiya Upazila Health Complex , Noakhal 8,345 1,252 73 62 16 39 0 1 0 40 29 11 0 0 20 43 4 2 0.48 1.28 0.00 25.00159 Begumganj Upazila Health Complex , Noakhal 18,761 2,814 0 0 0 0 0 0 0 0 0 0 0 0 0 0 0 0 0.00 0.00 0.00 0.00160 Chatkhil Upazila Health Complex , Noakhal 5,174 776 4,992 738 0 382 2 12 339 735 716 19 0 0 3 1,589 0 0 14.20 0.00 6.55 0.00161 Kabirhat UHC 4,671 701 12 16 7 10 0 0 0 10 7 3 0 0 5 14 0 0 0.21 1.00 0.00 0.00162 Senbag Upazila Health Complex , Noakhal 6,626 994 66 145 45 99 0 0 0 99 97 3 0 7 45 111 0 0 1.49 4.53 0.00 0.00163 Sonaimuri UHC 8,128 1,219 20 41 15 27 0 0 0 27 25 2 0 1 13 10 0 3 0.33 1.23 0.00 0.00164 Subornachar UHC 7,206 1,081 0 0 0 0 0 0 0 0 0 0 0 0 0 0 0 0 0.00 0.00 0.00 0.00165 MCWC 62,874 9,431 412 72 0 66 0 1 5 72 72 0 0 0 1 103 0 0 0.11 0.00 0.01 0.00166 Private Clinic & Hospital 62,874 9,431 1,867 5,066 1,489 1,591 3 96 3,070 4,760 4,667 96 0 0 3 1,363 0 3 7.57 15.79 4.88 0.00167 NGO 62,874 9,431 1,852 200 72 141 0 0 0 141 134 7 0 0 62 421 0 0 0.22 0.76 0.00 0.00Noakhali District Total 62,874 9,43114,232 10,762 2,576 3,792 8 152 4,514 8,466 8,067 435 383 34 241 6,473 26 8 13.47 27.31 7.18 1.01168 Rangamati (100 Beded) Hospital , Rangamat 12,843 1,926 527 985 298 347 0 6 7 360 339 22 71 0 53 63 0 0 2.80 15.47 0.05 0.00169 Bagaichari Upazila Health Complex , Rangamat 2,038 306 151 94 24 59 0 0 0 59 54 5 0 0 35 2 0 0 2.89 7.85 0.00 0.00170 Barkol Upazila Health Complex , Rangamat 1,043 157 5 4 2 2 0 0 0 2 2 0 0 0 2 2 0 0 0.19 1.28 0.00 0.00
Table-A: Statistical data of 690 facilities during the period January to December, 2010 (including public, private and NGO facilities) (Contd...)11Type Of DeliveryOutcome ofDeliverySl. No.Expected Birth(Jan-Dec 2010)EstimatedComplicaions(Jan-Jun 2010)ANC ServicesAdmittedPatientsComplicationstreatedNormalDeliveryForsafe/ Vacum/DestructiveVaginal Breech/FaceInstitute NameCaesareanTotalDeliveryLiveStillBirthBirthOther OperationsRefar InRefar OutPNC ServicesMaternal DeathNeonatal DeathProportion (%) ofall births in EmOCfacilitiesMet need (%) forEmOCCS as % of allbirthsCase Fatality Rate(CFR)171 Belaichari Upazila Health Complex , Rangamat 629 94 27 20 2 17 0 0 0 17 15 2 0 0 1 12 0 0 2.70 2.12 0.00 0.00172 Jhuraichari Upazila Health Complex , Rangamat 577 87 2 3 0 3 0 0 0 3 3 0 0 0 0 4 0 0 0.52 0.00 0.00 0.00173 Kaptai Upazila Health Complex , Rangamat 1,720 258 0 0 0 0 0 0 0 0 0 0 0 0 0 0 0 0 0.00 0.00 0.00 0.00174 Kowkhali Upazila Health Complex , Rangamat 1,213 182 73 16 0 16 0 0 0 16 16 0 0 0 0 5 0 0 1.32 0.00 0.00 0.00175 Langadu Upazila Health Complex , Rangamat 1,684 253 19 51 14 37 0 0 0 37 37 0 0 0 14 32 0 0 2.20 5.54 0.00 0.00176 Naniarchar Upazila Health Complex , Rangamat 935 140 1 11 0 11 0 0 0 11 11 0 0 0 0 1 0 0 1.18 0.00 0.00 0.00177 Rajstali Upazila Health Complex , Rangamat 572 86 2 20 1 9 0 0 0 9 9 0 0 0 9 6 0 0 1.57 1.17 0.00 0.00178 MCWC 12,843 1,926 1,640 584 46 285 35 2 114 436 425 20 0 49 40 698 0 0 3.39 2.39 0.89 0.00179 Private Clinic & Hospital 12,843 1,926 185 184 114 20 0 0 114 134 132 2 29 13 0 149 0 0 1.04 5.92 0.89 0.00180 NGO 12,843 1,926 8,756 1,232 4 698 9 11 350 1,068 1,048 27 1 3 165 347 0 6 8.32 0.21 2.73 0.00Rangamati District Total 12,843 1,926 11,388 3,204 505 1,504 44 19 585 2,152 2,091 78 101 65 319 1,321 0 6 16.76 26.21 4.55 0.00181 Chandpur District Hospital , Chandpur 54,812 8,222 882 2,128 310 1,267 0 0 393 1,660 1,534 126 66 0 96 1,322 11 49 3.03 3.77 0.72 3.55182 Faridganj Upazila Health Complex , Chandpur 9,167 1,375 479 451 55 344 0 0 0 344 343 5 213 50 48 406 0 0 3.75 4.00 0.00 0.00183 Matlab (SOUTH) Upazila Health Complex , Chandpur 4,436 665 130 430 22 186 0 0 27 213 211 2 199 13 50 194 0 0 4.80 3.31 0.61 0.00184 Saharasthi Upazila Health Complex , Chandpur 4,986 748 596 1,379 6 447 0 1 606 1,054 1,017 37 0 0 37 1,006 0 1 21.14 0.80 12.16 0.00185 Haimchar Upazila Health Complex , Chandpur 3,019 453 401 266 0 216 0 1 0 217 204 13 0 0 49 217 0 0 7.19 0.00 0.00 0.00186 Haziganj Upazila Health Complex , Chandpur 7,139 1,071 121 141 35 78 0 0 6 84 80 4 0 0 17 84 1 1 1.18 3.27 0.08 2.86187 Kachua Upazila Health Complex , Chandpur 15,435 2,315 240 173 0 128 0 0 0 128 107 21 0 0 41 128 0 0 0.83 0.00 0.00 0.00188 Matlab (Uttar) UHC 7,271 1,091 617 191 8 156 0 5 0 161 155 6 0 0 24 132 0 2 2.21 0.73 0.00 0.00189 MCWC 54,812 8,222 4,699 832 94 552 0 1 123 676 667 10 0 111 40 763 0 0 1.23 1.14 0.22 0.00190 Private Clinics & Hospitals 54,812 8,222 4,630 3,268 998 844 0 0 1,834 2,678 2,633 47 73 253 81 2,808 1 5 4.89 12.14 3.35 0.10191 NGO 54,812 8,222 8,417 158 42 112 0 0 24 136 137 0 0 0 21 3,205 0 0 0.25 0.51 0.04 0.00Chandpur District Total 54,812 8,222 21,212 9,417 1,570 4,330 0 8 3,013 7,351 7,088 271 551 427 504 10,265 13 58 13.41 19.10 5.50 0.83Chittagong Division 589,928 88,489 251,178 105,625 35,470 51,275 938 927 29,740 82,880 80,277 3,505 4,887 7,349 5,045 88,611 257 501 14.05 40.08 5.04 0.72192 Dhaka Medical College Hospital, Dhaka 210,800 31,620 8,698 17,737 14,011 5,731 190 199 4,211 10,331 10,267 535 75 27 27 11,701 226 229 4.90 44.31 2.00 1.61193 Shaheed Suhrawardy Hospital, Dhaka 210,800 31,620 33,744 11,734 1,882 3,479 86 104 5,351 9,020 8,888 163 1,247 792 46 6,556 21 0 4.28 5.95 2.54 1.12194 SirSalimullhMedicalCollegeHospital ,Mitford ,Dhak 210,800 31,620 0 1,847 174 436 0 4 921 1,361 1,363 2 0 0 0 0 0 1 0.65 0.55 0.44 0.00195 Dohar Upazila Health Complex , Dhaka 4,678 702 1,584 670 154 239 16 0 216 471 467 8 0 0 38 663 0 0 10.07 21.94 4.62 0.00196 Keraniganj Upazila Health Complex , Dhaka 14,802 2,220 2,148 202 37 87 0 2 73 162 169 0 11 10 56 452 0 0 1.09 1.67 0.49 0.00197 Nawabganj Upazila Health Complex , Dhaka 7,184 1,078 3,558 810 184 284 0 0 244 528 521 8 39 456 143 1,644 1 0 7.35 17.07 3.40 0.54198 Dhamrai Upazila Health Complex , Dhaka 8,500 1,275 6,330 961 418 428 0 0 331 759 743 21 37 8 97 1,256 2 0 8.93 32.79 3.89 0.48199 Dhaka Sarkary Karmachari Hospital 5,230 785 0 0 0 0 0 0 0 0 0 0 0 0 0 0 0 0 0.00 0.00 0.00 0.00200 Metijel GOD 5,994 899 174 61 2 53 0 0 0 53 53 0 0 0 2 117 0 0 0.88 0.22 0.00 0.00201 Savar Upazila Health Complex , Dhaka 14,745 2,212 2,870 480 78 215 0 0 170 385 383 2 0 11 42 1,040 0 0 2.61 3.53 1.15 0.00202 MCWC 210,800 31,620 0 0 0 0 0 0 0 0 0 0 0 0 0 0 0 0 0.00 0.00 0.00 0.00203 Private Clinics & Hospitals 210,800 31,620 28,059 16,510 4,064 6,510 132 11 9,142 15,795 15,873 77 0 2 40 13,022 2 11 7.49 12.85 4.34 0.05204 NGO 210,800 31,620 0 0 0 0 0 0 0 0 0 0 0 0 0 0 0 0 0.00 0.00 0.00 0.00Dhaka District Total 210,800 31,620 87,165 51,012 21,004 17,462 424 320 20,659 38,865 38,727 816 1,409 1,306 491 36,451 252 241 18.44 66.43 9.80 1.20205 Faridpur Medical College Hospital, Faridpur 42,624 6,394 2,013 4,078 1,904 779 0 0 1,092 1,871 1,738 150 0 0 5 1,856 37 0 4.39 29.78 2.56 1.94206 Faridpur District Hospital , Faridpur 42,624 6,394 2,843 2,694 2,390 999 2 0 851 1,852 1,812 52 227 18 1 2,620 1 0 4.34 37.38 2.00 0.04207 Alfadanga Upazila Health Complex , Faridpur 2,295 344 667 549 222 219 0 3 11 233 230 5 26 4 45 393 0 0 10.15 64.48 0.48 0.00208 Bhanga Upazila Health Complex , Faridpur 5,633 845 762 970 605 358 4 0 252 614 611 6 0 0 73 598 0 0 10.90 71.60 4.47 0.00209 Boalmari Upazila Health Complex , Faridpur 5,710 857 2,063 523 134 379 0 0 14 393 387 6 0 0 58 767 0 0 6.88 15.64 0.25 0.00210 Charbhadrason Upazila Health Complex , Faridpur 1,837 276 290 179 76 73 0 0 0 73 72 1 0 2 8 97 0 0 3.97 27.58 0.00 0.00211 Modhukhali Upazila Health Complex , Faridpu 4,580 687 209 302 4 240 0 0 0 240 237 3 0 0 33 205 0 0 5.24 0.58 0.00 0.00212 Nagarkanda Upazila Health Complex , Faridpur 7,913 1,187 1,584 386 124 181 0 4 0 185 180 8 0 0 25 284 0 0 2.34 10.45 0.00 0.00213 Sadarpur Upazila Health Complex , Faridpur 4,514 677 264 106 54 46 0 0 0 46 46 0 0 0 12 65 0 0 1.02 7.98 0.00 0.00214 MCWC 42,624 6,394 5,088 809 181 539 0 0 253 792 770 24 0 0 3 2,328 0 0 1.86 2.83 0.59 0.00215 Private Clinics & Hospitals 42,624 6,394 8,325 7,031 2,152 1,342 0 0 4,894 6,236 6,238 8 37 0 602 10,651 0 0 14.63 33.66 11.48 0.00216 NGO 42,624 6,394 0 0 0 0 0 0 0 0 0 0 0 0 0 0 0 0 0.00 0.00 0.00 0.00Faridpur District Total 42,624 6,39424,108 17,627 7,846 5,155 6 7 7,367 12,535 12,321 263 290 24 865 19,864 38 0 29.41 122.72 17.28 0.48217 Gazipur District Hospital , Gazipur 49,486 7,423 4,940 2,691 1,209 888 23 33 212 1,156 1,115 45 484 135 192 2,342 4 0 2.34 16.29 0.43 0.33218 Kaliakair Upazila Health Complex , Gazipur 6,238 936 7,582 1,147 362 511 0 0 188 699 678 22 38 0 51 2,197 0 0 11.21 38.69 3.01 0.00219 Kaliganj Upazila Health Complex , Gazipur 5,862 879 2,428 1,014 347 405 0 2 249 656 639 17 37 0 78 557 2 0 11.19 39.47 4.25 0.58220 Kapasia Upazila Health Complex , Gazipur 7,776 1,166 687 340 107 172 0 0 59 231 228 3 0 0 83 228 0 0 2.97 9.17 0.76 0.00221 Sreepur Upazila Health Complex , Gazipur 15,666 2,350 704 89 17 72 0 0 0 72 71 1 0 0 17 277 0 0 0.46 0.72 0.00 0.00222 Tongi Hospital 11,297 1,695 2,849 757 212 203 0 0 167 370 360 10 187 0 45 312 0 0 3.28 12.51 1.48 0.00223 Private Clinics & Hospitals 49,486 7,42315,126 8,463 4,794 2,666 46 123 4,674 7,509 7,531 28 381 306 183 7,270 2 0 15.17 64.58 9.45 0.04224 NGO 49,486 7,423 0 0 0 0 0 0 0 0 0 0 0 0 0 0 0 0 0.00 0.00 0.00 0.00Gazipur District Total 49,486 7,423 34,316 14,501 7,048 4,917 69 158 5,549 10,693 10,622 126 1,127 441 649 13,183 8 0 21.61 94.95 11.21 0.11225 Gopalganj District Hospital , Gopalganj 28,171 4,226 1,831 1,193 558 287 0 0 325 612 597 18 13 17 3 623 6 17 2.17 13.20 1.15 1.08226 Kotwalipara Upazila Health Complex , Gopalgan 5,557 834 848 767 382 194 0 0 98 292 292 6 46 0 33 293 1 1 5.25 45.82 1.76 0.26
Table-A: Statistical data of 690 facilities during the period January to December, 2010 (including public, private and NGO facilities) (Contd...)12Type Of DeliveryOutcome ofDeliverySl. No.Expected Birth(Jan-Dec 2010)EstimatedComplicaions(Jan-Jun 2010)ANC ServicesAdmittedPatientsComplicationstreatedNormalDeliveryForsafe/ Vacum/DestructiveVaginal Breech/FaceInstitute NameCaesareanTotalDeliveryLiveStillBirthBirthOther OperationsRefar InRefar OutPNC ServicesMaternal DeathNeonatal DeathProportion (%) ofall births in EmOCfacilitiesMet need (%) forEmOCCS as % of allbirthsCase Fatality Rate(CFR)227 Tungipara Upazila Health Complex , Gopalganj 2,320 348 3,493 937 470 421 12 2 203 638 625 15 87 0 1 1,671 1 0 27.50 135.08 8.75 0.21228 Kassiani Upazila Health Complex , Gopalganj 5,637 846 361 177 13 153 0 0 0 153 153 1 0 0 24 169 1 0 2.71 1.54 0.00 7.69229 Mukshedpur Upazila Health Complex , Gopalganj 6,822 1,023 296 120 13 96 0 0 0 96 96 0 0 0 14 85 0 0 1.41 1.27 0.00 0.00230 MCWC 28,171 4,226 2,267 325 0 264 0 0 39 303 303 0 1 0 10 667 0 0 1.08 0.00 0.14 0.00231 Private Clinics & Hospitals 28,171 4,226 0 2,242 868 472 0 0 1,691 2,163 2,161 5 0 0 17 71 0 0 7.68 20.54 6.00 0.00232 NGO 28,171 4,226 0 0 0 0 0 0 0 0 0 0 0 0 0 0 0 0 0.00 0.00 0.00 0.00Gopalganj District Total 28,171 4,226 9,096 5,761 2,304 1,887 12 2 2,356 4,257 4,227 45 147 17 102 3,579 9 18 15.11 54.52 8.36 0.39233 Jamalpur (100 Beded) Hospital , Jamalpur 51,510 7,727 5,895 4,380 1,161 949 23 20 1,047 2,039 1,916 143 563 131 64 2,236 4 0 3.96 15.03 2.03 0.34234 Dewanganj Upazila Health Complex , Jamalpur 5,606 841 1,157 436 124 223 0 0 19 242 218 24 0 0 61 340 1 0 4.32 14.75 0.34 0.81235 Sarisabari Upazila Health Complex , Jamalpur 7,767 1,165 5,119 2,374 464 1,275 21 9 114 1,419 1,410 10 42 0 321 3,632 0 0 18.27 39.83 1.47 0.00236 Bakshiganj Upazila Health Complex , Jamalpu 4,351 653 1,064 491 262 216 8 2 0 226 214 12 56 0 102 332 1 0 5.19 40.15 0.00 0.38237 Islampur Upazila Health Complex , Jamalpur 7,045 1,057 387 181 65 108 0 0 0 108 102 6 0 6 34 115 0 0 1.53 6.15 0.00 0.00238 Madarganj Upazila Health Complex , Jamalpur 5,701 855 1,355 189 100 92 0 0 0 92 87 5 2 0 40 122 0 0 1.61 11.69 0.00 0.00239 Melandaha Upazila Health Complex , Jamalpur 7,134 1,070 1,267 108 46 59 0 0 0 59 59 1 2 4 35 103 0 0 0.83 4.30 0.00 0.00240 MCWC 51,510 7,727 3,054 646 42 497 7 3 43 550 542 8 47 9 36 932 0 0 1.07 0.54 0.08 0.00241 Private Clinics & Hospitals 51,510 7,727 2,951 2,070 1,396 340 6 22 1,320 1,688 1,687 10 294 34 22 406 0 0 3.28 18.07 2.56 0.00242 NGO 51,510 7,727 0 0 0 0 0 0 0 0 0 0 0 0 0 0 0 0 0.00 0.00 0.00 0.00Jamalpur District Total 51,510 7,727 22,249 10,875 3,660 3,759 65 56 2,543 6,423 6,235 219 1,006 184 715 8,218 6 0 12.47 47.37 4.94 0.16243 Kishoreganj District Hospital , Kishoregan 62,546 9,382 4,281 4,549 2,919 1,021 0 6 1,518 2,545 2,438 134 385 115 70 1,548 23 0 4.07 31.11 2.43 0.79244 Bhairab Upazila Health Complex , Kishoreganj 6,037 906 1,482 974 239 486 0 40 216 742 692 54 18 0 21 795 0 1 12.29 26.39 3.58 0.00245 Karimganj Upazila Health Complex , Kishoregan 6,159 924 653 341 149 166 0 0 0 166 163 3 0 0 74 143 0 0 2.70 16.13 0.00 0.00246 Mithamoin Upazila Health Complex , Kishoregan 2,981 447 531 151 27 102 2 2 0 106 96 10 0 0 18 245 0 0 3.56 6.04 0.00 0.00247 Nikhli Upazila Health Complex , Kishoregan 2,914 437 290 87 37 54 0 1 0 55 54 2 0 0 14 67 0 0 1.89 8.46 0.00 0.00248 Astagram Upazila Health Complex , Kishoreganj 3,556 533 8 108 61 43 0 0 0 43 35 8 0 0 24 15 0 0 1.21 11.44 0.00 0.00249 Bajitpur Upazila Health Complex , Kishoregan 5,017 753 158 227 63 133 0 0 0 133 133 0 0 0 49 219 0 0 2.65 8.37 0.00 0.00250 Hossainpur Upazila Health Complex , Kishoreganj 3,837 576 1,824 427 185 220 0 0 0 220 215 7 0 0 76 769 0 0 5.73 32.14 0.00 0.00251 Itna Upazila Health Complex , Kishoreganj 3,621 543 110 101 55 25 0 0 0 25 24 1 0 46 32 73 1 1 0.69 10.13 0.00 1.82252 Katiadi Upazila Health Complex , Kishoregan 6,791 1,019 772 1,019 53 483 0 0 0 483 460 25 0 0 255 483 0 0 7.11 5.20 0.00 0.00253 Kuliarchar Upazila Health Complex , Kishoregan 4,037 606 37 55 45 27 0 0 0 27 25 2 0 0 10 16 0 0 0.67 7.43 0.00 0.00254 Pakundia Upazila Health Complex , Kishoregan 5,770 865 188 75 4 72 0 0 0 72 72 0 0 0 3 67 0 0 1.25 0.46 0.00 0.00255 Tarail Upazila Health Complex , Kishoregan 3,557 534 615 957 590 369 0 0 0 369 358 11 0 0 267 554 1 0 10.37 110.59 0.00 0.17256 MCWC 62,546 9,382 4,912 1,052 279 718 0 6 220 944 930 15 0 12 29 1,913 0 1 1.51 2.97 0.35 0.00257 Private Clinics & Hospitals 62,546 9,38216,713 6,434 3,620 1,101 29 27 4,310 5,467 5,371 111 481 1,214 7 5,989 7 27 8.74 38.58 6.89 0.19258 NGO 62,546 9,382 0 0 0 0 0 0 0 0 0 0 0 0 0 0 0 0 0.00 0.00 0.00 0.00Kishoregonj District Total 62,546 9,382 32,574 16,557 8,326 5,020 31 82 6,264 11,397 11,066 383 884 1,387 949 12,896 32 30 18.22 88.75 10.02 0.38259 Madaripur District Hospital , Madaripur 27,637 4,145 1,164 995 765 161 0 5 245 411 381 40 228 35 50 734 3 0 1.49 18.45 0.89 0.39260 Shibchar Upazila Health Complex , Madaripur 7,773 1,166 13,011 1,119 416 331 0 0 348 679 666 13 1 0 42 5,247 1 0 8.74 35.68 4.48 0.24261 Kalkini Upazila Health Complex , Madaripu 6,656 998 405 164 23 142 0 0 0 142 139 3 0 0 5 181 0 2 2.13 2.30 0.00 0.00262 Rajoir Upazila Health Complex , Madaripur 5,160 774 433 128 59 69 0 0 0 69 64 5 0 4 69 58 0 0 1.34 7.62 0.00 0.00263 MCWC 27,637 4,145 10,137 1,362 162 646 0 34 494 1,174 1,138 38 178 53 35 2,055 0 0 4.25 3.91 1.79 0.00264 Private Clinics & Hospitals 27,637 4,145 8,114 2,819 703 437 0 0 2,004 2,441 2,427 29 13 0 37 4,598 0 1 8.83 16.96 7.25 0.00265 NGO 27,637 4,145 1,014 36 1 31 0 0 0 31 30 1 0 0 1 276 0 0 0.11 0.02 0.00 0.00Madaripur District Total 27,637 4,145 34,278 6,623 2,129 1,817 0 39 3,091 4,947 4,845 129 420 92 239 13,149 4 3 17.90 51.36 11.18 0.19266 Manikganj District Hospital , Manikgan 31,842 4,776 2,080 2,206 706 577 0 5 442 1,024 973 54 207 7 106 149 0 0 3.22 14.78 1.39 0.00267 Harirampur Upazila Health Complex , Manikganj 4,479 672 5,833 889 184 367 13 0 292 672 651 21 11 0 86 3,313 0 0 15.00 27.39 6.52 0.00268 Shibalaya Upazila Health Complex , Manikgan 3,656 548 237 821 229 384 0 5 140 529 519 11 0 0 65 564 0 0 14.47 41.76 3.83 0.00269 Daulatpur Upazila Health Complex , Manikganj 3,837 575 587 42 15 27 0 0 0 27 27 0 0 0 0 376 0 0 0.70 2.61 0.00 0.00270 Ghior Upazila Health Complex , Manikgan 3,374 506 407 105 37 64 0 0 0 64 63 1 9 1 25 217 0 0 1.90 7.31 0.00 0.00271 Saturia Upazila Health Complex , Manikganj 3,775 566 766 242 111 131 0 0 0 131 131 0 0 0 39 330 0 0 3.47 19.60 0.00 0.00272 Singair Upazila Health Complex , Manikgan 6,157 924 1,107 327 12 223 0 1 0 224 217 7 39 13 34 983 0 2 3.64 1.30 0.00 0.00273 MCWC 31,842 4,776 12,873 1,002 182 536 0 2 414 952 944 12 4 251 42 2,392 0 0 2.99 3.81 1.30 0.00274 Private Clinic and Hospital 31,842 4,776 3,237 941 87 120 0 0 797 917 916 2 11 0 1 775 0 1 2.88 1.82 2.50 0.00275 NGO 31,842 4,776 0 0 0 0 0 0 0 0 0 0 0 0 0 0 0 0 0.00 0.00 0.00 0.00Manikgonj District Total 31,842 4,776 27,127 6,575 1,563 2,429 13 13 2,085 4,540 4,441 108 281 272 398 9,099 0 3 14.26 32.72 6.55 0.00276 Munshiganj District Hospital , Munshigan 31,529 4,729 10,615 2,014 89 706 0 0 295 1,001 981 24 0 0 132 5,262 1 0 3.17 1.88 0.94 1.12277 Serajdikhan Upazila Health Complex , Munshigan 5,895 884 4,409 883 104 340 2 8 266 616 611 7 39 40 74 931 1 2 10.45 11.76 4.51 0.96278 Gazaria Upzila Health Complex , Munshiganj 3,367 505 1,977 1,112 28 927 0 0 0 927 917 57 2 0 134 1,039 0 0 27.53 5.54 0.00 0.00279 Louhajang Upazila Health Complex , Munshigan 4,062 609 713 425 28 397 0 0 0 397 397 0 0 0 28 403 0 0 9.77 4.60 0.00 0.00280 Sreenagar Upzila Health Complex , Munshiganj 5,594 839 1,473 170 26 146 0 0 0 146 141 5 0 0 22 107 0 0 2.61 3.10 0.00 0.00281 Tungibari Upazila Health Complex , Munshigan 4,637 696 1,219 186 12 133 0 0 0 133 133 0 0 0 25 239 0 0 2.87 1.73 0.00 0.00282 MCWC 31,529 4,729 3,232 1,120 180 778 0 0 184 962 972 0 0 0 91 1,177 0 0 3.05 3.81 0.58 0.00283 Private Clinics & Hospitals 31,529 4,729 6,061 5,220 3,410 1,227 0 0 3,582 4,809 4,835 46 0 0 48 4,546 0 0 15.25 72.10 11.36 0.00
Table-A: Statistical data of 690 facilities during the period January to December, 2010 (including public, private and NGO facilities) (Contd...)13Type Of DeliveryOutcome ofDeliverySl. No.Expected Birth(Jan-Dec 2010)EstimatedComplicaions(Jan-Jun 2010)ANC ServicesAdmittedPatientsComplicationstreatedNormalDeliveryForsafe/ Vacum/DestructiveVaginal Breech/FaceInstitute NameCaesareanTotalDeliveryLiveStillBirthBirthOther OperationsRefar InRefar OutPNC ServicesMaternal DeathNeonatal DeathProportion (%) ofall births in EmOCfacilitiesMet need (%) forEmOCCS as % of allbirthsCase Fatality Rate(CFR)284 NGO 31,529 4,729 0 0 0 0 0 0 0 0 0 0 0 0 0 0 0 0 0.00 0.00 0.00 0.00Munshigonj District Total 31,529 4,729 29,699 11,130 3,877 4,654 2 8 4,327 8,991 8,987 139 41 40 554 13,704 2 2 28.52 81.98 13.72 0.05285 Mymenshingh Medical College Hospital , Mymenshing 109,087 16,363 17,129 18,787 6,089 4,168 8 37 6,278 10,491 9,729 918 2,215 224 38 10,706 116 0 9.62 37.21 5.76 1.91286 Bhaluka Upazila Health Complex , Mymensingh 7,548 1,132 1,174 1,361 385 640 93 6 133 872 847 25 0 0 7 968 0 0 11.55 34.01 1.76 0.00287 Gofargaon Upazila Health Complex , Mymensingh 9,921 1,488 436 1,167 247 541 4 0 37 582 533 49 0 0 105 415 0 0 5.87 16.60 0.37 0.00288 Haluaghat Upazila Health Complex , Mymensingh 6,602 990 1,347 534 71 298 0 0 7 305 290 16 0 0 75 277 0 6 4.62 7.17 0.11 0.00289 Nandail Upazila Health Complex , Mymensingh 9,066 1,360 1,327 1,690 221 716 16 15 75 822 743 83 84 11 227 668 0 4 9.07 16.25 0.83 0.00290 Dhubaura Upazila Health Complex , Mymensingh 4,225 634 200 214 32 89 0 0 0 89 75 14 0 7 27 76 0 0 2.11 5.05 0.00 0.00291 Fulbaria Upazila Health Complex , Mymensingh 9,772 1,466 829 367 120 245 0 0 0 245 239 6 0 0 98 237 0 0 2.51 8.19 0.00 0.00292 Fulpur Upazila Health Complex , Mymensingh 12,958 1,944 654 654 10 413 0 0 0 413 359 54 0 0 10 413 0 0 3.19 0.51 0.00 0.00293 Gouripur Upazila Health Complex , Mymensingh 7,020 1,053 1,074 857 116 741 0 0 0 741 737 4 0 0 116 741 0 2 10.56 11.02 0.00 0.00294 Iswarganj Upazila Health Complex , Mymensingh 7,830 1,175 1,846 1,846 385 824 0 0 0 824 746 78 0 0 385 816 2 0 10.52 32.78 0.00 0.52295 Muktagacha Upazila Health Complex , Mymensingh 8,964 1,345 2,256 2,165 270 1,801 0 0 0 1,801 1,744 57 8 0 240 1,619 1 0 20.09 20.08 0.00 0.37296 Trisal Upazila Health Complex , Mymensingh 8,965 1,345 1,581 743 145 598 0 0 0 598 568 32 51 0 145 598 0 0 6.67 10.78 0.00 0.00297 MCWC 109,087 16,363 1,596 1,358 0 831 0 0 402 1,233 1,226 7 0 0 38 528 0 0 1.13 0.00 0.37 0.00298 Private Clinics & Hospitals 109,087 16,363 7,303 6,687 750 1,670 60 17 4,436 6,183 6,044 139 8 38 13 2,251 7 36 5.67 4.58 4.07 0.93299 NGO 109,087 16,363 0 0 0 0 0 0 0 0 0 0 0 0 0 0 0 0 0.00 0.00 0.00 0.00Mymensingh District Total 109,087 16,363 38,752 38,430 8,841 13,575 181 75 11,368 25,199 23,880 1,482 2,366 280 1,524 20,313 126 48 23.10 54.03 10.42 1.43300 Narayanganj (200 beded) Hospital , Narayanganj 53,093 7,964 1,843 1,885 637 726 0 10 588 1,324 1,304 22 59 1 0 1,656 0 1 2.49 8.00 1.11 0.00301 Narayanganj District Hospita 53,093 7,964 4,782 1,378 574 710 0 0 486 1,196 1,187 16 84 0 4 1,906 0 0 2.25 7.21 0.92 0.00302 Rupganj Upazila Health Complex , Narayangan 9,783 1,468 3,516 371 135 144 0 0 109 253 251 3 0 0 33 608 0 2 2.59 9.20 1.11 0.00303 Araihazar Upazila Health Complex , Narayangan 8,026 1,204 3,177 449 102 347 0 0 0 347 341 6 0 1 102 551 0 0 4.32 8.47 0.00 0.00304 Bandar Upazila Health Complex , Narayanganj 6,123 919 177 29 3 20 0 0 0 20 20 0 0 0 3 25 0 0 0.33 0.33 0.00 0.00305 Sonargaon Upazila Health Complex , Narayangan 7,475 1,121 1,274 218 20 178 0 0 0 178 195 2 0 0 20 210 0 0 2.38 1.78 0.00 0.00306 MCWC 53,093 7,964 3,235 323 92 210 0 0 92 302 298 5 0 0 0 414 0 0 0.57 1.16 0.17 0.00307 Private Clinic and Hospital District Total 53,093 7,964308 NGO 53,093 7,964Narayangonj District Total 53,093 7,96419,923 15,384 10,240 48,167 10,729 3,751 15 3 11,378 15,147 15,135 37 0 159 106 17,161 0 0 28.53 134.72 21.43 0.00432 479 212 0 0 220 432 432 0 0 0 294 2,097 0 0 0.81 6.01 0.41 0.0020,469 12,771 6,298 15 13 12,873 19,199 19,163 91 143 161 562 24,628 0 3 36.16 160.36 24.25 0.00309 Narsingdi 100 Bed Hospital 46,516 6,977 4,612 844 706 188 0 2 133 323 296 27 99 108 35 2,594 1 0 0.69 10.12 0.29 0.14310 Narsingdi District Hospital , Narsingd 46,516 6,977 4,510 1,427 605 452 0 3 203 658 628 30 106 140 49 1,097 2 0 1.41 8.67 0.44 0.33311 Monohardi Upazila Health Complex , Narsingd 5,967 895 3,686 738 422 394 8 6 104 512 490 28 257 0 59 1,218 0 0 8.58 47.15 1.74 0.00312 Belabo Upazila Health Complex , Narsingd 4,030 605 707 539 51 487 0 0 0 487 480 10 0 0 51 551 0 0 12.08 8.44 0.00 0.00313 Palash Upazila Health Complex , Narsingd 4,681 702 2,773 181 5 153 0 0 1 154 154 0 0 0 7 310 0 0 3.29 0.71 0.02 0.00314 Raipura Upazila Health Complex , Narsingd 11,125 1,669 7,250 1,620 618 970 8 0 401 1,379 1,328 51 0 6 115 4,011 0 3 12.40 37.03 3.60 0.00315 Shibpur Upazila Health Complex , Narsingd 6,477 972 853 184 23 146 0 0 0 146 144 2 29 0 15 404 0 0 2.25 2.37 0.00 0.00316 MCWC 46,516 6,977 7,981 1,257 486 766 0 0 486 1,252 1,253 1 0 0 1 1,708 0 0 2.69 6.97 1.04 0.00317 Private Clinics & Hospitals 46,516 6,97727,673 6,424 2,680 923 1 0 3,952 4,876 4,853 24 2 99 162 17,610 0 0 10.48 38.41 8.50 0.00318 NGO 46,516 6,977 0 0 0 0 0 0 0 0 0 0 0 0 0 0 0 0 0.00 0.00 0.00 0.00Narsingdi District Total 46,516 6,977 60,045 13,214 5,596 4,479 17 11 5,280 9,787 9,626 173 493 353 494 29,503 3 3 21.04 80.20 11.35 0.05319 Netrokona District Hospital , Netrokona 48,213 7,232 1,475 3,206 1,504 1,341 1 39 367 1,748 1,647 117 145 106 326 1,765 2 1 3.63 20.80 0.76 0.13320 Kalmakanda Upazila Health Complex , Netrokona 5,729 859 1,109 529 354 241 0 4 9 254 212 44 6 2 65 256 2 1 4.43 41.19 0.16 0.56321 Kendua Upazila Health Complex , Netrokona 6,681 1,002 151 397 77 319 0 0 0 319 285 34 0 0 68 317 0 0 4.77 7.68 0.00 0.00322 Atpara Upazila Health Complex , Netrokona 3,239 486 76 91 53 41 0 0 0 41 40 2 0 0 32 44 0 0 1.27 10.91 0.00 0.00323 Barhatta Upazila Health Complex , Netrokona 3,856 578 206 201 43 134 0 0 0 134 128 6 0 4 40 134 0 0 3.48 7.43 0.00 0.00324 Durgapur Upazila Health Complex , Netrokona 4,849 727 824 260 62 200 0 1 6 207 193 14 8 0 67 446 1 1 4.27 8.52 0.12 1.61325 Khaliajhuir Upazila Health Complex , Netrokona 1,938 291 328 94 14 83 0 0 0 83 78 12 2 0 13 200 0 5 4.28 4.82 0.00 0.00326 Madan Upazila Health Complex , Netrokona 3,453 518 544 297 25 250 0 0 0 250 233 17 0 0 44 202 0 0 7.24 4.83 0.00 0.00327 Mohanganj Upazila Health Complex , Netrokona 3,549 532 1,995 515 281 234 0 0 0 234 203 31 0 0 121 1,003 0 0 6.59 52.79 0.00 0.00328 Purbadhala Upazila Health Complex , Netrokona 6,860 1,029 1,296 513 275 158 0 0 0 158 147 12 0 0 139 163 1 1 2.30 26.73 0.00 0.36329 MCWC 48,213 7,232 6,446 657 249 426 0 3 199 628 618 13 0 47 38 1,111 0 0 1.30 3.44 0.41 0.00330 Private clinic & Hospital 48,213 7,232 1,227 757 571 93 1 3 615 712 706 6 34 9 56 658 0 0 1.48 7.90 1.28 0.00331 NGO 48,213 7,232 0 0 0 0 0 0 0 0 0 0 0 0 0 0 0 0 0.00 0.00 0.00 0.00Netrokona District Total 48,213 7,23215,677 7,517 3,508 3,520 2 50 1,196 4,768 4,490 308 195 168 1,009 6,299 6 9 9.89 48.51 2.48 0.17332 Rajbari District Hospital , Rajbar 23,291 3,494 887 1,211 740 316 0 0 198 514 500 21 134 0 42 272 4 1 2.21 21.18 0.85 0.54333 Baliakandi Upazila Health Complex , Rajbar 4,562 684 376 362 81 197 7 0 8 212 196 26 36 0 20 346 0 0 4.65 11.84 0.18 0.00334 1,952 293 334 50 21 29 0 0 0 29 29 0 0 0 21 121 0 0 1.49 7.17 0.00 0.00335 Goalandaghat Upazila Health Complex , Rajbar 2,881 432 2,523 276 116 160 0 0 2 162 156 6 0 0 87 618 12 1 5.62 26.85 0.07 10.34336 Pangsha Upazila Health Complex , Rajbar 8,625 1,294 1,010 232 49 122 0 1 52 175 168 7 0 6 45 310 0 2 2.03 3.79 0.60 0.00337 MCWC 23,291 3,494 3,399 673 45 390 2 27 232 651 643 11 0 0 0 934 0 1 2.80 1.29 1.00 0.00338 Private Clinics & Hospitals 23,291 3,494 582 582 6 223 0 4 336 563 579 0 0 0 14 583 0 0 2.42 0.17 1.44 0.00339 NGO 23,291 3,494 0 0 0 0 0 0 0 0 0 0 0 0 0 0 0 0 0.00 0.00 0.00 0.00Rajbari District Total 23,291 3,494 9,111 3,386 1,058 1,437 9 32 828 2,306 2,271 71 170 6 229 3,184 16 5 9.90 30.28 3.55 1.51
Table-A: Statistical data of 690 facilities during the period January to December, 2010 (including public, private and NGO facilities) (Contd...)14Type Of DeliveryOutcome ofDeliverySl. No.Expected Birth(Jan-Dec 2010)EstimatedComplicaions(Jan-Jun 2010)ANC ServicesAdmittedPatientsComplicationstreatedNormalDeliveryForsafe/ Vacum/DestructiveVaginal Breech/FaceInstitute NameCaesareanTotalDeliveryLiveStillBirthBirthOther OperationsRefar InRefar OutPNC ServicesMaternal DeathNeonatal DeathProportion (%) ofall births in EmOCfacilitiesMet need (%) forEmOCCS as % of allbirthsCase Fatality Rate(CFR)340 Shariatpur District Hospital , Shariatpur 26,432 3,965 3,934 2,183 939 637 0 0 728 1,365 1,308 64 126 187 34 2,071 12 10 5.16 23.68 2.75 1.28341 Bhedarganj Upazila Health Complex , Shariatpur 5,816 872 5,080 382 36 113 15 0 0 128 125 3 0 2 5 3,576 0 0 2.20 4.13 0.00 0.00342 Goshairhat Upazila Health Complex , Shariatpu 3,006 451 6,768 997 170 151 11 2 32 196 177 27 2 0 45 2,822 1 0 6.52 37.70 1.06 0.59343 Zanzira Upazila Health Complex , Shariatpur 4,567 685 3,995 408 44 212 0 0 0 212 210 2 33 17 32 931 0 0 4.64 6.42 0.00 0.00344 Damuddya Upazila Health Complex , Shariatpur 2,630 395 5,892 189 11 116 0 0 0 116 115 1 0 4 94 1,718 0 0 4.41 2.79 0.00 0.00345 Naria Upazila Health Complex , Shariatpur 5,517 828 4,455 783 48 505 0 0 0 505 505 0 0 21 61 1,984 0 0 9.15 5.80 0.00 0.00346 MCWC 26,432 3,965 1,765 251 0 48 0 0 152 200 200 0 0 0 0 520 0 0 0.76 0.00 0.58 0.00347 Private clinic & Hospital 26,432 3,965 6,073 1,304 569 222 2 97 886 1,207 1,207 0 0 0 0 2,768 0 0 4.57 14.35 3.35 0.00348 NGO 26,432 3,965 43 43 0 17 0 0 26 43 43 0 0 0 0 43 0 0 0.16 0.00 0.10 0.00Shariatpur District Total 26,432 3,965 38,005 6,540 1,817 2,021 28 99 1,824 3,972 3,890 97 161 231 271 16,433 13 10 15.03 45.83 6.90 0.72349 Sherpur District Hospital , Sherpur 31,012 4,652 1,846 1,815 630 407 0 0 258 665 606 75 0 0 61 826 7 0 2.14 13.54 0.83 1.11350 Jhenaigati Upazila Health Complex , Sherpur 3,716 557 616 193 23 168 0 0 1 169 165 7 0 1 19 499 0 0 4.55 4.13 0.03 0.00351 Nakhla Upazila Health Complex , Sherpur 4,380 657 239 184 36 148 0 0 0 148 144 4 0 0 36 152 0 0 3.38 5.48 0.00 0.00352 Nalitabari Upazila Health Complex , Sherpur 6,159 924 3,263 172 47 134 0 0 0 134 132 2 0 0 30 189 0 0 2.18 5.09 0.00 0.00353 Sribardi Upazila Health Complex , Sherpur 5,769 865 848 379 56 309 0 0 0 309 309 0 0 0 48 268 0 0 5.36 6.47 0.00 0.00354 MCWC 31,012 4,652 2,065 376 7 299 0 0 73 372 366 6 0 0 0 648 0 0 1.20 0.15 0.24 0.00355 Private Clinics & Hospitals 31,012 4,652 737 1,117 17 493 0 0 619 1,112 1,112 0 0 0 5 722 0 0 3.59 0.37 2.00 0.00356 NGO 31,012 4,652 0 0 0 0 0 0 0 0 0 0 0 0 0 0 0 0 0.00 0.00 0.00 0.00Sherpur District Total 31,012 4,652 9,614 4,236 816 1,958 0 0 951 2,909 2,834 94 0 1 199 3,304 7 0 9.38 17.54 3.07 0.86357 Tangail (100 Beded) Hospital , Tangai 79,774 11,966 4,107 4,502 1,187 1,526 0 1 1,673 3,200 3,091 147 743 115 113 3,137 9 0 4.01 9.92 2.10 0.76358 Gopalpur Upazila Health Complex , Tangai 6,581 987 1,522 525 93 213 1 0 41 255 262 3 2 115 99 413 0 1 3.87 9.42 0.62 0.00359 Modhupur Upazila Health Complex , Tangai 10,202 1,530 1,818 1,445 565 319 15 12 344 690 661 34 269 79 119 1,385 1 4 6.76 36.92 3.37 0.18360 Nagarpur Upazila Health Complex , Tangai 6,258 939 644 624 178 369 0 1 23 393 376 17 0 0 61 410 0 4 6.28 18.96 0.37 0.00361 Sakhipur Upazila Health Complex , Tangai 5,908 886 2,880 1,520 921 598 0 0 382 980 979 10 34 0 141 1,073 0 3 16.59 103.92 6.47 0.00362 Basail Upazila Health Complex , Tangai 3,813 572 1,413 65 17 40 0 0 0 40 40 0 0 0 18 251 0 0 1.05 2.97 0.00 0.00363 Bhuapur Upazila Health Complex , Tangai 4,585 688 1,930 714 199 394 0 1 0 395 385 10 0 0 143 490 0 1 8.62 28.94 0.00 0.00364 Delduar Upazila Health Complex , Tangai 4,609 691 1,290 60 4 48 0 0 0 48 47 1 0 0 12 259 0 0 1.04 0.58 0.00 0.00365 Dhanbari Upazila Health Complex , Tangail 4,858 729 0 0 0 0 0 0 0 0 0 0 0 0 0 0 0 0 0.00 0.00 0.00 0.00366 Ghatail Upazila Health Complex , Tangai 9,080 1,362 1,627 664 135 293 0 0 0 293 281 12 0 0 126 883 0 0 3.23 9.91 0.00 0.00367 Kalihati Upazila Health Complex , Tangai 9,205 1,381 497 250 130 150 0 0 0 150 150 0 0 0 92 192 0 0 1.63 9.42 0.00 0.00368 Mirzapur Upazila Health Complex , Tangai 8,822 1,323 7,963 73 4 71 0 0 0 71 71 0 0 0 10 5,295 0 0 0.80 0.30 0.00 0.00369 MCWC 79,774 11,966 3,532 660 259 392 1 0 259 652 652 0 1 0 4 856 0 0 0.82 2.16 0.32 0.00370 Private clinic & Hospital 79,774 11,966 12,698 8,362 2,974 1,476 56 29 4,688 6,249 6,174 108 11 251 72 7,429 5 11 7.83 24.85 5.88 0.17371 NGO 79,774 11,966 22 75 43 24 2 0 4 30 29 1 0 0 2 37 0 0 0.04 0.36 0.01 0.00Tangail District Total 79,774 11,966 41,943 19,539 6,709 5,913 75 44 7,414 13,446 13,198 343 1,060 560 1,012 22,110 15 24 16.86 56.07 9.29 0.22Dhaka Division 953,563 143,034 561,926 253,992 98,873 86,301 949 1,009 95,975 184,234 180,823 4,887 10,193 5,523 10,262 255,917 537 399 19.32 69.13 10.06 0.54372 Bagerhat (100 Beded) Hospital , Bagerhat 37,099 5,565 1,346 950 498 268 17 4 108 397 380 17 9 4 61 474 0 3 1.07 8.95 0.29 0.00373 Fakirhat Upazila Health Complex , Bagerha 3,199 480 866 918 226 432 1 0 107 540 525 15 79 0 81 540 0 0 16.88 47.10 3.34 0.00374 Chitalmari Upazila Health Complex , Bagerha 3,407 511 129 129 30 82 0 0 0 82 82 0 0 0 38 70 0 0 2.41 5.87 0.00 0.00375 Kachua Upazila Health Complex , Bagerhat 2,350 352 476 90 0 61 0 0 0 61 57 4 0 0 14 57 0 0 2.60 0.00 0.00 0.00376 Mollahat Upazila Health Complex , Bagerha 2,898 435 22 64 1 35 0 0 2 37 35 2 0 0 7 24 0 0 1.28 0.23 0.07 0.00377 Mongla Upazila Health Complex , Bagerha 3,646 547 159 108 32 72 0 0 8 80 79 1 4 0 22 101 0 0 2.19 5.85 0.22 0.00378 Morrelganj Upazila Health Complex , Bagerha 8,320 1,248 17 32 4 18 0 0 0 18 17 1 0 0 11 15 0 0 0.22 0.32 0.00 0.00379 Rampal Upazila Health Complex , Bagerhat 4,310 646 314 259 53 157 0 1 0 158 151 7 5 0 36 193 0 4 3.67 8.20 0.00 0.00380 Sarankhola Upazila Health Complex , Bagerha 2,742 411 269 171 24 92 0 0 56 148 129 19 12 0 23 208 1 1 5.40 5.84 2.04 4.17381 MCWC 37,099 5,565 240 325 22 265 0 1 0 266 260 6 0 0 35 170 0 0 0.72 0.40 0.00 0.00382 Private clinic & Hospital 37,099 5,565 320 259 189 72 0 0 186 258 258 1 1 0 0 277 0 0 0.70 3.40 0.50 0.00383 NGO 37,099 5,565 158 95 47 44 0 0 42 86 86 1 11 0 5 85 0 0 0.23 0.84 0.11 0.00Bagerhat District Total 37,099 5,565 4,316 3,400 1,126 1,598 18 6 509 2,131 2,059 74 121 4 333 2,214 1 8 5.74 20.23 1.37 0.09384 Chuadanga District Hospital , Chuadanga 24,585 3,688 1,597 3,354 664 1,575 0 26 94 1,695 1,800 59 216 0 2 2,114 4 1 6.89 18.01 0.38 0.60385 Alamdanga Upazila Health Complex , Chuadanga 7,542 1,131 796 660 104 422 0 0 78 500 492 10 1 0 15 530 0 0 6.63 9.19 1.03 0.00386 Jibannagar Upazila Health Complex , Chuadanga 3,997 600 232 994 174 613 0 3 30 646 636 10 121 0 24 646 0 0 16.16 29.02 0.75 0.00387 Damurhuda Upazila Health Complex , Chuadanga 6,244 937 381 246 31 215 0 0 1 216 216 20 1 0 31 193 0 0 3.46 3.31 0.02 0.00388 MCWC 24,585 3,688 6,066 867 1 754 0 2 105 861 859 3 0 0 1 451 0 0 3.50 0.03 0.43 0.00389 Private clinic & Hospital 24,585 3,688 507 395 251 95 0 0 284 379 379 0 0 0 0 465 0 0 1.54 6.81 1.16 0.00390 NGO 24,585 3,688 3,688 63 2 0 0 1 61 62 62 0 1 0 0 272 0 0 0.25 0.05 0.25 0.00Chuadanga District Total 24,585 3,68813,267 6,579 1,227 3,674 0 32 653 4,359 4,444 102 340 0 73 4,671 4 1 17.73 33.27 2.66 0.33391 Jessore (100 Beded) Hospital , Jessore 60,404 9,061 9,957 3,564 1,627 1,202 7 17 1,205 2,431 2,340 124 37 60 22 1,143 13 1 4.02 17.96 1.99 0.80392 Abhoynagar Upazila Health Complex , Jessore 5,681 852 3,796 1,342 306 351 0 0 404 755 745 20 85 0 48 816 0 0 13.29 35.91 7.11 0.00393 Chowgacha Upazila Health Complex , Jessore 5,157 774 20,156 5,629 2,084 2,708 47 36 962 3,753 3,703 74 318 0 100 3,079 0 12 72.77 269.39 18.65 0.00394 Jhikargacha Upazila Health Complex , Jessore 6,772 1,016 5,667 799 27 301 1 1 176 479 467 13 0 0 22 126 0 7 7.07 2.66 2.60 0.00395 Bagerpara Upazila Health Complex , Jessore 4,770 715 79 78 0 41 0 0 0 41 41 0 0 0 3 45 0 0 0.86 0.00 0.00 0.00
Table-A: Statistical data of 690 facilities during the period January to December, 2010 (including public, private and NGO facilities) (Contd...)15Type Of DeliveryOutcome ofDeliverySl. No.Expected Birth(Jan-Dec 2010)EstimatedComplicaions(Jan-Jun 2010)ANC ServicesAdmittedPatientsComplicationstreatedNormalDeliveryForsafe/ Vacum/DestructiveVaginal Breech/FaceInstitute NameCaesareanTotalDeliveryLiveStillBirthBirthOther OperationsRefar InRefar OutPNC ServicesMaternal DeathNeonatal DeathProportion (%) ofall births in EmOCfacilitiesMet need (%) forEmOCCS as % of allbirthsCase Fatality Rate(CFR)396 Keshabpur Upazila Health Complex , Jessore 5,521 828 669 320 44 166 4 0 75 245 241 6 0 2 29 290 0 4 4.44 5.31 1.36 0.00397 Monirampur Upazila Health Complex , Jessore 9,355 1,403 3,606 379 37 142 0 0 103 245 239 6 0 0 36 212 1 0 2.62 2.64 1.10 2.70398 Sarsa Upazila Health Complex , Jessore 7,573 1,136 2,014 281 88 148 0 0 1 149 140 21 2 10 87 90 1 4 1.97 7.75 0.01 1.14399 MCWC 60,404 9,061 5,593 850 97 445 0 3 199 647 645 3 0 63 113 1,091 0 0 1.07 1.07 0.33 0.00400 Private clinic & Hospital 60,404401 NGO 60,404Jessore District Total 60,4049,061 34,745 8,572 9,061 14,847 9,061 101,129 1,090 1,633 26 32 4,511 6,202 6,063 141 205 100 12 6,067 4 33 10.27 12.03 7.47 0.371,555 20 521 0 2 1,019 1,542 1,526 19 0 0 0 0 0 4 2.55 0.22 1.69 0.0023,369 5,420 7,658 85 91 8,655 16,489 16,150 427 647 235 472 12,959 19 65 27.30 59.82 14.33 0.35402 Jhenaidah (100 Beded) Hospital , Jhenaidah 38,362 5,754 1,099 3,514 1,317 1,778 0 32 546 2,356 2,306 68 103 136 73 2,356 4 4 6.14 22.89 1.42 0.30403 Harinakunda Upazila Health Complex , Jhenaidah 4,161 624 2,262 1,155 429 378 0 0 245 623 617 9 10 0 5 1,780 0 0 14.97 68.74 5.89 0.00404 Sailkupa Upazila Health Complex , Jhenaidah 8,099 1,215 64 794 244 382 0 2 58 442 431 11 126 0 41 465 0 2 5.46 20.08 0.72 0.00405 Kaliganj Upazila Health Complex , Jhenaidah 6,154 923 434 693 258 433 0 0 5 438 427 13 0 0 255 438 0 0 7.12 27.95 0.08 0.00406 Kotchandpur Upazila Health Complex , Jhenaidah 2,548 382 1,333 650 248 307 0 0 0 307 297 10 0 0 248 618 0 0 12.05 64.90 0.00 0.00407 Moheshpur Upazila Health Complex , Jhenaidah 7,119 1,068 93 289 94 195 0 0 0 195 195 0 0 0 58 175 0 0 2.74 8.80 0.00 0.00408 MCWC 38,362 5,754 4,543 568 0 444 0 0 49 493 491 2 0 0 1 1,075 0 0 1.29 0.00 0.13 0.00409 Private Clinics & Hospitals 38,362 5,754 391 3,510 2,331 817 21 0 2,629 3,467 3,459 8 2 934 2 1,100 0 2 9.04 40.51 6.85 0.00410 NGO 38,362 5,754 0 119 0 41 0 0 66 107 107 0 0 0 5 0 0 0 0.28 0.00 0.17 0.00Jhenidah District Total 38,3625,754 10,219 11,292 4,921 4,775 21 34 3,598 8,428 8,330 121 241 1,070 688 8,007 4 8 21.97 85.52 9.38 0.08411 Khulna Medical College Hospital , Khulna 57,671 8,651 5,861 4,444 701 1,731 51 15 994 2,791 2,601 219 3 51 8 2,202 50 20 4.84 8.10 1.72 7.13412 Khulna (200 beded) Hospital , Khulna 57,671 8,651 4,402 1,086 878 208 0 0 313 521 509 12 166 0 60 215 0 0 0.90 10.15 0.54 0.00413 Batiaghata Upazila Health Complex , Khulna 3,412 512 265 265 85 187 0 0 75 262 262 0 0 0 3 262 0 0 7.68 16.61 2.20 0.00414 Dacope Upazila Health Complex , Khulna 3,849 577 296 617 301 202 1 5 222 430 423 16 2 0 6 367 1 0 11.17 52.14 5.77 0.33415 Dumuria Upazila Health Complex , Khulna 6,746 1,012 508 455 85 268 0 0 16 284 276 9 0 9 59 206 0 0 4.21 8.40 0.24 0.00416 Koyra Upazila Health Complex , Khulna 4,709 706 185 356 216 109 0 0 89 198 189 14 0 1 18 201 1 0 4.20 30.58 1.89 0.46417 Paikgacha Upazila Health Complex , Khulna 6,035 905 2,473 1,459 1,049 367 48 0 513 928 917 11 85 2 95 584 2 2 15.38 115.88 8.50 0.19418 Fultala Upazila Health Complex , Khulna 1,761 264 575 670 144 265 8 1 87 361 358 5 13 0 12 429 1 0 20.51 54.53 4.94 0.69419 Dighalia Upazila Health Complex , Khulna 2,800 420 32 0 0 0 0 0 0 0 0 0 0 0 0 1 0 0 0.00 0.00 0.00 0.00420 Rupsha Upazila Health Complex , Khulna 3,960 594 120 120 70 50 0 0 0 50 49 1 0 0 64 50 0 0 1.26 11.79 0.00 0.00421 Terakhada Upazila Health Complex , Khulna 2,678 402 179 105 1 80 0 0 0 80 80 1 0 0 7 85 0 0 2.99 0.25 0.00 0.00422 MCWC 57,671 8,651 7,282 1,196 104 573 0 1 441 1,015 1,018 4 19 55 43 1,564 0 0 1.76 1.20 0.76 0.00423 Private Clinics & Hospitals 57,671 8,651 950 1,646 743 549 22 8 922 1,501 1,512 13 18 62 38 594 0 2 2.60 8.59 1.60 0.00424 NGO 57,671 8,651 1,554 350 74 169 1 0 160 330 324 9 22 28 75 330 0 1 0.57 0.86 0.28 0.00Khulna District Total 57,671 8,65124,682 12,769 4,451 4,758 131 30 3,832 8,751 8,518 314 328 208 488 7,090 55 25 15.17 51.45 6.64 1.24425 Kustia (100 Beded) Hospital , Kustia 42,493 6,374 1,077 4,440 1,442 1,584 0 15 770 2,369 2,272 97 0 51 122 2,393 20 0 5.58 22.62 1.81 1.39426 Bheramara Upazila Health Complex , Kushtia 4,292 644 721 501 133 243 0 1 21 265 266 2 18 0 61 201 1 0 6.17 20.66 0.49 0.75427 Daulatpur Upazila Health Complex , Kushtia 10,859 1,629 3,967 4,212 2,216 1,967 0 5 1,253 3,225 3,182 49 0 0 86 2,981 0 0 29.70 136.05 11.54 0.00428 Khoksha Upazila Health Complex , Kushtia 2,839 426 420 426 119 297 0 0 0 297 279 18 0 0 118 296 0 2 10.46 27.95 0.00 0.00429 Kumarkhali Upazila Health Complex , Kushtia 7,271 1,091 410 410 5 304 0 0 27 331 328 3 0 0 70 310 0 2 4.55 0.46 0.37 0.00430 Mirpur Upazila Health Complex , Kushtia 6,916 1,037 360 493 140 353 0 0 0 353 353 0 0 99 140 353 0 0 5.10 13.50 0.00 0.00431 MCWC 42,493 6,374 377 504 131 402 1 0 25 428 429 4 0 0 11 357 0 0 1.01 2.06 0.06 0.00432 Private Clinics & Hospitals 42,493 6,374 1,204 3,102 188 1,125 0 0 1,854 2,979 2,985 0 0 0 101 1,124 0 0 7.01 2.95 4.36 0.00433 NGO 42,493 6,374 766 2,191 42 468 0 6 1,377 1,851 1,924 27 0 0 36 595 0 0 4.36 0.66 3.24 0.00Kushtia District Total 42,493 6,374 9,302 16,279 4,416 6,743 1 27 5,327 12,098 12,018 200 18 150 745 8,610 21 4 28.47 69.28 12.54 0.48434 Magura District Hospital , Magura 20,101 3,015 1,589 2,511 606 905 0 6 311 1,222 1,162 68 124 0 103 1,397 2 0 6.08 20.10 1.55 0.33435 Mohammadpur Upazila Health Complex , Magura 4,617 693 1,026 792 311 456 0 0 119 575 567 11 27 0 58 501 0 5 12.45 44.91 2.58 0.00436 Salika Upazila Health Complex , Magura 3,592 539 406 132 67 47 0 0 9 56 56 0 40 1 25 98 0 0 1.56 12.43 0.25 0.00437 Sreepur Upazila Health Complex , Magura 3,817 573 168 74 14 50 0 1 0 51 50 1 0 0 14 50 0 0 1.34 2.44 0.00 0.00438 MCWC 20,101 3,015 6,564 1,053 36 745 0 4 208 957 935 35 0 0 54 1,223 0 0 4.76 1.19 1.03 0.00439 Private Clinics & Hospitals 20,101 3,015 380 549 47 111 0 2 374 487 483 5 0 0 0 152 0 1 2.42 1.56 1.86 0.00440 NGO 20,101 3,015 0 0 0 0 0 0 0 0 0 0 0 0 0 0 0 0 0.00 0.00 0.00 0.00Magura District Total 20,101 3,01510,133 5,111 1,081 2,314 0 13 1,021 3,348 3,253 120 191 1 254 3,421 2 6 16.66 35.85 5.08 0.19441 Meherpur District Hospital , Meherpur 14,372 2,156 2,102 2,568 284 1,593 0 0 154 1,747 1,709 46 0 0 0 1,724 1 0 12.16 13.17 1.07 0.35442 Gangni Upazila Health Complex , Meherpur 6,524 979 2,970 2,970 76 1,875 0 0 390 2,265 2,230 35 16 2 57 2,388 0 0 34.72 7.77 5.98 0.00443 Mujib Nagar UHC 2,200 330 0 0 0 0 0 0 0 0 0 0 0 0 0 0 0 0 0.00 0.00 0.00 0.00444 MCWC 14,372 2,156 2,864 303 4 296 0 0 4 300 296 6 27 0 48 363 0 0 2.09 0.19 0.03 0.00445 Private Clinics & Hospitals 14,372 2,156 8,081 3,769 121 939 0 0 2,624 3,563 3,589 14 5 225 18 3,764 0 3 24.79 5.61 18.26 0.00446 NGO 14,372 2,156 10,085 1,318 400 895 4 19 0 918 916 3 0 0 78 938 1 13 6.39 18.55 0.00 0.25Meherpur District Total 14,372 2,15626,102 10,928 885 5,598 4 19 3,172 8,793 8,740 104 48 227 201 9,177 2 16 61.18 41.05 22.07 0.23447 Narail District Hospital, Narai 16,996 2,549 1,410 1,321 267 274 0 7 308 589 564 35 140 0 24 557 2 8 3.47 10.47 1.81 0.75448 Kalia Upazila Health Complex , Narai 5,029 754 3,063 957 549 299 45 11 255 610 598 17 81 109 90 1,240 0 0 12.13 72.78 5.07 0.00449 Lohagara Upazila Health Complex , Narai 5,343 801 553 250 163 59 0 0 0 59 59 0 0 0 54 63 0 0 1.10 20.34 0.00 0.00450 MCWC 16,996 2,549 4,132 586 118 497 0 0 45 542 542 2 16 2 5 557 0 0 3.19 4.63 0.26 0.00451 Private Clinics & Hospitals 16,996 2,549 1,292 1,295 1,197 46 0 0 1,230 1,276 1,269 11 1 0 15 1,248 0 1 7.51 46.95 7.24 0.00
Table-A: Statistical data of 690 facilities during the period January to December, 2010 (including public, private and NGO facilities) (Contd...)16Type Of DeliveryOutcome ofDeliverySl. No.Expected Birth(Jan-Dec 2010)EstimatedComplicaions(Jan-Jun 2010)ANC ServicesAdmittedPatientsComplicationstreatedNormalDeliveryForsafe/ Vacum/DestructiveVaginal Breech/FaceInstitute NameCaesareanTotalDeliveryLiveStillBirthBirthOther OperationsRefar InRefar OutPNC ServicesMaternal DeathNeonatal DeathProportion (%) ofall births in EmOCfacilitiesMet need (%) forEmOCCS as % of allbirthsCase Fatality Rate(CFR)452 NGO 16,996 2,549 0 0 0 0 0 0 0 0 0 0 0 0 0 0 0 0 0.00 0.00 0.00 0.00Narail District Total 16,996 2,549 10,450 4,409 2,294 1,175 45 18 1,838 3,076 3,032 65 238 111 188 3,665 2 9 18.10 89.98 10.81 0.09453 Satkhira District Hospital , Satkhira 45,129 6,769 1,254 1,787 649 863 0 5 228 1,096 1,039 58 147 65 16 987 7 2 2.43 9.59 0.51 1.08454 Debhatta Upazila Health Complex , Satkhira 2,951 443 1,128 397 100 175 0 3 97 275 275 1 0 0 11 275 0 0 9.32 22.59 3.29 0.00455 Kalaroa Upazila Health Complex , Satkhira 5,436 815 2,082 938 305 394 22 2 267 685 671 20 0 0 32 584 1 1 12.60 37.40 4.91 0.33456 Shyamnagar Upazila Health Complex , Satkhira 7,718 1,158 1,535 1,142 684 262 0 10 462 734 710 24 0 1 35 588 1 0 9.51 59.09 5.99 0.15457 Assasuni Upazila Health Complex , Satkhira 5,967 895 105 93 15 39 0 0 23 62 60 2 0 0 16 59 0 0 1.04 1.68 0.39 0.00458 Kaliganj Upazila Health Complex , Satkhira 6,330 949 9 16 0 14 0 0 0 14 14 0 0 1 0 1 0 0 0.22 0.00 0.00 0.00459 Tala Upazila Health Complex , Satkhira 7,126 1,069 147 247 117 84 0 0 0 84 84 0 0 0 27 84 0 0 1.18 10.95 0.00 0.00460 MCWC 45,129 6,769 3,990 1,070 54 521 6 51 367 945 940 6 0 3 19 706 0 1 2.09 0.80 0.81 0.00461 Private clinic & Hospital 45,129 6,769 3,127 2,402 867 710 3 1 1,306 2,020 2,018 2 0 0 4 907 0 0 4.48 12.81 2.89 0.00462 NGO 45,129 6,769 7,204 217 0 110 0 0 107 217 216 1 0 0 0 1,382 0 1 0.48 0.00 0.24 0.00Satkhira District Total 45,129 6,769 20,581 8,309 2,791 3,172 31 72 2,857 6,132 6,027 114 147 70 160 5,573 9 5 13.59 41.23 6.33 0.32Khulna Division 357,213 53,582 230,181 102,445 28,612 41,465 336 342 31,462 73,605 72,571 1,641 2,319 2,076 3,602 65,387 119 147 20.61 53.40 8.81 0.42463 Shahid Ziaur Rahman Medical College Hospital 73,752 11,063 2,912 2,836 419 712 0 2 932 1,646 1,531 115 0 0 0 759 39 15 2.23 3.79 1.26 9.31464 Mohammad Ali (250 Beded) Hospital , Bogra 73,752 11,063 2,079 2,645 1,401 925 0 11 1,069 2,005 1,951 69 0 0 0 1,814 1 0 2.72 12.66 1.45 0.07465 Sariakandi Upazila Health Complex , Bogra 5,866 880 26 305 71 210 0 0 0 210 208 2 0 0 62 3 0 0 3.58 8.07 0.00 0.00466 Sonatala Upazila Health Complex , Bogra 4,105 616 583 665 155 373 3 10 66 452 445 10 12 0 50 339 0 0 11.01 25.17 1.61 0.00467 Adamdighi Upazila Health Complex , Bogra 4,639 696 92 185 62 116 0 0 0 116 116 0 0 0 32 0 0 0 2.50 8.91 0.00 0.00468 Dhunat Upazila Health Complex , Bogra 6,653 998 110 148 18 129 0 0 0 129 129 0 0 0 23 54 0 0 1.94 1.80 0.00 0.00469 Dhupchachia Upazila Health Complex , Bogra 3,873 581 318 870 115 389 0 1 0 390 372 18 20 0 172 395 0 0 10.07 19.80 0.00 0.00470 Gabtali Upazila Health Complex , Bogra 7,099 1,065 124 143 11 89 0 0 0 89 88 1 0 0 32 57 0 0 1.25 1.03 0.00 0.00471 Kahaloo Upazila Health Complex , Bogra 4,777 717 1,337 247 17 164 0 0 0 164 163 2 0 0 37 170 0 0 3.43 2.37 0.00 0.00472 Nandigram Upazila Health Complex , Bogra 4,122 618 29 35 2 32 0 0 0 32 32 0 0 0 0 0 0 0 0.78 0.32 0.00 0.00473 Shajahanpur Upazila Health Complex , Bogra 5,780 867 0 0 0 0 0 0 0 0 0 0 0 0 0 0 0 0 0.00 0.00 0.00 0.00474 Sherpur Upazila Health Complex , Bogra 7,017 1,052 1,120 425 74 333 0 0 0 333 329 4 0 0 17 55 0 0 4.75 7.03 0.00 0.00475 Shibganj Upazila Health Complex , Bogra 8,609 1,291 524 429 72 346 0 4 0 350 347 8 0 0 67 292 0 0 4.07 5.58 0.00 0.00476 MCWC 73,752 11,063 6,570 1,334 61 855 0 0 383 1,238 1,231 10 0 71 11 1,508 0 0 1.68 0.55 0.52 0.00477 Private Clinic & Hospital 73,752 11,063 4,067 3,724 131 1,356 0 6 1,860 3,222 3,180 42 0 0 11 1,718 0 3 4.37 1.18 2.52 0.00478 NGO 73,752 11,063 2,531 2,573 226 876 1 5 1,356 2,238 2,207 33 0 0 3 1,175 0 10 3.03 2.04 1.84 0.00Bogra District Total 73,752 11,063 22,422 16,564 2,835 6,905 4 39 5,666 12,614 12,329 314 32 71 517 8,339 40 28 17.10 25.63 7.68 1.41479 Chapi Nawabganj District Hospital , Nawabganj 34,773 5,216 1,480 3,316 783 1,318 0 15 156 1,489 1,413 88 275 34 128 1,486 7 0 4.28 15.01 0.45 0.89480 Nachol Upazila Health Complex , C.Nawabganj 3,239 486 0 527 135 351 0 0 0 351 333 19 0 0 57 0 1 0 10.84 27.78 0.00 0.74481 Shibganj Upazila Health Complex , C. Nawabganj 12,415 1,862 1,271 3,814 884 1,945 276 35 494 2,750 2,685 82 0 0 212 2,602 0 0 22.15 47.47 3.98 0.00482 Bholahat Upazila Health Complex , C. Nawabganj 2,238 336 0 290 30 223 0 0 0 223 212 11 0 0 31 0 0 0 9.96 8.93 0.00 0.00483 Gomastapur UpazilaHealthComplex,C.Nawabganj 5,863 879 0 377 42 307 0 0 0 307 301 6 0 0 70 0 0 2 5.24 4.78 0.00 0.00484 MCWC 34,773 5,216 1,011 380 146 173 2 0 200 375 376 0 5 6 0 204 0 0 1.08 2.80 0.58 0.00485 Private Clinic and Hospital District Total 34,773 5,216 64 2,239 1,367 436 2 17 1,784 2,239 2,207 32 0 0 1 75 0 1 6.44 26.21 5.13 0.00486 NGO 34,773 5,216 0 255 151 41 0 3 211 255 253 2 0 0 0 0 0 0 0.73 2.89 0.61 0.00C. Nawabgonj District Total 34,773 5,216 3,826 11,198 3,538 4,794 280 70 2,845 7,989 7,780 240 280 40 499 4,367 8 3 22.97 67.83 8.18 0.23487 Joypurhat District Hospital , Joypurha 20,950 3,143 6,373 4,200 2,061 1,782 8 27 698 2,515 2,471 67 355 62 72 2,717 14 1 12.00 65.58 3.33 0.68488 Akkelpur Upazila Health Complex , Joypurha 3,147 472 990 524 270 236 0 1 5 242 242 3 0 0 71 243 0 0 7.69 57.19 0.16 0.00489 Kalai Upazila Health Complex , Joypurha 3,134 470 0 29 4 16 0 0 0 16 16 0 0 0 9 0 0 0 0.51 0.85 0.00 0.00490 Khetlal Upazila Health Complex , Joypurha 2,838 426 2,240 1,481 227 849 0 5 205 1,059 1,053 6 0 0 198 978 1 0 37.31 53.32 7.22 0.44491 Panchbibi Upazila Health Complex , Joypurha 5,507 826 37 105 13 89 0 0 0 89 89 0 0 0 1 46 0 0 1.62 1.57 0.00 0.00492 MCWC 20,950 3,143 0 1,082 206 622 0 0 206 828 825 7 6 0 96 789 0 0 3.95 6.56 0.98 0.00493 Private Clinic & Hospital 20,950 3,143 0 175 119 42 0 0 123 165 165 0 0 0 0 0 0 0 0.79 3.79 0.59 0.00494 NGO 20,950 3,143 0 126 93 32 0 0 93 125 125 0 0 0 0 0 0 0 0.60 2.96 0.44 0.00Joypurhat District Total 20,950 3,143 9,640 7,722 2,993 3,668 8 33 1,330 5,039 4,986 83 361 62 447 4,773 15 1 24.05 95.24 6.35 0.50495 Naogaon District Hospital , Naogaon 58,355 8,753 4,033 3,245 675 925 0 6 673 1,604 1,537 67 481 45 30 1,337 9 0 2.75 7.71 1.15 1.33496 Niamatpur Upazila Health Complex ,Naogaon 5,501 825 1,461 220 31 141 0 0 0 141 136 5 6 0 13 346 0 0 2.56 3.76 0.00 0.00497 Patnitala Upazila Health Complex , Naogaon 5,138 771 1,659 1,052 485 452 0 10 261 723 709 14 113 0 99 666 0 0 14.07 62.93 5.08 0.00498 Atrai Upazila Health Complex , Naogaon 4,413 662 1,701 1,992 106 1,344 0 10 351 1,705 1,659 46 0 0 138 618 0 0 38.63 16.01 7.95 0.00499 Badalgachi Upazila Health Complex , Naogaon 4,544 682 407 162 42 120 0 0 0 120 117 3 0 0 38 155 0 0 2.64 6.16 0.00 0.00500 Dhamairhat Upazila Health Complex , Naogaon 4,148 622 56 204 95 100 0 0 9 109 104 5 0 0 95 485 0 1 2.63 15.27 0.22 0.00501 Manda Upazila Health Complex , Naogaon 8,700 1,305 205 419 95 236 0 0 0 236 228 8 0 0 52 236 0 0 2.71 7.28 0.00 0.00502 Mohadevpur Upazila Health Complex , Naogaon 6,388 958 1,921 433 116 317 0 0 0 317 309 8 0 0 31 343 0 0 4.96 12.11 0.00 0.00503 Porsha Upazila Health Complex , Naogaon 3,012 452 551 67 7 61 0 0 0 61 61 0 0 0 7 123 0 0 2.03 1.55 0.00 0.00504 Raninagar Upazila Health Complex , Naogaon 4,522 678 159 132 31 95 0 0 0 95 95 0 0 0 36 92 0 0 2.10 4.57 0.00 0.00505 Sapahar Upazila Health Complex , Naogaon 3,454 518 0 418 239 179 0 0 0 179 173 6 0 0 220 213 0 0 5.18 46.13 0.00 0.00506 MCWC 58,355 8,753 1,242 350 0 350 0 0 0 350 350 0 0 0 1 308 0 0 0.60 0.00 0.00 0.00507 Private Clinic & Hospital 58,355 8,753 17,914 3,264 826 2,355 0 13 693 3,061 3,057 4 47 6 377 5,181 1 0 5.25 9.44 1.19 0.12
Table-A: Statistical data of 690 facilities during the period January to December, 2010 (including public, private and NGO facilities) (Contd...)17Type Of DeliveryOutcome ofDeliverySl. No.Expected Birth(Jan-Dec 2010)EstimatedComplicaions(Jan-Jun 2010)ANC ServicesAdmittedPatientsComplicationstreatedNormalDeliveryForsafe/ Vacum/DestructiveVaginal Breech/FaceInstitute NameCaesareanTotalDeliveryLiveStillBirthBirthOther OperationsRefar InRefar OutPNC ServicesMaternal DeathNeonatal DeathProportion (%) ofall births in EmOCfacilitiesMet need (%) forEmOCCS as % of allbirthsCase Fatality Rate(CFR)508 NGO 58,355 8,753 0 0 0 0 0 0 0 0 0 0 0 0 0 0 0 0 0.00 0.00 0.00 0.00Naogaon District Total 58,355 8,753 31,309 11,958 2,748 6,675 0 39 1,987 8,701 8,535 166 647 51 1,137 10,103 10 1 14.91 31.39 3.41 0.36509 Natore (100 Beded) Hospital , Natore 37,103 5,566 273 2,464 721 974 0 0 237 1,211 1,159 52 208 225 179 1,172 3 1 3.26 12.95 0.64 0.42510 Gurudashpur Upazila Health Complex , Natore 5,863 879 631 635 159 282 1 1 11 295 285 12 7 1 78 302 0 1 5.03 18.08 0.19 0.00511 Lalpur Upazila Health Complex , Natore 5,936 890 400 730 256 316 0 1 31 348 340 9 31 2 95 384 0 0 5.86 28.75 0.52 0.00512 Bagatipara Upazila Health Complex , Natore 2,857 429 97 174 24 143 0 0 0 143 142 1 3 0 25 85 0 0 5.01 5.60 0.00 0.00513 Baraigram Upazila Health Complex , Natore 6,008 901 12 208 65 133 0 0 0 133 128 6 0 0 57 141 0 2 2.21 7.21 0.00 0.00514 Singra Upazila Health Complex , Natore 7,820 1,173 170 621 315 278 0 0 0 278 271 7 6 0 68 227 0 0 3.55 26.85 0.00 0.00515 MCWC 37,103 5,566 5,095 1,448 450 1,136 12 10 136 1,294 1,282 12 5 15 7 1,351 0 0 3.49 8.09 0.37 0.00516 Natore District Private Clinic 37,103 5,566 1,083 1,225 894 387 2 3 798 1,190 1,175 15 123 70 108 825 2 12 3.21 16.06 2.15 0.22517 NGO 37,103 5,566 0 0 0 0 0 0 0 0 0 0 0 0 0 0 0 0 0.00 0.00 0.00 0.00Natore District Total 37,103 5,566 7,761 7,505 2,884 3,649 15 15 1,213 4,892 4,782 114 383 313 617 4,487 5 16 13.18 51.82 3.27 0.17518 Pabna (100 Beded) Hospital , Pabna 52,951 7,943 7,653 10,264 4,541 4,410 1 73 1,420 5,904 5,907 200 184 489 97 833 27 66 11.15 57.17 2.68 0.59519 Bhangura Upazila Health Complex , Pabna 2,426 364 646 365 227 121 0 0 8 129 130 1 13 0 89 216 0 0 5.32 62.37 0.33 0.00520 Iswardi Upazila Health Complex , Pabna 7,148 1,072 4,647 2,446 391 1,266 0 4 213 1,483 1,449 35 84 0 63 1,365 0 0 20.75 36.47 2.98 0.00521 Atghoria Upazila Health Complex , Pabna 3,316 497 741 53 3 48 0 0 0 48 47 1 0 0 5 460 0 0 1.45 0.60 0.00 0.00522 Bera Upazila Health Complex , Pabna 5,654 848 268 844 51 385 0 0 0 385 382 3 0 0 47 344 0 0 6.81 6.01 0.00 0.00523 Chatmohar Upazila Health Complex , Pabna 5,804 871 2,516 412 65 292 0 0 6 298 275 23 2 0 82 131 1 6 5.13 7.47 0.10 1.54524 Faridpur Upazila Health Complex , Pabna 2,998 450 750 233 49 150 0 0 0 150 149 1 0 0 49 150 0 4 5.00 10.90 0.00 0.00525 Santhia Upazila Health Complex , Pabna 7,904 1,186 5,809 848 170 326 1 1 88 416 413 7 72 0 171 600 0 6 5.26 14.34 1.11 0.00526 Sujanagar Upazila Health Complex , Pabna 6,100 915 2,725 139 34 105 0 0 0 105 105 1 0 0 33 309 0 1 1.72 3.72 0.00 0.00527 MCWC 52,951 7,943 6,819 2,960 64 1,351 52 18 394 1,815 1,805 12 0 1 6 2,840 2 0 3.43 0.81 0.74 3.13528 Private Clinic & Hospital 52,951 7,943 624 2,898 373 783 0 0 2,111 2,894 2,901 0 0 0 1 282 0 0 5.47 4.70 3.99 0.00529 NGO 52,951 7,943 0 0 0 0 0 0 0 0 0 0 0 0 0 0 0 0 0.00 0.00 0.00 0.00Pabna District Total 52,951 7,943 33,198 21,462 5,968 9,237 54 96 4,240 13,627 13,563 284 355 490 643 7,530 30 83 25.73 75.14 8.01 0.50530 Rajshahi Medical College Hospital , Rajshah 55,627 8,344 10,470 14,431 2,738 4,426 9 41 3,338 7,814 7,608 258 1,405 401 45 7,802 91 5 14.05 32.81 6.00 3.32531 Bagmara Upazila Health Complex , Rajshah 7,394 1,109 1,153 1,105 366 541 0 4 68 613 606 9 63 0 241 421 1 2 8.29 33.00 0.92 0.27532 Charghat Upazila Health Complex , Rajshah 4,552 683 810 2,238 174 1,592 4 10 6 1,612 1,597 20 46 0 173 1,480 0 0 35.41 25.48 0.13 0.00533 Bogha Upazila Health Complex , Rajshah 4,102 615 1,235 494 53 293 0 0 0 293 292 1 0 0 90 294 0 0 7.14 8.61 0.00 0.00534 Durgapur Upazila Health Complex , Rajshah 4,196 629 59 217 3 214 0 0 0 214 212 2 0 0 6 69 0 2 5.10 0.48 0.00 0.00535 Godagari 31 Beded Hospital 6,888 1,033 455 566 213 349 0 4 0 353 341 13 31 0 106 388 0 0 5.12 20.61 0.00 0.00536 Godagari Upazila Health Complex , Rajshah 6,888 1,033 360 360 53 246 0 0 0 246 245 1 0 0 53 246 1 0 3.57 5.13 0.00 1.89537 Mohanpur Upazila Health Complex , Rajshah 3,742 561 88 88 28 59 0 0 0 59 57 2 0 0 28 59 1 0 1.58 4.99 0.00 3.57538 Paba Upazila Health Complex , Rajshah 6,414 962 84 37 5 31 0 0 0 31 31 0 0 0 6 31 0 0 0.48 0.52 0.00 0.00539 Puthia Upazila Health Complex , Rajshah 4,610 691 1,058 1,058 345 537 0 0 0 537 529 8 0 0 438 557 0 2 11.65 49.89 0.00 0.00540 Tanore Upazila Health Complex , Rajshah 4,238 636 159 358 90 278 0 0 0 278 276 2 0 0 76 155 0 0 6.56 14.16 0.00 0.00541 MCWC 55,627 8,344 0 0 0 0 0 0 0 0 0 0 0 0 0 0 0 0 0.00 0.00 0.00 0.00542 Privet Clinc & Hospital 55,627 8,344 1,515 1,517 171 574 0 0 835 1,409 1,390 20 36 0 25 1,408 0 2 2.53 2.05 1.50 0.00543 NGO 55,627 8,344 3,904 3,949 595 2,303 0 0 1,080 3,383 3,450 352 3 0 97 2,553 0 2 6.08 7.13 1.94 0.00Rajshahi District Total 55,627 8,344 21,350 26,418 4,834 11,443 13 59 5,327 16,842 16,634 688 1,584 401 1,384 15,463 94 15 30.28 57.93 9.58 1.94544 Serajganj (100 Beded) Hospital , Serajganj 65,379 9,807 170 1,887 965 620 0 0 315 935 840 113 60 83 88 24 8 0 1.43 9.84 0.48 0.83545 Chowhali Upazila Health Complex , Serajgan 3,809 571 602 123 1 42 2 0 0 44 42 2 0 0 13 29 0 3 1.16 0.18 0.00 0.00546 Kazipur Upazila Health Complex , Serajganj 6,529 979 305 180 170 99 0 1 0 100 96 4 10 0 22 105 0 1 1.53 17.36 0.00 0.00547 Shahzadpur Upazila Health Complex , Serajganj 11,490 1,724 12,967 4,415 959 3,168 0 0 806 3,974 3,907 67 0 0 153 3,700 0 0 34.59 55.64 7.01 0.00548 Tarash Upazila Health Complex , Serajganj 4,102 615 923 265 145 125 0 0 0 125 123 2 0 0 38 43 0 0 3.05 23.57 0.00 0.00549 Belkuchi Upazila Health Complex , Serajgan 7,293 1,094 95 460 289 277 0 5 31 313 290 23 0 1 93 337 1 2 4.29 26.42 0.43 0.35550 Kamarkanda Upazila Health Complex , Serajganj 3,122 468 398 437 7 429 0 1 0 430 410 20 0 0 8 429 0 11 13.77 1.49 0.00 0.00551 Raiganj Upazila Health Complex , Serajganj 6,530 979 709 303 12 297 0 0 4 301 301 0 0 3 9 301 0 0 4.61 1.23 0.06 0.00552 Ullapara 20 Beded Hospital 10,700 1,605 1 229 33 128 0 0 44 172 201 15 27 0 18 15 0 0 1.61 2.06 0.41 0.00553 Ullapara Upazila Health Complex , Serajganj 10,700 1,605 280 208 103 106 0 0 6 112 112 4 1 0 44 168 0 0 1.05 6.42 0.06 0.00554 MCWC 65,379 9,807 1,249 1,681 37 1,429 0 0 166 1,595 1,586 12 0 0 11 791 1 0 2.44 0.38 0.25 2.70555 Private Clinic & Hospital 65,379 9,807 7,295 3,144 50 2,943 0 3 120 3,066 3,068 7 0 0 46 3,410 0 0 4.69 0.51 0.18 0.00556 NGO 65,379 9,807 11,460 4,650 57 5,476 0 0 68 5,544 5,543 1 0 0 92 6,467 0 1 8.48 0.58 0.10 0.00Serajgonj District Total 65,379 9,807 36,454 17,982 2,828 15,139 2 10 1,560 16,711 16,519 270 98 87 635 15,819 10 18 25.56 28.84 2.39 0.35Rajshahi Division 398,891 59,834 165,960 120,809 28,628 61,510 376 361 24,168 86,415 85,128 2,159 3,740 1,515 5,879 70,881 212 165 21.66 47.85 6.06 0.74557 Dinajpur Medical College Hospital 64,593 9,689 1,909 267 14 153 0 2 78 233 228 5 0 25 2 432 0 1 0.36 0.14 0.12 0.00558 Dinajpur (100 Beded) Hospital , Dinajpur 64,593 9,689 410 1,994 588 466 7 0 776 1,249 1,195 54 2 23 26 477 9 0 1.93 6.07 1.20 1.53559 Birampur Upazila Health Complex , Dinajpur 3,691 554 97 1,135 214 568 0 7 69 644 634 17 131 0 81 770 1 1 17.45 38.65 1.87 0.47560 Birganj Upazila Health Complex , Dinajpu 6,512 977 563 742 147 281 0 5 66 352 341 14 107 0 97 359 0 0 5.41 15.05 1.01 0.00561 Ghoraghat Upazila Health Complex , Dinajpur 2,511 377 384 176 85 86 1 3 0 90 86 5 0 0 30 134 0 0 3.58 22.57 0.00 0.00562 Birol Upazila Health Complex , Dinajpur 5,659 849 0 119 30 89 0 0 0 89 89 0 0 0 30 0 0 0 1.57 3.53 0.00 0.00563 Bochaganj Upazila Health Complex , Dinajpu 3,555 533 111 1,975 704 1,272 0 0 0 1,272 1,267 8 0 17 349 1,199 0 1 35.78 132.01 0.00 0.00
Table-A: Statistical data of 690 facilities during the period January to December, 2010 (including public, private and NGO facilities) (Contd...)18Type Of DeliveryOutcome ofDeliverySl. No.Expected Birth(Jan-Dec 2010)EstimatedComplicaions(Jan-Jun 2010)ANC ServicesAdmittedPatientsComplicationstreatedNormalDeliveryForsafe/ Vacum/DestructiveVaginal Breech/FaceInstitute NameCaesareanTotalDeliveryLiveStillBirthBirthOther OperationsRefar InRefar OutPNC ServicesMaternal DeathNeonatal DeathProportion (%) ofall births in EmOCfacilitiesMet need (%) forEmOCCS as % of allbirthsCase Fatality Rate(CFR)564 Chirirbandar Upazila Health Complex , Dinajpu 6,490 974 39 50 8 37 0 0 0 37 37 0 0 4 8 14 0 0 0.57 0.82 0.00 0.00565 Fulbari Upazila Health Complex , Dinajpur 3,680 552 1,069 564 105 436 5 0 18 459 460 2 0 7 114 551 0 0 12.47 19.02 0.49 0.00566 Hakimpur Upazila Health Complex , Dinajpur 2,021 303 4 620 125 485 0 0 0 485 457 28 0 0 105 483 0 0 24.00 41.23 0.00 0.00567 Kaharol Upazila Health Complex , Dinajpur 3,398 510 225 117 48 69 0 0 0 69 67 2 4 0 40 63 0 0 2.03 9.42 0.00 0.00568 Khansama Upazila Health Complex , Dinajpur 3,691 554 3,943 2,863 555 1,888 108 2 309 2,307 2,306 17 0 1 156 2,368 0 0 62.50 100.24 8.37 0.00569 Nawabganj Upazila Health Complex , Dinajpur 5,014 752 185 448 74 279 0 1 0 280 269 12 114 0 70 295 1 1 5.58 9.84 0.00 1.35570 Parbatipur Upazila Health Complex , Dinajpur 7,969 1,195 256 301 100 185 0 0 0 185 182 3 6 0 35 190 0 3 2.32 8.37 0.00 0.00571 MCWC 64,593 9,689 5,819 630 0 472 0 1 110 583 579 4 0 77 8 1,241 0 0 0.90 0.00 0.17 0.00572 Privet Clinc & Hospital 64,593 9,689 11,403 3,772 620 1,081 54 28 2,172 3,335 3,290 48 29 296 60 3,324 1 16 5.16 6.40 3.36 0.16573 NGO 64,593 9,689 17,170 5,175 388 3,025 213 83 1,750 5,071 4,927 163 46 15 3 658 17 69 7.85 4.00 2.71 4.38Dinajpur District Total 64,593 9,689 43,587 20,948 3,805 10,872 388 132 5,348 16,740 16,414 382 439 465 1,214 12,558 29 92 25.92 39.27 8.28 0.76574 Gaibandha District Hospital , Gaibandha 52,089 7,813 320 941 359 162 2 2 63 229 299 31 79 18 149 327 4 3 0.44 4.59 0.12 1.11575 Gobindaganj Upzila Health Complex , Gaibandha 11,267 1,690 19,436 5,218 1,491 2,861 0 0 1,236 4,097 3,980 117 0 33 28 3,886 7 3 36.36 88.22 10.97 0.47576 Palashbari Upazila Health Complex , Gaibandha 5,633 845 259 496 100 227 0 6 0 233 228 6 4 99 65 177 0 0 4.14 11.83 0.00 0.00577 Sundarganj Upazila Health Complex , Gaibandha 9,739 1,461 249 357 116 166 0 1 0 167 155 12 0 99 65 47 4 4 1.71 7.94 0.00 3.45578 Fulchari Upazila Health Complex , Gaibandha 3,365 505 310 114 3 109 0 0 0 109 110 0 0 0 6 87 0 0 3.24 0.59 0.00 0.00579 Sadullapur Upazila Health Complex , Gaibandha 6,452 968 458 453 112 302 0 0 0 302 288 14 18 99 78 164 32 0 4.68 11.57 0.00 28.57580 Shaghatta Upazila Health Complex , Gaibandha 6,076 911 153 220 44 139 0 0 0 139 129 10 0 4 64 32 0 4 2.29 4.83 0.00 0.00581 MCWC 52,089 7,813 7,303 3,519 539 2,715 0 38 337 3,090 3,135 75 0 55 52 4,146 0 5 5.93 6.90 0.65 0.00582 Private Clinic & Hospital 52,089 7,813 1,447 1,826 73 247 4 0 1,521 1,772 1,678 104 4 25 45 925 9 25 3.40 0.93 2.92 12.33583 NGO 52,089 7,813 2,879 660 36 568 0 0 0 568 559 11 0 12 17 816 0 0 1.09 0.46 0.00 0.00Gaibandha District Total 52,089 7,813 32,814 13,804 2,873 7,496 6 47 3,157 10,706 10,561 380 105 444 569 10,607 56 44 20.55 36.77 6.06 1.95584 Kurigram District Hospital , Kurigram 43,118 6,468 95 1,048 577 259 8 18 146 431 663 70 37 38 13 402 5 1 1.00 8.92 0.34 0.87585 Nageswari Upazila Health Complex , Kurigram 7,887 1,183 0 157 55 91 0 0 36 127 116 14 0 0 22 110 0 0 1.61 4.65 0.46 0.00586 Rowmari Upazila Health Complex , Kurigram 3,974 596 159 495 272 220 0 0 63 283 248 45 45 0 4 285 1 1 7.12 45.64 1.59 0.37587 Bhurungamari Upazila Health Complex , Kurigram 4,817 723 3 27 0 25 0 0 1 26 26 0 0 0 0 21 0 0 0.54 0.00 0.02 0.00588 Chilmari Upazila Health Complex , Kurigram 2,714 407 19 189 13 97 0 0 0 97 93 4 0 0 17 82 3 1 3.57 3.19 0.00 23.08589 Fulbari Upazila Health Complex , Kurigram 3,362 504 1,855 87 5 56 2 2 3 63 56 7 6 0 7 245 0 0 1.87 0.99 0.09 0.00590 Rajarhat Upazila Health Complex , Kurigram 3,955 593 0 17 0 14 0 0 0 14 14 0 0 0 3 14 0 0 0.35 0.00 0.00 0.00591 Rajibpur Upazila Health Complex , Kurigram 1,398 210 0 8 4 5 0 0 0 5 5 0 0 0 1 2 0 0 0.36 1.91 0.00 0.00592 Ulipur Upazila Health Complex , Kurigram 8,620 1,293 10,455 1,274 358 900 36 12 150 1,098 1,072 31 118 83 43 3,210 4 4 12.74 27.69 1.74 1.12593 MCWC 43,118 6,468 2,632 810 47 502 32 51 144 729 762 5 59 55 5 1,563 0 0 1.69 0.73 0.33 0.00594 Private Clinic & Hospital 43,118 6,468 32 1,846 280 475 0 0 1,298 1,773 1,766 31 47 0 19 1,642 3 14 4.11 4.33 3.01 1.07595 NGO 43,118 6,468 1,419 2,739 107 2,176 0 89 19 2,284 2,250 40 21 0 29 2,052 1 0 5.30 1.65 0.04 0.93Kurigram District Total 43,118 6,468 16,669 8,697 1,718 4,820 78 172 1,860 6,930 7,071 247 333 176 163 9,628 17 21 16.07 26.56 4.31 0.99596 Lalmonirhat District Hospital , Lalmonirha 27,011 4,052 0 873 326 162 0 1 160 323 297 27 39 0 55 144 1 7 1.20 8.05 0.59 0.31597 Kaliganj Upazila Health Complex , Lalmonirha 5,291 794 0 110 21 29 0 0 0 29 28 1 0 2 12 0 0 0 0.55 2.65 0.00 0.00598 Patgram Upazila Health Complex , Lalmonirha 4,724 709 0 180 80 92 1 1 8 102 93 9 0 0 16 9 0 0 2.16 11.29 0.17 0.00599 Aditmari Upazila Health Complex , Lalmonirha 4,969 745 0 0 0 0 0 0 0 0 0 0 0 0 0 0 0 0 0.00 0.00 0.00 0.00600 Hatibandha Upazila Health Complex , Lalmonirha 5,041 756 7 269 49 141 0 0 1 142 130 12 0 0 40 142 0 0 2.82 6.48 0.02 0.00601 MCWC 27,011 4,052 6,108 690 10 419 67 112 69 667 663 4 0 2 20 2,166 0 0 2.47 0.25 0.26 0.00602 Private Clinic & Hospital 27,011 4,052 453 2,690 684 140 8 7 1,188 1,343 1,316 27 7 0 6 207 0 2 4.97 16.88 4.40 0.00603 NGO 27,011 4,052 5,106 662 184 533 0 15 0 548 530 19 0 87 73 428 0 0 2.03 4.54 0.00 0.00Lalmonirhat District Total 27,011 4,052 11,674 5,474 1,354 1,516 76 136 1,426 3,154 3,057 99 46 91 222 3,096 1 9 11.68 33.42 5.28 0.07604 Nilphamari District Hospital , Nilphamar 38,208 5,731 937 3,737 1,534 1,350 0 7 152 1,509 1,453 57 148 0 294 1,641 1 0 3.95 26.77 0.40 0.07605 Jaldhaka Upazila Health Complex , Nilphamar 6,723 1,008 721 1,632 807 807 0 0 6 813 764 119 0 0 286 790 0 0 12.09 80.02 0.09 0.00606 Dimla Upazila Health Complex , Nilphamar 5,334 800 555 885 286 520 0 0 0 520 509 11 0 0 336 27 0 0 9.75 35.74 0.00 0.00607 Domar Upazila Health Complex , Nilphamar 5,297 795 3,952 1,082 234 851 0 0 0 851 795 56 0 0 226 793 1 0 16.07 29.45 0.00 0.43608 Kishoreganj Upazila Health Complex , Nilphamar 6,258 939 0 951 334 433 0 1 0 434 405 29 1 0 334 434 0 0 6.93 35.58 0.00 0.00609 Saidpur Upazila Health Complex , Nilphamar 5,598 840 457 142 0 114 0 0 0 114 114 0 0 0 27 167 0 0 2.04 0.00 0.00 0.00610 Syedpur 50 Bed Hospital 38,208 5,731 726 1,409 132 876 0 3 0 879 858 21 0 0 150 911 0 3 2.30 2.30 0.00 0.00611 MCWC 38,208 5,731 4,133 708 140 510 24 23 87 644 639 6 158 29 47 1,047 0 0 1.69 2.44 0.23 0.00612 Private Clinic & Hospital 38,208 5,731 282 1,256 0 177 0 0 1,067 1,244 1,235 10 0 0 10 105 0 2 3.26 0.00 2.79 0.00613 NGO 38,208 5,731 10,478 713 15 325 0 0 277 602 593 9 0 0 129 2,009 0 1 1.58 0.26 0.72 0.00Nilphamari District Total 38,208 5,73122,241 12,515 3,482 5,963 24 34 1,589 7,610 7,365 318 307 29 1,839 7,924 2 6 19.92 60.76 4.16 0.06614 Panchagarh District Hospital , Panchagarh 20,496 3,074 517 704 205 204 0 2 196 402 371 31 58 125 49 405 4 0 1.96 6.67 0.96 1.95615 Tetulia Upazila Health Complex , Panchagarh 2,596 389 574 260 50 122 12 6 0 140 136 5 17 3 36 329 1 0 5.39 12.84 0.00 2.00616 Atwari Upazila Health Complex , Panchagarh 2,773 416 2,061 516 0 314 0 0 0 314 310 5 0 0 63 1,451 0 0 11.32 0.00 0.00 0.00617 Boda Upazila Health Complex , Panchagarh 4,960 744 0 3 1 2 1 0 0 3 3 0 0 0 0 1 0 0 0.06 0.13 0.00 0.00618 Debiganj Upazila Health Complex , Panchagarh 4,531 680 1,758 1,442 147 1,256 8 3 22 1,289 1,266 23 6 4 133 991 0 2 28.45 21.63 0.49 0.00619 MCWC 20,496 3,074 3,353 814 15 702 0 2 5 709 707 4 0 12 50 855 0 1 3.46 0.49 0.02 0.00620 Privet Clinc & Hospital 20,496 3,074 0 837 719 139 0 5 692 836 822 15 0 0 0 0 1 5 4.08 23.39 3.38 0.14
Table-A: Statistical data of 690 facilities during the period January to December, 2010 (including public, private and NGO facilities) (Contd...)19Type Of DeliveryOutcome ofDeliverySl. No.Expected Birth(Jan-Dec 2010)EstimatedComplicaions(Jan-Jun 2010)ANC ServicesAdmittedPatientsComplicationstreatedNormalDeliveryForsafe/ Vacum/DestructiveVaginal Breech/FaceInstitute NameCaesareanTotalDeliveryLiveStillBirthBirthOther OperationsRefar InRefar OutPNC ServicesMaternal DeathNeonatal DeathProportion (%) ofall births in EmOCfacilitiesMet need (%) forEmOCCS as % of allbirthsCase Fatality Rate(CFR)621 NGO 20,496 3,074 322 1 0 1 0 0 0 1 1 0 0 0 0 272 0 0 0.00 0.00 0.00 0.00Panchagarh District Total 20,496 3,074 8,585 4,577 1,137 2,740 21 18 915 3,694 3,616 83 81 144 331 4,304 6 8 18.02 36.98 4.46 0.53622 Rangpur Medical College Hospital , Rangpur 61,808 9,271 1,871 8,790 740 3,631 46 22 2,529 6,228 5,774 523 19 0 0 2,510 129 67 10.08 7.98 4.09 17.43623 Kownia Upazila Health Complex , Rangpur 5,232 785 2,032 582 252 290 68 2 17 377 362 16 58 0 80 1,165 0 0 7.21 32.11 0.32 0.00624 Mithapukur Upazila Health Complex , Rangpur 10,840 1,626 1,507 2,494 240 1,640 0 18 0 1,658 1,654 9 502 18 247 1,033 0 0 15.30 14.76 0.00 0.00625 Baderganj Upazila Health Complex , Rangpur 6,303 945 62 263 49 191 0 0 0 191 223 7 10 0 49 0 0 0 3.03 5.18 0.00 0.00626 Gangachara Upazila Health Complex , Rangpur 6,348 952 86 95 45 47 0 0 0 47 79 4 0 0 46 42 0 0 0.74 4.73 0.00 0.00627 Pirgacha Upazila Health Complex , Rangpur 7,211 1,082 114 303 84 176 0 0 0 176 171 5 0 0 113 138 0 4 2.44 7.77 0.00 0.00628 Pirganj Upazila Health Complex , Rangpur 8,338 1,251 504 1,196 273 656 0 0 0 656 639 17 0 0 273 654 0 0 7.87 21.83 0.00 0.00629 Taraganj Upazila Health Complex , Rangpur 2,900 435 14 97 36 61 5 0 0 66 65 1 0 0 32 8 0 0 2.28 8.28 0.00 0.00630 MCWC 61,808 9,271 113 983 198 590 0 0 326 916 916 0 14 0 13 301 0 0 1.48 2.14 0.53 0.00631 Private Clinic & Hospital 61,808 9,271 4,873 2,755 123 386 27 27 2,135 2,575 2,600 25 6 63 47 3,860 0 0 4.17 1.33 3.45 0.00632 NGO 61,808 9,271 12,195 1,228 46 626 0 3 390 1,019 1,004 15 0 0 23 2,659 0 0 1.65 0.50 0.63 0.00Rangpur District Total 61,8089,271 23,371 18,786 2,086 8,294 146 72 5,397 13,909 13,487 622 609 81 923 12,370 129 71 22.50 22.50 8.73 6.18633 Thakurgaon District Hospital , Thakurgaon 29,709 4,456 1,720 1,683 543 750 3 2 370 1,125 1,015 117 0 0 4 1,039 14 1 3.79 12.19 1.25 2.58634 Baliadangi Upazila Health Complex , Thakurgaon 4,053 608 497 1,124 298 502 5 8 152 667 646 29 66 118 78 777 0 0 16.46 49.02 3.75 0.00635 Haripur Upazila Health Complex , Thakurgaon 3,168 475 1,161 469 229 203 0 1 30 234 212 24 0 0 81 511 0 0 7.39 48.19 0.95 0.00636 Pirganj Upazila Health Complex , Thakurgaon 5,267 790 817 1,723 155 1,019 0 10 43 1,072 1,048 30 0 0 102 1,039 1 5 20.35 19.62 0.82 0.65637 Ranisankhail Upazila Health Complex , Thakurgaon 4,836 725 2,150 619 101 349 0 2 6 357 320 40 0 0 78 466 0 0 7.38 13.92 0.12 0.00638 MCWC 29,709 4,456 12,547 1,069 110 748 0 4 309 1,061 1,048 16 0 52 58 2,163 0 0 3.57 2.47 1.04 0.00639 Privet Clinc & Hospital 29,709 4,456 212 3,151 337 269 6 5 2,858 3,138 3,141 6 1 6 0 100 0 0 10.56 7.56 9.62 0.00640 NGO 29,709 4,456 0 0 0 0 0 0 0 0 0 0 0 0 0 0 0 0 0.00 0.00 0.00 0.00Thakurgaon District Total 29,709 4,456 19,104 9,838 1,773 3,840 14 32 3,768 7,654 7,430 262 67 176 401 6,095 15 6 25.76 39.79 12.68 0.85Rangpur Division 337,031 50,555 178,045 94,639 18,228 45,541 753 643 23,460 70,397 69,001 2,393 1,987 1,606 5,662 66,582 255 257 20.89 36.06 6.96 1.40641 Hobiganj (100 Beded) Hospital , Hobiganj 42,807 6,421 499 5,074 1,059 1,886 3 34 503 2,426 2,152 301 0 63 240 2,066 26 4 5.67 16.49 1.18 2.46642 Azmiriganj Upazila Health Complex , Hobigan 2,427 364 312 441 121 222 33 6 0 261 230 31 47 0 58 254 0 1 10.75 33.23 0.00 0.00643 Chunarughat Upazila Health Complex , Hobiganj 6,531 980 6 71 20 39 0 0 0 39 38 1 0 0 10 56 0 0 0.60 2.04 0.00 0.00644 Bahubal Upazila Health Complex , Hobiganj 4,087 613 74 91 19 69 0 0 0 69 68 1 0 79 17 59 0 0 1.69 3.10 0.00 0.00645 Baniachong Upazila Health Complex , Hobigan 6,571 986 23 98 67 44 24 0 0 68 66 2 0 0 30 40 0 0 1.03 6.80 0.00 0.00646 Lakhai Upazila Health Complex , Hobigan 2,851 428 1,998 76 21 56 2 0 0 58 53 5 0 0 19 901 0 0 2.03 4.91 0.00 0.00647 Madhabpur Upazila Health Complex , Hobiganj 6,654 998 482 275 70 156 0 0 0 156 152 4 0 0 49 156 0 0 2.34 7.01 0.00 0.00648 Nabiganj Upazila Health Complex , Hobiganj 6,972 1,046 56 563 0 472 0 2 0 474 463 11 0 0 88 0 0 0 6.80 0.00 0.00 0.00649 MCWC 42,807 6,421 2,302 1,081 509 701 0 3 228 932 894 41 4 52 189 1,277 0 0 2.18 7.93 0.53 0.00650 Private Clinic & Hospital 42,807 6,421 230 809 103 6 0 59 731 796 788 11 0 0 0 0 1 0 1.86 1.60 1.71 0.97651 NGO 42,807 6,421 116 661 51 30 3 0 628 661 660 1 0 0 0 110 0 1 1.54 0.79 1.47 0.00Habigonj District Total 42,807 6,421 6,098 9,240 2,040 3,681 65 104 2,090 5,940 5,564 409 51 194 700 4,919 27 6 13.88 31.77 4.88 1.32652 M.bazar District Hospital , M.bazar 39,350 5,903 2,572 3,099 961 931 14 38 389 1,372 1,255 141 593 188 219 1,607 9 35 3.49 16.28 0.99 0.94653 Barlekha Upazila Health Complex , M.bazar 5,668 850 753 1,344 290 724 26 17 57 824 788 46 148 0 105 769 0 0 14.54 34.11 1.01 0.00654 Kamalganj Upazila Health Complex , M.bazar 5,604 841 1,154 451 200 165 72 3 0 240 238 9 73 0 181 547 1 0 4.28 23.79 0.00 0.50655 Kaulaura Upazila Health Complex , M.bazar 9,666 1,450 2,666 253 173 127 3 5 18 153 146 10 0 3 42 1,110 0 0 1.58 11.93 0.19 0.00656 Rajnagar Upazila Health Complex , M.bazar 4,488 673 2,845 296 72 211 0 0 0 211 208 3 87 71 82 211 0 0 4.70 10.69 0.00 0.00657 Sreemangal Upazila Health Complex , M.bazar 7,044 1,057 1,315 1,208 172 842 17 16 0 875 832 50 20 0 146 918 1 0 12.42 16.28 0.00 0.58658 MCWC 39,350 5,903 1,979 376 103 161 2 0 147 310 304 6 25 8 12 706 0 1 0.79 1.75 0.37 0.00659 Private Clinic & Hospital 39,350 5,903 4,813 2,756 926 622 63 32 1,871 2,588 2,546 45 270 137 14 2,616 0 7 6.58 15.69 4.75 0.00660 NGO 39,350 5,903 4,659 1,212 202 504 30 20 538 1,092 1,075 36 14 145 39 1,036 7 7 2.78 3.42 1.37 3.47Moulvibazar District Total 39,350 5,90322,756 10,995 3,099 4,287 227 131 3,020 7,665 7,392 346 1,230 552 840 9,520 18 50 19.48 52.50 7.67 0.58661 Sunamganj District Hospital , Sunamganj 48,681 7,302 235 1,280 94 409 0 5 6 420 346 77 0 0 168 205 9 0 0.86 1.29 0.01 9.57662 Doarabazar Upazila Health Complex , Sunamganj 4,324 649 66 44 29 35 0 0 0 35 32 3 0 3 3 33 0 0 0.81 4.47 0.00 0.00663 Jagannathpur Upazila Health Complex ,Sunamganj 5,527 829 254 306 69 199 1 9 0 209 201 10 34 0 43 220 0 0 3.78 8.32 0.00 0.00664 Biswambarpur Upazila Health Complex ,Sunamganj 3,083 462 402 159 28 132 0 0 0 132 121 11 0 0 28 225 1 2 4.28 6.06 0.00 3.57665 Chhatak Upazila Health Complex , Sunamganj 8,053 1,208 672 428 89 364 0 0 0 364 343 23 0 0 70 400 0 0 4.52 7.37 0.00 0.00666 Deerai Upazila Health Complex , Sunamganj 4,959 744 42 505 59 480 0 0 0 480 439 41 0 0 12 323 0 0 9.68 7.93 0.00 0.00667 Dharmapasha Upazila Health Complex ,Sunamganj 4,475 671 405 407 229 125 0 0 0 125 120 7 0 0 31 132 0 1 2.79 34.11 0.00 0.00668 Jamalganj Upazila Health Complex , Sunamganj 3,398 510 127 154 25 136 0 0 0 136 117 20 0 0 16 180 1 1 4.00 4.90 0.00 4.00669 Kaitak RHC 8,053 1,208 117 1,057 197 874 0 0 0 874 833 41 0 0 197 692 0 0 10.85 16.31 0.00 0.00670 Sulla Upazila Health Complex , Sunamganj 2,187 328 52 216 37 143 16 0 0 159 151 8 0 0 16 152 3 1 7.27 11.28 0.00 8.11671 Taherpur Upazila Health Complex , Sunamganj 3,701 555 71 94 5 74 7 0 0 81 62 20 0 0 4 73 1 1 2.19 0.90 0.00 20.00672 MCWC 48,681 7,302 2,652 644 139 357 1 2 64 424 407 21 36 41 169 599 0 0 0.87 1.90 0.13 0.00673 Private Clinic & Hospital 48,681 7,302 2,054 2,320 424 1,089 4 12 656 1,761 1,671 104 29 31 260 1,640 3 5 3.62 5.81 1.35 0.71674 NGO 48,681 7,302 1,253 543 103 178 0 0 260 438 420 25 21 31 71 420 0 2 0.90 1.41 0.53 0.00Sunamgonj District Total 48,681 7,302 8,402 8,157 1,527 4,595 29 28 986 5,638 5,263 411 120 106 1,088 5,294 18 13 11.58 20.91 2.03 1.18675 MAG Osmani Medical College Hospital , Sylhe 62,303 9,346 8,891 12,156 9,608 3,609 285 157 4,603 8,654 7,850 882 1,359 177 0 3,619 110 218 13.89 102.81 7.39 1.14
Table-A: Statistical data of 690 facilities during the period January to December, 2010 (including public, private and NGO facilities) (Contd...)20Type Of DeliveryOutcome ofDeliveryInstitute NameSl. No.Expected Birth(Jan-Dec 2010)EstimatedComplicaions(Jan-Jun 2010)ANC ServicesAdmittedPatientsComplicationstreatedNormalDeliveryForsafe/ Vacum/DestructiveVaginal Breech/FaceCaesareanTotalDeliveryLiveStillBirthBirthOther OperationsRefar InRefar OutPNC ServicesMaternal DeathNeonatal DeathProportion (%) ofall births in EmOCfacilitiesMet need (%) forEmOCCS as % of allbirthsCase Fatality Rate(CFR)676 Shahid Shamsuddin (100 Beded) Hospital , Sylhe 62,303 9,346 1,000 90 67 1 0 0 73 74 75 1 0 0 7 0 0 0 0.12 0.72 0.12 0.00677 Beanibazar Upazila Health Complex , Sylhe 5,144 772 4,288 2,927 1,092 1,845 14 19 106 1,984 1,948 51 191 0 300 2,240 4 13 38.57 141.54 2.06 0.37678 Golapganj Upazila Health Complex , Sylhe 6,438 966 923 842 133 674 1 1 3 679 655 26 9 0 72 679 0 0 10.55 13.77 0.05 0.00679 Jointapur Upazila Health Complex , Sylhe 2,971 446 404 558 143 389 0 8 0 397 361 39 0 1 56 417 0 0 13.36 32.09 0.00 0.00680 Kanaighat Upazila Health Complex , Sylhe 5,265 790 814 226 72 159 0 0 0 159 154 6 0 0 27 274 0 0 3.02 9.12 0.00 0.00681 Balaganj Upazila Health Complex , Sylhe 6,238 936 35 314 43 183 0 6 0 189 177 13 0 0 40 14 0 0 3.03 4.60 0.00 0.00682 Biswanath Upazila Health Complex , Sylhe 4,640 696 4,575 66 8 55 0 0 0 55 54 1 0 0 11 2,212 0 0 1.19 1.15 0.00 0.00683 Companiganj Upazila Health Complex , Sylhe 2,782 417 112 197 94 97 0 0 0 97 97 0 0 12 46 67 0 0 3.49 22.53 0.00 0.00684 Fenchuganj Upazila Health Complex , Sylhe 2,235 335 258 486 80 353 0 0 0 353 352 1 0 0 53 183 0 0 15.79 23.86 0.00 0.00685 Gowainghat Upazila Health Complex , Sylhe 5,063 759 399 86 13 68 0 0 0 68 57 11 0 0 12 0 0 0 1.34 1.71 0.00 0.00686 South Surma UHC 5,206 781 0 0 0 0 0 0 0 0 0 0 0 0 0 0 0 0 0.00 0.00 0.00 0.00687 Zokigang Upazila Health Complex , Sylhe 4,848 727 578 534 86 199 0 2 0 201 233 0 10 0 103 493 0 0 4.15 11.83 0.00 0.00688 MCWC 62,303 9,346 0 0 0 0 0 0 0 0 0 0 0 0 0 0 0 0 0.00 0.00 0.00 0.00689 Private Clinic & Hospital 62,303 9,346 5,847 1,454 304 494 0 0 731 1,225 1,221 9 74 18 40 989 0 6 1.97 3.25 1.17 0.00690 NGO 62,303 9,346 0 0 0 0 0 0 0 0 0 0 0 0 0 0 0 0 0.00 0.00 0.00 0.00Sylhet District Total 62,303Sylhet DivisionTotal 193,141Bangladesh Total 3,029,2019,346 28,124 19,936 28,971 65,380 454,380 1,516,420 11,743 8,126 300 193 5,516 14,135 13,234 1,040 1,643 208 767 11,187 114 237 22.69 125.65 8.85 0.9748,328 18,409 20,689 621 456 11,612 33,378 31,453 2,206 3,044 1,060 3,395 30,920 177 306 17.28 63.54 6.01 0.96766,973 243,830 320,226 4,007 3,810 230,669 558,712 546,233 17,862 27,032 20,257 36,327 597,146 1,700 2,280 18.44 53.66 7.61 0.70..........................................................................................................................................................................Correspondence should be addressd to:From,............................................................................................................................................................................................................................................................................................................To,DirectorManagement Information System (MIS)Directorate General of Health Services (DGHS)Mohakhali, Dhaka -1212, BangladeshPhone:88-02-8816459; Fax: 88-02-8813875E-mail: info@dghs.gov.bd
![Bangladesh Demographic and Health Survey 2007 [FR207]](https://img.yumpu.com/38440445/1/190x257/bangladesh-demographic-and-health-survey-2007-fr207.jpg?quality=85)