1600 Series In-Line Pump - Taco-Hvac
1600 Series In-Line Pump - Taco-Hvac
1600 Series In-Line Pump - Taco-Hvac
- No tags were found...

Create successful ePaper yourself
Turn your PDF publications into a flip-book with our unique Google optimized e-Paper software.
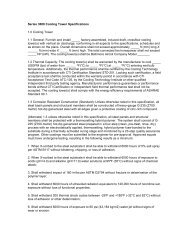
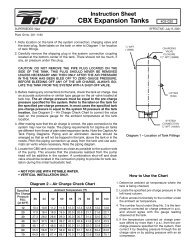
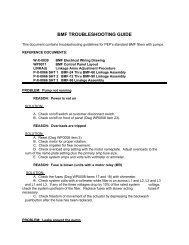
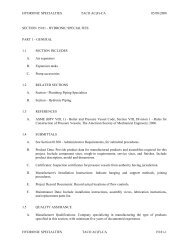
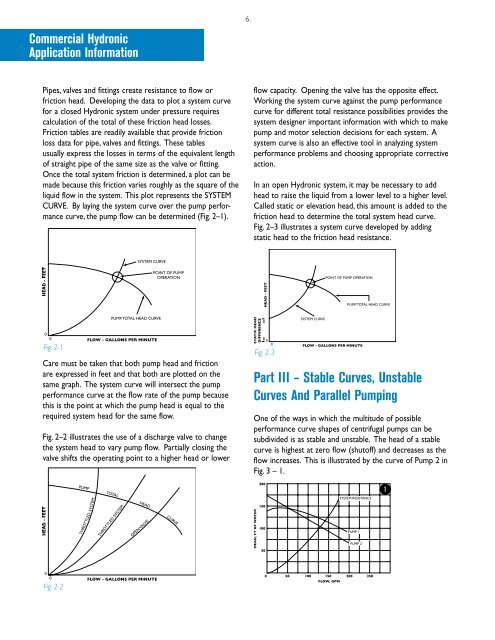
Commercial HydronicApplication <strong>In</strong>formation6.Pipes, valves and fittings create resistance to flow orfriction head. Developing the data to plot a system curvefor a closed Hydronic system under pressure requirescalculation of the total of these friction head losses.Friction tables are readily available that provide frictionloss data for pipe, valves and fittings. These tablesusually express the losses in terms of the equivalent lengthof straight pipe of the same size as the valve or fitting.Once the total system friction is determined, a plot can bemade because this friction varies roughly as the square of theliquid flow in the system. This plot represents the SYSTEMCURVE. By laying the system curve over the pump performancecurve, the pump flow can be determined (Fig. 2–1).flow capacity. Opening the valve has the opposite effect.Working the system curve against the pump performancecurve for different total resistance possibilities provides thesystem designer important information with which to makepump and motor selection decisions for each system. Asystem curve is also an effective tool in analyzing systemperformance problems and choosing appropriate correctiveaction.<strong>In</strong> an open Hydronic system, it may be necessary to addhead to raise the liquid from a lower level to a higher level.Called static or elevation head, this amount is added to thefriction head to determine the total system head curve.Fig. 2–3 illustrates a system curve developed by addingstatic head to the friction head resistance.Fig. 2-11Care must be taken that both pump head and frictionare expressed in feet and that both are plotted on thesame graph. The system curve will intersect the pumpperformance curve at the flow rate of the pump becausethis is the point at which the pump head is equal to therequired system head for the same flow.Fig. 2–2 illustrates the use of a discharge valve to changethe system head to vary pump flow. Partially closing thevalve shifts the operating point to a higher head or lowerFig. 2-3Part III – Stable Curves, UnstableCurves And Parallel <strong>Pump</strong>ingOne of the ways in which the multitude of possibleperformance curve shapes of centrifugal pumps can besubdivided is as stable and unstable. The head of a stablecurve is highest at zero flow (shutoff) and decreases as theflow increases. This is illustrated by the curve of <strong>Pump</strong> 2 inFig. 3 – 1.Fig. 2-22