evaluation of capital market efficiency using - journal-archieves17 ...
evaluation of capital market efficiency using - journal-archieves17 ...
evaluation of capital market efficiency using - journal-archieves17 ...

You also want an ePaper? Increase the reach of your titles
YUMPU automatically turns print PDFs into web optimized ePapers that Google loves.
ijcrb.webs.com<br />
INTERDISCIPLINARY JOURNAL OF CONTEMPORARY RESEARCH IN BUSINESS<br />
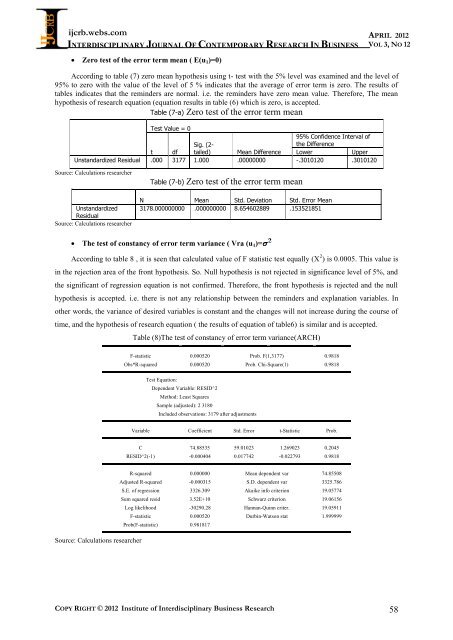
� Zero test <strong>of</strong> the error term mean ( E(u1)=0)<br />
COPY RIGHT © 2012 Institute <strong>of</strong> Interdisciplinary Business Research<br />
APRIL 2012<br />
VOL 3, NO 12<br />
According to table (7) zero mean hypothesis <strong>using</strong> t- test with the 5% level was examined and the level <strong>of</strong><br />
95% to zero with the value <strong>of</strong> the level <strong>of</strong> 5 % indicates that the average <strong>of</strong> error term is zero. The results <strong>of</strong><br />
tables indicates that the reminders are normal. i.e. the reminders have zero mean value. Therefore, The mean<br />
hypothesis <strong>of</strong> research equation (equation results in table (6) which is zero, is accepted.<br />
Table (7-a) Zero test <strong>of</strong> the error term mean<br />
Test Value = 0<br />
Sig. (2-<br />
95% Confidence Interval <strong>of</strong><br />
the Difference<br />
t df tailed) Mean Difference Lower Upper<br />
Unstandardized Residual .000 3177 1.000 .00000000 -.3010120 .3010120<br />
Source: Calculations researcher<br />
Unstandardized<br />
Residual<br />
Source: Calculations researcher<br />
Table (7-b) Zero test <strong>of</strong> the error term mean<br />
N Mean Std. Deviation Std. Error Mean<br />
3178.000000000 .000000000 8.654602889 .153521851<br />
� The test <strong>of</strong> constancy <strong>of</strong> error term variance ( Vra (u1)=<br />
According to table 8 , it is seen that calculated value <strong>of</strong> F statistic test equally (X 2 ) is 0.0005. This value is<br />
in the rejection area <strong>of</strong> the front hypothesis. So. Null hypothesis is not rejected in significance level <strong>of</strong> 5%, and<br />
the significant <strong>of</strong> regression equation is not confirmed. Therefore, the front hypothesis is rejected and the null<br />
hypothesis is accepted. i.e. there is not any relationship between the reminders and explanation variables. In<br />
other words, the variance <strong>of</strong> desired variables is constant and the changes will not increase during the course <strong>of</strong><br />
time, and the hypothesis <strong>of</strong> research equation ( the results <strong>of</strong> equation <strong>of</strong> table6) is similar and is accepted.<br />
Source: Calculations researcher<br />
Table (8)The test <strong>of</strong> constancy <strong>of</strong> error term variance(ARCH)<br />
F-statistic 0.000520 Prob. F(1,3177) 0.9818<br />
Obs*R-squared 0.000520 Prob. Chi-Square(1) 0.9818<br />
Test Equation:<br />
Dependent Variable: RESID^2<br />
Method: Least Squares<br />
Sample (adjusted): 2 3180<br />
Included observations: 3179 after adjustments<br />
Variable Coefficient Std. Error t-Statistic Prob.<br />
C 74.88535 59.01023 1.269023 0.2045<br />
RESID^2(-1) -0.000404 0.017742 -0.022793 0.9818<br />
R-squared 0.000000 Mean dependent var 74.85508<br />
Adjusted R-squared -0.000315 S.D. dependent var 3325.786<br />
S.E. <strong>of</strong> regression 3326.309 Akaike info criterion 19.05774<br />
Sum squared resid 3.52E+10 Schwarz criterion 19.06156<br />
Log likelihood -30290.28 Hannan-Quinn criter. 19.05911<br />
F-statistic 0.000520 Durbin-Watson stat 1.999999<br />
Prob(F-statistic) 0.981817<br />
58