evaluation of capital market efficiency using - journal-archieves17 ...
evaluation of capital market efficiency using - journal-archieves17 ...
evaluation of capital market efficiency using - journal-archieves17 ...
Create successful ePaper yourself
Turn your PDF publications into a flip-book with our unique Google optimized e-Paper software.
ijcrb.webs.com<br />
INTERDISCIPLINARY JOURNAL OF CONTEMPORARY RESEARCH IN BUSINESS<br />
Abstract<br />
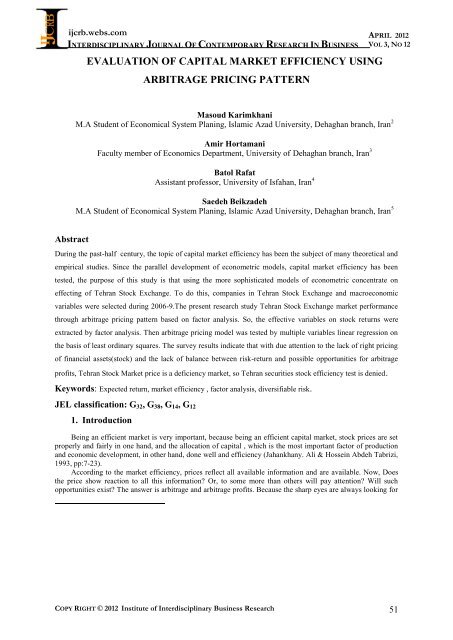
EVALUATION OF CAPITAL MARKET EFFICIENCY USING<br />
ARBITRAGE PRICING PATTERN<br />
COPY RIGHT © 2012 Institute <strong>of</strong> Interdisciplinary Business Research<br />
APRIL 2012<br />
VOL 3, NO 12<br />
Masoud Karimkhani<br />
M.A Student <strong>of</strong> Economical System Planing, Islamic Azad University, Dehaghan branch, Iran 2<br />
Amir Hortamani<br />
Faculty member <strong>of</strong> Economics Department, University <strong>of</strong> Dehaghan branch, Iran 3<br />
Batol Rafat<br />
Assistant pr<strong>of</strong>essor, University <strong>of</strong> Isfahan, Iran 4<br />
Saedeh Beikzadeh<br />
M.A Student <strong>of</strong> Economical System Planing, Islamic Azad University, Dehaghan branch, Iran 5<br />
During the past-half century, the topic <strong>of</strong> <strong>capital</strong> <strong>market</strong> <strong>efficiency</strong> has been the subject <strong>of</strong> many theoretical and<br />
empirical studies. Since the parallel development <strong>of</strong> econometric models, <strong>capital</strong> <strong>market</strong> <strong>efficiency</strong> has been<br />
tested, the purpose <strong>of</strong> this study is that <strong>using</strong> the more sophisticated models <strong>of</strong> econometric concentrate on<br />
effecting <strong>of</strong> Tehran Stock Exchange. To do this, companies in Tehran Stock Exchange and macroeconomic<br />
variables were selected during 2006-9.The present research study Tehran Stock Exchange <strong>market</strong> performance<br />
through arbitrage pricing pattern based on factor analysis. So, the effective variables on stock returns were<br />
extracted by factor analysis. Then arbitrage pricing model was tested by multiple variables linear regression on<br />
the basis <strong>of</strong> least ordinary squares. The survey results indicate that with due attention to the lack <strong>of</strong> right pricing<br />
<strong>of</strong> financial assets(stock) and the lack <strong>of</strong> balance between risk-return and possible opportunities for arbitrage<br />
pr<strong>of</strong>its, Tehran Stock Market price is a deficiency <strong>market</strong>, so Tehran securities stock <strong>efficiency</strong> test is denied.<br />
Keywords: Expected return, <strong>market</strong> <strong>efficiency</strong> , factor analysis, diversifiable risk.<br />
JEL classification: G32, G38, G14, G12<br />
1. Introduction<br />
Being an efficient <strong>market</strong> is very important, because being an efficient <strong>capital</strong> <strong>market</strong>, stock prices are set<br />
properly and fairly in one hand, and the allocation <strong>of</strong> <strong>capital</strong> , which is the most important factor <strong>of</strong> production<br />
and economic development, in other hand, done well and <strong>efficiency</strong> (Jahankhany. Ali & Hossein Abdeh Tabrizi,<br />
1993, pp:7-23).<br />
According to the <strong>market</strong> <strong>efficiency</strong>, prices reflect all available information and are available. Now, Does<br />
the price show reaction to all this information? Or, to some more than others will pay attention? Will such<br />
opportunities exist? The answer is arbitrage and arbitrage pr<strong>of</strong>its. Because the sharp eyes are always looking for<br />
51
ijcrb.webs.com<br />
INTERDISCIPLINARY JOURNAL OF CONTEMPORARY RESEARCH IN BUSINESS<br />
COPY RIGHT © 2012 Institute <strong>of</strong> Interdisciplinary Business Research<br />
APRIL 2012<br />
VOL 3, NO 12<br />
opportunities that optimistic people lose because <strong>of</strong> the traditional models. So long as there is the possibility <strong>of</strong><br />
<strong>using</strong> arbitrage pr<strong>of</strong>it, the <strong>market</strong> will not be efficient and as long as there is discussions such …., There will be<br />
such opportunities.<br />
2. Literature<br />
From the early twenties century, the beliefs <strong>of</strong> some <strong>of</strong> securities stock <strong>market</strong> agents was that the<br />
historical study <strong>of</strong> prices contains useful information to predict future prices, so get with the price trend, changes<br />
patterns are recognized and tells us that <strong>of</strong>ten special trend will happen. Believer <strong>of</strong> this idea called on Chartists,<br />
because they focused on the charts ( Sinaie, 5:1373). The fundamental analysis was not required in this school<br />
and its supporters believed that the history is repeated ( Fisher & Jordan, 635:1991).<br />
From 1930s, other studies is started on the opposite views, the principal attention <strong>of</strong> these researches was<br />
on the being random <strong>of</strong> prices behaviors, and that the prices don not follow special trend. The results <strong>of</strong> the<br />
studies as an strong intellectual and the random behavior <strong>of</strong> prices was formed (Sinaie, 50:1993).<br />
Through experimental tests, the random walk school through empirical test proved that successive price<br />
changes in short term, such a day, a week or a month, is independent <strong>of</strong> each other (Fisher & Jordan, 635:1991).<br />
After the 1960s, investigation <strong>of</strong> the statistical form <strong>of</strong> prices behavior led to the problem <strong>of</strong> economic<br />
characteristics <strong>of</strong> the stock <strong>market</strong>, which in turn, led to random changes. This rise <strong>efficiency</strong> <strong>market</strong> idea (<br />
Sinaie, 50:1992). Fundamentalists believe that an analysis <strong>of</strong> key economic and financial variables (actual value<br />
<strong>of</strong> stock) can be rought into contribution (Fisher & Jordan, 635:1991). According to this belief anyone can not<br />
gain return systematically more than the risk that accepted in long term. In such <strong>market</strong>, the stock price is a<br />
reflection <strong>of</strong> related information and the price changes have not special approach and is not predictable ( Fadaie<br />
Nejad, 7:1996).<br />
Being an efficient <strong>market</strong> is very important, because being an efficient <strong>capital</strong> <strong>market</strong>, stock prices are set<br />
properly and fairly in one hand, and the allocation <strong>of</strong> <strong>capital</strong> , which is the most important factor <strong>of</strong> production<br />
and economic development, in other hand, done well and <strong>efficiency</strong> (Jahankhany & Abdeh Tabrizi, 7:1993).<br />
Some financial economists have examined the stock <strong>market</strong> <strong>efficiency</strong> through the pricing mechanism <strong>of</strong><br />
arbitrage, return creation devices and then they investigated risk relationship with return in securities stock<br />
<strong>market</strong>. They investigated the available patterns related to the process <strong>of</strong> return creation and risk relationship<br />
with return and introduced different factors as exogenous variables. In the following section, the theoretical<br />
model <strong>of</strong> pricing theory and also its test in Tehran stock security is investigated.<br />
2-1. Providing the arbitrage pricing models<br />
Arbitrage pricing theory is a new and different approach in determining <strong>of</strong> assets price and try to identify<br />
out- <strong>of</strong>- <strong>market</strong> factors that can impact on the securities. This theory relies on the law <strong>of</strong> one price, i.e. we cannot<br />
sold similar items with different prices in <strong>market</strong>. Risks associated with equity, arising from two sources. The<br />
first sources <strong>of</strong> risk are macroeconomic factors on the property distributed in the <strong>market</strong> and you can not destroy<br />
it with diversity. The second source <strong>of</strong> risk is the individual characteristic element. This element is unique to<br />
each <strong>of</strong> the securities and pricing theory can create diversification in portfolio based on arbitrage. So in an<br />
efficient <strong>market</strong>s, the risk is related only with systematic factors (macroeconomic), ( Vatshym & Paramur,<br />
1997).<br />
Introduction <strong>of</strong> arbitrage pricing model (APT)<br />
Suppose that two-factor model explain the process <strong>of</strong> stock returns (Elton & Kraber, 372-369:1955).<br />
Ri=ai + bi1 F1 + bi2F2 … +Fjei 2<br />
ai , bi1 , … , bik are fixed values <strong>of</strong> securities ( bij can be interpreted as sensitivity <strong>of</strong> agent i to j; Ri= stock<br />
returns; ei= error term with zero mean and fixed variance, and Fi represents the return <strong>of</strong> j factor ( to ease the<br />
element <strong>of</strong> time has been deleted).<br />
Supposed that co ( ei,ej)= 0 , co ( ei,fj)= 0, when i j, means that the error <strong>of</strong> any share or any phrase is<br />
uncorrelated with the error <strong>of</strong> the share.<br />
Investor who has a full range <strong>of</strong> portfolio, residual risk tend to zero and any systematic risk will be<br />
important. In this case, only the terms in the equation will affect the portfolios systematic risk are bik, bi1.<br />
So all <strong>of</strong> the investments and portfolios should be located on a page in bik, bi1 in The expected return space.<br />
If portfolio be above or below the page, there will be an opportunity for arbitrage without risk. Arbitrage will<br />
continue until the entire investments in a page are consistent. So risk balance equation and the return <strong>of</strong> a page<br />
in expected return space and bin, bi1 are :<br />
Ri=<br />
It is noteworthy that financial report ( ) or increasing in expected return for all units is bi1. So ,<br />
are the resulting return due to risk tolerance related to the first and nth factor. So, F is the same as financial<br />
report.<br />
52
ijcrb.webs.com<br />
INTERDISCIPLINARY JOURNAL OF CONTEMPORARY RESEARCH IN BUSINESS<br />
COPY RIGHT © 2012 Institute <strong>of</strong> Interdisciplinary Business Research<br />
APRIL 2012<br />
VOL 3, NO 12<br />
Now, suppose a portfolio with equal with , the portfolio <strong>of</strong> bi1 is zero that we show it with Rf. If there is<br />
not risk-free assets, the return <strong>of</strong> a portfolio with zero beta be replaced with . With replacing with<br />
and the existence <strong>of</strong> a portfolio with biz=0 and bi1=1 , can be seen that: , where, Ri=<br />
portfolio, s return, bi1 to bik=0 . In total, or the additional expected return <strong>of</strong><br />
portfolio, only considering, risk index is j and has a single scale <strong>of</strong> risk.<br />
2-2 Relationship between arbitrage pricing and <strong>capital</strong> <strong>market</strong> <strong>efficiency</strong><br />
Efficient <strong>market</strong> model for return and securities price depend on different forces. The first major force is<br />
the effect <strong>of</strong> <strong>market</strong> changes on securities price changes that is out <strong>of</strong> control <strong>of</strong> investors and existing firms in<br />
the <strong>market</strong>. Other price fluctuations is caused by other factors such as industry effects, firm effect and etc. The<br />
<strong>market</strong> factor is important in stock pricing and the its adjustment is not possible through diversification, while<br />
we can eliminate other factors in diversification in assets basket. Therefore the risk related to <strong>market</strong> changes<br />
which is called unsystematic risk ( variability) risk is compensated through <strong>market</strong>. The possible variety <strong>of</strong><br />
components and the impossible factor measure relationship scale or alignment <strong>of</strong> securities price changes with<br />
the rest ones and can be used in the regression analysis. Arbitrage pricing model introduces systematic risk<br />
firstly and then consider the <strong>efficiency</strong>. Thus, according to some researchers, arbitrage pricing model <strong>using</strong><br />
several macroeconomic variables to explain variations in stock return or financial report helps to increase our<br />
understanding and ability to measure the risk. So, the possible relationship between stock return and financial<br />
report <strong>of</strong> variability <strong>of</strong> risk indicates the existence <strong>of</strong> arbitrage pr<strong>of</strong>it or breach <strong>of</strong> the same unit price and <strong>market</strong><br />
<strong>efficiency</strong> in stock values pricing is inefficient.<br />
2-3 Arbitrage pricing<br />
The theory <strong>of</strong> arbitrage pricing ties to identify out-<strong>of</strong>-<strong>market</strong> factors that affect on securities. This theory<br />
relies on the law <strong>of</strong> one price. One advantages <strong>of</strong> this theory is that no need to the strong assumptions used in<br />
<strong>capital</strong> assets pricing model (Elton et.al, 124-115:2003). Unlike <strong>capital</strong> assets pricing model that limit much<br />
prioritization and return divisions, arbitrage pricing model explain expected return <strong>of</strong> asset only on the basis <strong>of</strong><br />
weak assumptions and in where, there is not arbitrage opportunities (Jils & Lroy, 229-213:1991).<br />
The relationship <strong>of</strong> risk with stock rise from two sources. The first source <strong>of</strong> risk are macroeconomic<br />
factors that affect on all securities. The effect <strong>of</strong> all these factors on all assets is distributed in <strong>market</strong> and cannot<br />
eliminate it with diversification in stock. The second source <strong>of</strong> risk is individual characteristic element. This<br />
element is unique to each <strong>of</strong> securities and you can create diversification in portfolio on the basis <strong>of</strong> arbitrage<br />
pricing theory, so in an <strong>efficiency</strong> <strong>market</strong>, financial report related only to the systematic factors<br />
( macroeconomics).<br />
In arbitrage pricing theory is supposed that arbitrage pr<strong>of</strong>it opportunities is quickly eliminated through<br />
competitive forces, i.e. the investor cannot gain the expected positive return on each <strong>of</strong> set <strong>of</strong> assets without risk<br />
tolerance and without special investment ( Bery et.al, 42-29:1988).<br />
Generally, arbitrage pricing theory discussions emphasis on the subject that the return <strong>of</strong> asset is divided<br />
by expected return and unexpected one. So arbitrage pricing theory predict that public news affect on the total<br />
rate <strong>of</strong> stock but in different amounts. From this aspect, arbitrage pricing theory is more common than <strong>capital</strong><br />
assets pricing model. Because it believes that additional factors influence on the rate <strong>of</strong> return <strong>of</strong> asset (<br />
Katberson, 160-158:1966).<br />
2-4 Arbitrage pricing theory factors<br />
The major problem in investigating <strong>of</strong> arbitrage pricing theory is that it dose not <strong>of</strong>fer any discussion about<br />
events and factors that influence on all assets. Coordinated movement <strong>of</strong> asset prices reflect fundamental and<br />
independent factors, but anyone still determined these economic variables ( Chen et.al, 1986).<br />
So there is not a formal theoretical guidance for the selection <strong>of</strong> an appropriate group <strong>of</strong> economic factors<br />
that is used in arbitrage pricing theory model ( Azir & Yonizava, 591-568:2006).<br />
Since the nature and the number <strong>of</strong> affecting factors in arbitrage pricing theory is not specified, two<br />
approach are used for practical and empirical implementation <strong>of</strong> the theory. The approach used originally<br />
presented by Gohar (1978) and then developed by Ross and Roll (1980) and relies on factor analysis to estimate<br />
simultaneously common factors and also factor <strong>market</strong> to determine securities return. The second approach is<br />
against the factor analysis one. Chen et.al (1986)tried to made use <strong>of</strong> macroeconomic variables to explain <strong>capital</strong><br />
assets return in arbitrage pricing theory . So macroeconomic variables were used as used factors for the process<br />
<strong>of</strong> calculation <strong>of</strong> stock returns in arbitrage pricing theory (Chen et.al, 382-361:1986).<br />
Selection <strong>of</strong> factors through macroeconomic variables model in this approach for practical and empirical<br />
implementation <strong>of</strong> the theory <strong>of</strong> arbitrage pricing can be avoided from factor analysis and instead <strong>of</strong> it. Factor<br />
Betas are measured through the amount <strong>of</strong> sensitivity <strong>of</strong> securities returns to changes in groups <strong>of</strong><br />
macroeconomic variables through the method <strong>of</strong> time series. This approach is the same as two stage method<br />
used by Fama and Mac Beth in the review <strong>of</strong> <strong>capital</strong> asset pricing model. A number <strong>of</strong> researchers<br />
experimentally have a review on relation between the fundamental economic variables and stock returns <strong>using</strong><br />
53
ijcrb.webs.com<br />
INTERDISCIPLINARY JOURNAL OF CONTEMPORARY RESEARCH IN BUSINESS<br />
COPY RIGHT © 2012 Institute <strong>of</strong> Interdisciplinary Business Research<br />
APRIL 2012<br />
VOL 3, NO 12<br />
the theory <strong>of</strong> arbitrage pricing against the approach <strong>of</strong> <strong>capital</strong> assets pricing model ( Azyz & Yunizava, 591-<br />
568:2006). Chen et.al used <strong>of</strong> this ,ethod innovatively in 1986.<br />
One way to use <strong>of</strong> factors in arbitrage pricing theory and the corresponding sensitivity is the identification<br />
<strong>of</strong> factors as default and <strong>using</strong> <strong>of</strong> the relation <strong>of</strong> causal and effect. In many <strong>of</strong> experimental works, the<br />
mentioned factors are created by <strong>using</strong> <strong>of</strong> factor analysis and or by main component analysis. So, in the real<br />
world have not any interpretation. From this perspective, Chen et.al works have great value, as They tried to<br />
identify factors in arbitrage pricing theory <strong>using</strong> macroeconomic variables that be affective on assets returns.<br />
3. Spatial and temporal domain <strong>of</strong> research<br />
The temporal domain <strong>of</strong> research is a 5- years period from early 1385 to early 1390s, and the spatial<br />
domain <strong>of</strong> it is Tehran Stock Exchange. Iranian <strong>capital</strong> <strong>market</strong> has the following characteristics: a) It had the<br />
companies that have active trading symbol <strong>of</strong> he beginning <strong>of</strong> 85 years(85/01/01). B) the companies symbol that<br />
should not stop more than 6 month from March 2006 until the beginning <strong>of</strong> 90 (90/01/01). C) End <strong>of</strong> financial<br />
period should not be in 12/29. d) The availability <strong>of</strong> financial and accounting data. So 53 companies were<br />
selected based on above characteristic which is presented in table (1).<br />
Table (1)<br />
Company , s name symbol industry Insert date Company , s name symbol industry Insert date<br />
<strong>of</strong>fset chaffset Publication, print,<br />
distribution<br />
11.1977 Iran Tractor Veppset Machinery and equipment 1996.04.19<br />
Alborz Drug Dalber Pharma 1996.12.14 Khazar cement Saroom Cement, lime and plaster 1995.06.08<br />
East Electric vehicle Kheshrag Automotive and<br />
parts<br />
manufacturing<br />
2003.11.18 Dorood cement Silam Cement, lime and plaster 2002.11.14<br />
Iran Khodro Khodro Automotive and<br />
parts<br />
manufacturing<br />
1993.05.06 Sepahan cement Sabic Cement, lime and plaster 1996.05.01<br />
Iran khodro Disel khavar Automotive and<br />
parts<br />
manufacturing<br />
1993.12 Shahrood cement Sobhan Cement, lime and plaster 2002.10.22<br />
Alomorad famerad Basic metals 2004.10.28 North cement sakhash Cement, lime and plaster 1968<br />
Iran Tractor forging khahen Automotive and<br />
parts<br />
manufacturing<br />
bama Kama Extraction <strong>of</strong><br />
metal ores<br />
Bank <strong>of</strong> New<br />
economy<br />
venvin Banks, credit<br />
institutions and<br />
other financial<br />
institutions<br />
Persian bank vepares Banks, credit<br />
institutions and<br />
other financial<br />
institutions<br />
Karafarin bank<br />
Behsaram Granite<br />
production<br />
vekar Banks, credit<br />
institutions and<br />
other financial<br />
institutions<br />
Iran behnosh ghabhnosh Food & beverage<br />
except sugar<br />
Pars khodro kheoares Automotive and<br />
parts<br />
manufacturing<br />
Paksan shepaksa Chemical<br />
products<br />
Abadan<br />
shaptro Chemical<br />
petrochemical<br />
products<br />
Khark<br />
shekharak Chemical<br />
petrochemical<br />
products<br />
Esfahan Peghah sahrmz Food & beverage<br />
pasteurized Milk<br />
except sugar<br />
West Azarbaijan<br />
Peghah pasteurized<br />
Milk<br />
khorasan Peghah<br />
pasteurized Milk<br />
Behshahe Industrial<br />
development<br />
1997.04 Kalsimin nabroj Basic metals 1997.11<br />
2003.12.23 Kimi drug kachini Pharma 1991.10.04<br />
2003.10.29 Bahman group sefarood Automotive and parts<br />
manufacturing<br />
1993.12.17<br />
2004.08.04 Iron ore <strong>of</strong> GolGhohar vardel Extraction <strong>of</strong> metal ores 2004.04.29<br />
2003.04.03 Leasing industry and<br />
mineral<br />
zemgsa Other financial<br />
intermediations<br />
2004.11.26<br />
lebhman Ceramic and tiles 2004.02.14 Margarine shekf Food & beverage except<br />
sugar<br />
1993.11.30<br />
1999.12.18 Iran tractor industrial<br />
machinery<br />
drazak Machinery and equipment 2003.05.25<br />
1999.08.29 Propulsion machinery beshhab Machinery and equipment 2002.04.05<br />
sahgmat Food & beverage<br />
except sugar<br />
1994.12.22 Manganese mines <strong>of</strong> Iran ghalber Extraction <strong>of</strong> metal ores 2002.11.06<br />
1996.04.03 Tehran Oil fasdid Oil products, coke and<br />
nuclear fuel<br />
1976.12<br />
1998.10.22 Pars oil pizad Oil products, coke and<br />
nuclear fuel<br />
1967.12<br />
2003.03.03 Industrial drive khamharkeh Automotive and parts<br />
manufacturing<br />
1993.12.18<br />
2004.12.15 Botan industrial group lebotan Machinery and equipment 1996.12.27<br />
ghashkar Food & beverage<br />
except sugar<br />
2004.12.15 Farabi petrochemical shafara Chemical products 1996.04.02<br />
kapshir Food & beverage 1974.12 Iran tractor foundry khetrak Automotive and parts 1998.07.12<br />
except sugar<br />
manufacturing<br />
Toil pers shepli Chemical<br />
1996.12.26 Zamiad khazamia Automotive and parts 1998.12.15<br />
products<br />
manufacturing<br />
Chadormalo mineral shalab Extraction <strong>of</strong> 2003.07.12 Saipa khesapa Automotive and parts 1995.12.28<br />
and industrial<br />
metal ores<br />
manufacturing<br />
Gaber ibn hayan hatayed pharma 1991.06.13 Azin saipa khazin Automotive and parts 2001.06.17<br />
pharmacy<br />
manufacturing<br />
daroopaksh nachit Chemical<br />
1993.12.25 Disel saipa khakaveh Automotive and parts 1994.02.10<br />
products<br />
manufacturing<br />
Tosheh pars<br />
khakaveh Automotive and 1995.12.27 Industrial group<br />
vesna investments 2003.12.20<br />
investments<br />
parts<br />
manufacturing<br />
investments<br />
Manufacture <strong>of</strong> taira Chemical<br />
2004.10.20 Iran behshahr<br />
herbicide<br />
products<br />
54
ijcrb.webs.com<br />
INTERDISCIPLINARY JOURNAL OF CONTEMPORARY RESEARCH IN BUSINESS<br />
4. Introducing variables<br />
COPY RIGHT © 2012 Institute <strong>of</strong> Interdisciplinary Business Research<br />
APRIL 2012<br />
VOL 3, NO 12<br />
The research variables consist <strong>of</strong> prices and returns <strong>of</strong> computational stock price <strong>of</strong> accepted companies and<br />
registered <strong>market</strong> indicators in Tehran Stock Exchange in average and national and international economic<br />
information which is presented in table (2).<br />
Stock price returns is as follows:<br />
i= Stock return<br />
pt i = Stock price in t time.<br />
P i t-1= Stock price in t-1 time.<br />
5. Research methodology<br />
1<br />
2<br />
3<br />
4<br />
5<br />
Crude Oil (petroleum) - Monthly<br />
Price<br />
Crude Oil (petroleum); Dated<br />
Brent - Monthly Price<br />
Crude Oil (petroleum); Dubai<br />
Fateh - Monthly Price<br />
Crude Oil (petroleum); West Texas<br />
Intermediate - Monthly Price<br />
Commodity Fuel (energy) Index -<br />
Monthly Price<br />
Ri=<br />
Table (2) Variables<br />
10 Mony-euro<br />
11 Mony-pound<br />
12 Mony-yen<br />
Money is the coins or bank notes that you use to<br />
buy things, or the sum that you have in a bank<br />
13 account<br />
14 Merchandise <strong>market</strong>(<strong>capital</strong> <strong>market</strong>)<br />
6 Total index tehran stock exchange 15 Consumption pice index<br />
7 Gold old disign -iran 16 Production pice index<br />
8 Gold new disign-iran 17 Export pice index<br />
9 Mony-dollar<br />
Arbitrage pricing model is used for the test <strong>of</strong> <strong>efficiency</strong> <strong>of</strong> <strong>market</strong> through factor analysis with<br />
determining <strong>of</strong> covariance matrix <strong>of</strong> observed variables or the same research variables and then estimation the<br />
number <strong>of</strong> factors and factor loading matrix <strong>using</strong> factor analysis method and, finally, the estimate <strong>of</strong> financial<br />
reports <strong>using</strong> factor loading and regression analysis and <strong>market</strong> <strong>efficiency</strong> was evaluated.<br />
For statistical hypothesis testing, analysis <strong>of</strong> variance <strong>using</strong> F test and for the being significant regression<br />
coefficient <strong>using</strong> T test, then the significant coefficient <strong>of</strong> determination ( R 2 ) the presence or absence<br />
relationship between independent and dependent variables were examined.<br />
6. Estimation results <strong>of</strong> arbitrage pricing model<br />
According to the literature method <strong>of</strong> Chen, Roll and Ross, factor presupposition based on Bartlett<br />
sphericity test was evaluated and appropriate subject <strong>of</strong> data to factor analysis was performed with KMO and<br />
Bartlett test . KMO and Bartlett , s test results is presented in table (3).<br />
Table (3) KMO and Bartlett's test<br />
Kaiser-Meyer-Olkin Measure <strong>of</strong> Sampling Adequacy. .703<br />
Source: Calculations researcher<br />
Bartlett's Test <strong>of</strong> Sphericity Approx. Chi-Square 1.763E5<br />
df 136<br />
Sig. .000<br />
In order to demonstrate a sufficient sample size for factor analysis should be used <strong>of</strong> mentioned tests, so<br />
that it can be seen the value <strong>of</strong> K.M.O is equal with 0.703 (table 3) that indicate enough samples for this study,<br />
the minimum value for the index is 0.5.<br />
Using s<strong>of</strong>tware such as STATESTICA, SPSS, EVIEWS and factor analysis techniques, we take the factor<br />
values for each <strong>of</strong> companies, and consider them as independent variables. Table (5) represents factor score<br />
values for each variables.<br />
55
ijcrb.webs.com<br />
INTERDISCIPLINARY JOURNAL OF CONTEMPORARY RESEARCH IN BUSINESS<br />
Table (4) <strong>of</strong> the total variance explained by factors<br />
Extraction Sums <strong>of</strong> Squared<br />
Extraction Sums<br />
<strong>of</strong> Squared<br />
Initial Eigenvalues<br />
Loadings<br />
Loadings Rotation Sums <strong>of</strong> Squared Loadings<br />
% <strong>of</strong> Cumulative<br />
% <strong>of</strong><br />
% <strong>of</strong> Cumulat<br />
Total<br />
Variance % Total Variance Cumulative % Total Variance ive %<br />
1 7.774 45.729 45.729 7.774 45.729 45.729 7.513 44.195 44.195<br />
2 5.94 34.944 80.673 5.94 34.944 80.673 5.964 35.081 79.276<br />
3 1.356 7.977 88.65 1.356 7.977 88.65 1.594 9.375 88.65<br />
Extraction Method: Principal Component Analysis.<br />
Source: Calculations researcher<br />
Table(5)<br />
Component<br />
Table(5-1) matrix <strong>of</strong> factor scores<br />
Table (5-2)<br />
rotation matrix <strong>of</strong><br />
factor scores<br />
COPY RIGHT © 2012 Institute <strong>of</strong> Interdisciplinary Business Research<br />
Table (5-3)<br />
Coefficient matrix<br />
<strong>of</strong> factor scores<br />
APRIL 2012<br />
VOL 3, NO 12<br />
1 2 3 1 2 3 1 2 3<br />
Crude Oil (petroleum) - Monthly Price<br />
Crude Oil (petroleum); Dated Brent -<br />
0.436 0.882 0.098 0.07 0.979 0.122 -0.004 0.171 -0.035<br />
Monthly Price<br />
Crude Oil (petroleum); Dubai Fateh -<br />
0.431 0.886 0.113 0.064 0.983 0.108 -0.005 0.174 -0.046<br />
Monthly Price<br />
Crude Oil (petroleum); West Texas<br />
0.485 0.854 0.094 0.127 0.971 0.124 0.003 0.168 -0.033<br />
Intermediate - Monthly Price<br />
Commodity Fuel (energy) Index - Monthly<br />
0.388 0.897 0.088 0.021 0.972 0.131 -0.011 0.169 -0.028<br />
Price 0.435 0.884 0.035 0.069 0.966 0.184 -0.004 0.161 0.01<br />
Gold old disign -iran<br />
-<br />
0.958 0.067 0.064 0.913 0.307 0 0.118 0.046 -0.038<br />
Gold new disign-iran<br />
-<br />
0.975 0.144 0.01 0.957 0.231 0.038 0.125 0.026 -0.002<br />
Money-dollar<br />
-<br />
0.848 -0.42 0.154 0.945 -0.1 0.13 0.128 -0.049 0.105<br />
Money-euro<br />
-<br />
Money-pound<br />
0.783 0.294 0.319 0.616 0.483 0.434 0.076 0.03 0.248<br />
-0.236 0.716 0.282 -0.49 0.622 -0.145 -0.075 0.144 -0.18<br />
Money-yen<br />
- -<br />
Money is the coins or bank notes that you<br />
0.908 0.356 0.102 0.976 -0.009 0.098 0.131 -0.028 0.07<br />
use to buy things, or the sum that you have<br />
-<br />
in a bank account 0.932 0.258 0.066 0.96 0.125 -0.044 0.127 0.016 -0.047<br />
Merchandise <strong>market</strong>(<strong>capital</strong> <strong>market</strong>) -0.725 0.405 0.289 -0.826 0.163 -0.255 -0.113 0.074 -0.201<br />
Consumption pice index<br />
-<br />
-0.255 0.322 0.781 -0.119 -0.211 -0.848 -0.013 0.067 -0.575<br />
Production pice index<br />
-<br />
-0.419 0.595 0.483 -0.61 0.276 0.561 -0.086 -0.008 0.364<br />
Export pice index -0.601 0.668 -0.22 -0.808 0.332 0.305 -0.113 0.037 0.175<br />
Total index tehran stock exchange<br />
Source: Calculations researcher<br />
0.863 0.016 0.343 0.792 0.409 -0.262 0.101 0.099 -0.237<br />
Based on research findings in the table (4),(5), results <strong>of</strong> study are presented. F1, F2, F3 factors are assumed as<br />
independent variables in this stage, and average monthly returns <strong>of</strong> companies (before standardization) is<br />
considered as dependent variables, so with 3- variables regression equation . cross- sectional, the balance<br />
equation ( or financial report) was derived. The results <strong>of</strong> this regression is given in table (6).<br />
Table (6) Equation to balance risk and return<br />
Coefficient Std. Error t-Statistic Prob.<br />
C(0) 1.402567 0.153499 9.137306 0.0000<br />
C1) -0.322805 0.153523 -2.102650 0.0356<br />
C(2) 0.169212 0.153523 1.102195 0.2705<br />
C(3) 0.174314 0.153523 1.135428 0.2563<br />
R-squared 0.002176 Mean dependent var 1.402567<br />
Adjusted R-squared 0.001233 S.D. dependent var 8.661377<br />
S.E. <strong>of</strong> regression 8.656035 Akaike info criterion 7.155648<br />
Sum squared resid 237968.0 Schwarz criterion 7.163276<br />
Log likelihood -11373.48 Hannan-Quinn criter. 7.158383<br />
F-statistic 2.308390 Durbin-Watson stat 2.102797<br />
Prob(F-statistic) 0.074534<br />
Source: Calculations<br />
researcher<br />
56
ijcrb.webs.com<br />
INTERDISCIPLINARY JOURNAL OF CONTEMPORARY RESEARCH IN BUSINESS<br />
7. Analysis <strong>of</strong> results<br />
COPY RIGHT © 2012 Institute <strong>of</strong> Interdisciplinary Business Research<br />
APRIL 2012<br />
VOL 3, NO 12<br />
In this study, the researcher wants to answer the question that whether Tehran Stock Exchange <strong>market</strong> is<br />
the efficient <strong>market</strong>? The research hypothesis <strong>of</strong> this study were as follows:<br />
First hypothesis: The return process in Tehran Stock Exchange is linear. According to table (6), it is seen<br />
that the F test statistic is calculated as (2.30) is not significant at the 5% significance level. i.e. , there is not any<br />
linear relationship between three factors <strong>of</strong> inevitable variability <strong>of</strong> risk and stock return <strong>of</strong> companies. In other<br />
words, hypothesis <strong>of</strong> existence <strong>of</strong> a linear relationship between return and estimated faces are not accepted.<br />
Second hypothesis: Stock return <strong>of</strong> accepted companies in Tehran Stock Exchange is always influenced<br />
by a number <strong>of</strong> macroeconomic variables. It is seen that factors statistic value except first factor is not<br />
significant in the meaningful level <strong>of</strong> 5%.<br />
Third hypothesis: there is an arbitrage opportunities in Tehran Stock Exchange.<br />
Coefficient <strong>of</strong> determination <strong>of</strong> this hypothesis is achieved 0.002. The table (6) represent these values only<br />
2 ppt <strong>of</strong> the variability <strong>of</strong> dependent variable <strong>of</strong> price return could be described by the variability in independent<br />
variables (factors), and 99% <strong>of</strong> the rest <strong>of</strong> the variability <strong>of</strong> dependent variable could be described by other than<br />
these factors. The correlation coefficient between two variables is achieved +o.o4 ( table 6) and indicates that<br />
the direction <strong>of</strong> relationship between two variables is positive. Given the potential value in significant level <strong>of</strong><br />
5% ( 0.075), the null hypothesis is not rejected and the opposite hypothesis is not confirmed.<br />
So the results <strong>of</strong> hypothesis tests indicate that changes by uncommon factors describe the total expected<br />
return <strong>of</strong> Tehran Stock Exchange. Therefore, Tehran Stock Exchange <strong>market</strong> is not an efficient <strong>market</strong>. The<br />
results <strong>of</strong> this hypothesis test are in agreement with the results <strong>of</strong> Namazi & Shushtaryan (1374), Sadeghi Batani<br />
(1384), Jamali (1384), and are not in agreement with the results <strong>of</strong> Samadi et.al (1386).<br />
Also, according to the results <strong>of</strong> factor analysis and the introduction <strong>of</strong> three factors as the main<br />
components that the total variance <strong>of</strong> the portfolio is allocated to it, It was found that on the bases <strong>of</strong> F statistic ,<br />
there is not any linear relationship between the three factors identified and the company , s stock price return.<br />
In this study, in order to identify the effect <strong>of</strong> macroeconomic variables on stock return <strong>of</strong> accepted<br />
companies in Tehran Stock Exchange was used <strong>of</strong> t. test, that indicates that among three factors which was<br />
introduced as financial report, only money factor is significant, and the role <strong>of</strong> money variables in the stock<br />
<strong>market</strong> is efficient. In confirmation <strong>of</strong> this problem can be pointed out to the Roll and Ross , phrase in 1995.<br />
The main core <strong>of</strong> ATP is the identification <strong>of</strong> this point that only a small number <strong>of</strong> systematic factors<br />
affect on long term average return <strong>of</strong> financial assets. ATP model does not deny many factors affecting on daily<br />
price changes <strong>of</strong> a share or securities, but ATP concentrate on major factors that derive total return <strong>of</strong> assets in<br />
large portfolios. You can identify these factors and benefit <strong>of</strong> internal increasing and their impact on portfolio<br />
return. (Roll & Richard & Ross, 1995).<br />
Based on research findings, the relationship identified between factors as systematic risk sources (<br />
impossible variation) <strong>of</strong> Tehran Stock Exchange and real return <strong>of</strong> portfolio is not significant . based on research<br />
findings, only 2% <strong>of</strong> fluctuations that impact on total <strong>market</strong> introduced as systematic fluctuations and the rest<br />
ones are fluctuations that cannot be expressed as common factors. In other words, nearly 99% <strong>of</strong> fluctuations <strong>of</strong><br />
the stock return <strong>of</strong> listed companies in portfolio are as the specific variance <strong>of</strong> each company that has reasons<br />
other that systematic factors (impossible variation). So you can conclude that a lot <strong>of</strong> variance n return <strong>of</strong> each<br />
portfolio company has unclear reason. <strong>market</strong> for this type <strong>of</strong> risk has not any reward to the investor. Hence, the<br />
hypothesis <strong>of</strong> lack <strong>of</strong> a arbitrage opportunities in Tehran Stock Exchange is rejected, and because <strong>of</strong><br />
misappropriate pricing <strong>of</strong> stock, arbitrage opportunities exist in that <strong>market</strong>. So, due to this point that nearly<br />
99% <strong>of</strong> stock return fluctuations in selected sample are without explanation and stock prices do not reflect<br />
related data properly, the <strong>capital</strong> <strong>market</strong> is not efficient. It should be noted that the concept <strong>of</strong> efficient <strong>market</strong><br />
performance in the strong sense <strong>of</strong> <strong>efficiency</strong> is unproven; i.e. the existence <strong>of</strong> confidential information even in<br />
the world important <strong>market</strong>s is unavoidable , and That some traded non-fair trades on more that what model<br />
showed, as according to research results, successful percent <strong>of</strong> investment based on information reflecting is<br />
very low, and is not good figure for the successful investors, and you can not expect that Iran <strong>capital</strong> <strong>market</strong> be<br />
successful in fundraising. The investors prefer the rational risks in long term, and do not throw at risk their<br />
<strong>capital</strong>s.<br />
This fact is clear that most <strong>of</strong> the changes and deviations in the observed returns still have unanswered.<br />
This shows that in Tehran Stock Exchange all information is not reflected in prices, in other words, Iran , s<br />
<strong>capital</strong> <strong>market</strong> is not efficient and therefore the price setting is not correct and there is arbitrage opportunities.<br />
8. Test the accuracy <strong>of</strong> estimation<br />
For the suitability <strong>of</strong> estimated regression, the following hypothesis ( classic hypothesis is estimated which<br />
represents the regression accuracy. The tests used for the accuracy <strong>of</strong> estimation including t-test, AutoRun<br />
regression, Dissimilar conditional variance ( ARCH) and Watson camera test.<br />
57
ijcrb.webs.com<br />
INTERDISCIPLINARY JOURNAL OF CONTEMPORARY RESEARCH IN BUSINESS<br />
� Zero test <strong>of</strong> the error term mean ( E(u1)=0)<br />
COPY RIGHT © 2012 Institute <strong>of</strong> Interdisciplinary Business Research<br />
APRIL 2012<br />
VOL 3, NO 12<br />
According to table (7) zero mean hypothesis <strong>using</strong> t- test with the 5% level was examined and the level <strong>of</strong><br />
95% to zero with the value <strong>of</strong> the level <strong>of</strong> 5 % indicates that the average <strong>of</strong> error term is zero. The results <strong>of</strong><br />
tables indicates that the reminders are normal. i.e. the reminders have zero mean value. Therefore, The mean<br />
hypothesis <strong>of</strong> research equation (equation results in table (6) which is zero, is accepted.<br />
Table (7-a) Zero test <strong>of</strong> the error term mean<br />
Test Value = 0<br />
Sig. (2-<br />
95% Confidence Interval <strong>of</strong><br />
the Difference<br />
t df tailed) Mean Difference Lower Upper<br />
Unstandardized Residual .000 3177 1.000 .00000000 -.3010120 .3010120<br />
Source: Calculations researcher<br />
Unstandardized<br />
Residual<br />
Source: Calculations researcher<br />
Table (7-b) Zero test <strong>of</strong> the error term mean<br />
N Mean Std. Deviation Std. Error Mean<br />
3178.000000000 .000000000 8.654602889 .153521851<br />
� The test <strong>of</strong> constancy <strong>of</strong> error term variance ( Vra (u1)=<br />
According to table 8 , it is seen that calculated value <strong>of</strong> F statistic test equally (X 2 ) is 0.0005. This value is<br />
in the rejection area <strong>of</strong> the front hypothesis. So. Null hypothesis is not rejected in significance level <strong>of</strong> 5%, and<br />
the significant <strong>of</strong> regression equation is not confirmed. Therefore, the front hypothesis is rejected and the null<br />
hypothesis is accepted. i.e. there is not any relationship between the reminders and explanation variables. In<br />
other words, the variance <strong>of</strong> desired variables is constant and the changes will not increase during the course <strong>of</strong><br />
time, and the hypothesis <strong>of</strong> research equation ( the results <strong>of</strong> equation <strong>of</strong> table6) is similar and is accepted.<br />
Source: Calculations researcher<br />
Table (8)The test <strong>of</strong> constancy <strong>of</strong> error term variance(ARCH)<br />
F-statistic 0.000520 Prob. F(1,3177) 0.9818<br />
Obs*R-squared 0.000520 Prob. Chi-Square(1) 0.9818<br />
Test Equation:<br />
Dependent Variable: RESID^2<br />
Method: Least Squares<br />
Sample (adjusted): 2 3180<br />
Included observations: 3179 after adjustments<br />
Variable Coefficient Std. Error t-Statistic Prob.<br />
C 74.88535 59.01023 1.269023 0.2045<br />
RESID^2(-1) -0.000404 0.017742 -0.022793 0.9818<br />
R-squared 0.000000 Mean dependent var 74.85508<br />
Adjusted R-squared -0.000315 S.D. dependent var 3325.786<br />
S.E. <strong>of</strong> regression 3326.309 Akaike info criterion 19.05774<br />
Sum squared resid 3.52E+10 Schwarz criterion 19.06156<br />
Log likelihood -30290.28 Hannan-Quinn criter. 19.05911<br />
F-statistic 0.000520 Durbin-Watson stat 1.999999<br />
Prob(F-statistic) 0.981817<br />
58
ijcrb.webs.com<br />
INTERDISCIPLINARY JOURNAL OF CONTEMPORARY RESEARCH IN BUSINESS<br />
� To test the self- correlation <strong>of</strong> error term<br />
COPY RIGHT © 2012 Institute <strong>of</strong> Interdisciplinary Business Research<br />
APRIL 2012<br />
VOL 3, NO 12<br />
Table (6) indicates that the Watson camera statistic is 2.7 which indicating their lock <strong>of</strong> errors selfcorrelation.<br />
Therefore, the null hypothesis is not rejected in significant level <strong>of</strong> 5% and the lack <strong>of</strong> self-<br />
correlation is confirmed. So, the front hypothesis is rejected and null one is accepted. i.e. the reminders <strong>of</strong><br />
estimation equation have not self- correlations (table6).<br />
9.Conclusions and policy proposals<br />
The results <strong>of</strong> research findings indicate that the Tehran Stock Exchange is deficient <strong>market</strong> because <strong>of</strong><br />
lack <strong>of</strong> proper pricing <strong>of</strong> financial assets (stock) and lack <strong>of</strong> balance between risk-return and possible<br />
opportunities for arbitrage pr<strong>of</strong>it. As soon as the production <strong>of</strong> information, it is not entered into <strong>market</strong> and its<br />
entrance to the <strong>market</strong> is not causal. Also, the effect <strong>of</strong> information on prices can not be in one end.<br />
According to the research findings, the misinterpretation <strong>of</strong> information can affect on <strong>market</strong> misleading<br />
and valuing . How to analyze information and the amount and optimism or pessimism level about information<br />
can affect on the pricing. Optimists are optimistic to deal with incoming information and set higher prices for<br />
them, and pessimists set lower prices even for that valuable information. In one hand, optimists risk more on<br />
unreliable futures and predict the future events incorrect. Also, <strong>market</strong> traders that have less information about<br />
upcoming events pay to stock price invasive than others. It is caused the <strong>market</strong> be inefficient in pricing <strong>of</strong><br />
securities and they trusted more on incomplete information and excess in pricing based on.<br />
The effect <strong>of</strong> Tehran Stock Exchange on the country , s economic is undeniable. The main task <strong>of</strong> the<br />
<strong>capital</strong> <strong>market</strong> is moving up to the effective and efficient allocation <strong>of</strong> <strong>capital</strong> <strong>of</strong> these sources. Therefore, the<br />
necessity <strong>of</strong> an efficient <strong>market</strong> is felt. One <strong>of</strong> the necessary conditions for such a <strong>market</strong> is that all information<br />
including accountability and economistic information are available to investors free to interpret them the<br />
similar. Obviously, the discovery <strong>of</strong> the relationship between economistic and accounting variables and<br />
investment risk can be reinforcing the need to disclose <strong>of</strong> financial information. Therefore, the following<br />
recommendations from the study are provided:<br />
Stock Exchange <strong>of</strong>ficials with the obligation to timely reporting <strong>of</strong> information by companies can provide<br />
alternatives information on <strong>capital</strong> risk to investors to make economic decisions. This includes information such<br />
as economic, industry conditions and industry operating pr<strong>of</strong>it.<br />
According to results, the potential and actual investors in the Tehran Stock Exchange is recommended that<br />
you consider the affecting accounting variables in systematic risk and the amount pr<strong>of</strong>it as a substitute for<br />
systematic risk when buying or selling the companies stock.<br />
59
ijcrb.webs.com<br />
INTERDISCIPLINARY JOURNAL OF CONTEMPORARY RESEARCH IN BUSINESS<br />
COPY RIGHT © 2012 Institute <strong>of</strong> Interdisciplinary Business Research<br />
APRIL 2012<br />
VOL 3, NO 12<br />
References<br />
1. Azeez, A. A. & Yonezawa, Y(2006), “Macroeconomic factors and the empirical content <strong>of</strong> the<br />
Arbitrage Pricing Theory in the Japanese stock <strong>market</strong>“. Japan and the World Economy, 18: 568–<br />
591.<br />
2. Berry M. A., Burmeister E., McElroy M. (1988), “Sorting out risks <strong>using</strong> known APT factors“.<br />
Financial Analyst Journal, 44 (2): 29–42..<br />
3. chen, N.F., Roll , R., Ross .S.A(1986),” economic forces and the stock <strong>market</strong>“.<strong>journal</strong> <strong>of</strong> business No.<br />
59, Pp. 83-403<br />
4. Choudhuy, T(1995),” Integrated-Garch and Non Stationary Variances: Evidence from European Stock-<br />
Market During1920-1930“. Economic letters, 1: 55-59.<br />
5. Cuthbertson, K. (1996),”Quantitative financial economics: Stocks, bonds and foreign exchange“.<br />
Chichester [etc.]: Wiley, cop<br />
6. Elton , Dewin J. & Martin J. Gruber (1995), “ Modern portfolio theory and investment analysis“. 5d.<br />
ed. John wiley & sons<br />
7. Elton, E.J., Gruber, M.J., Brown, S.J. and Goetzmann, W.N. (2003),” Modern Portfolio Theory and<br />
Investment Analysis“. 6th ed. John Wiley &Sons, New York.<br />
8. Fadaie Nejad, Mohammad Esmail (1374), “The test <strong>of</strong> weak form <strong>of</strong> <strong>capital</strong> <strong>efficiency</strong> and in Tehran<br />
Stock Exchange” , financial researches, NO.5.<br />
9. Fama, E(1970),” “Efficient Capital Markets: A review <strong>of</strong> theory and empirical work“, Journal <strong>of</strong><br />
Finance, No. 25, Pp. 383-417<br />
10. Fama, E. and Blume, M(1966),” Filter Rules and Stock Market Trading Pr<strong>of</strong>its“.Journal <strong>of</strong> Business,<br />
39, 226-341..<br />
11. Fischer , Donald E. & Ronald J. Jordan (1991),” Security Analysis and portfolio management“ . 5d. ed<br />
prentice – Hall<br />
12. Frankfurter , George M. & Elton G. McGoun (1996), Toward Finance with meaning the methodology<br />
<strong>of</strong> finance:what it is and what it can be“ , JAI press Inc.<br />
13. Gilles, R. & Leroy, S. F. (1991),” On the Arbitrage Pricing Theory“. Economic Theory, 1(3): 213–229.<br />
14. Hunter, D.M(1996),” The Performance <strong>of</strong> Filter Rules on the Jamaica Stock Exchange“. Applied<br />
Economics letters, 5: 297-300.<br />
15. Jahankhany, Ali and Hossein Abdeh Tabrizi (1372), “the idea <strong>of</strong> <strong>capital</strong> <strong>efficiency</strong> <strong>market</strong>” , first year,<br />
NO.1 (7-23).<br />
16. Moaddelat, Korosh (1381), The consideration <strong>of</strong> the existence <strong>of</strong> price bubble in in Tehran Stock<br />
Exchange during recently years” , Collection <strong>of</strong> economic researches, NO.20, PP.1-24.<br />
17. Namazi, Mohammad and Zakieh Shoshtarian, “The analysis <strong>of</strong> the <strong>efficiency</strong> <strong>of</strong> Iran Stock Exchange<br />
<strong>market</strong>” financial researches, NO.7&8.<br />
18. Nasrollahi, Zahra (1371), “ Analysis <strong>of</strong> the in Tehran Stock Exchange performance”, M.A thesis in<br />
Economy field, Modarres Tarbiat university.<br />
19. Pettengill, G.N(1989),” Daily Return Correlation: a Reexamination“. Quarterly Journal <strong>of</strong> Business and<br />
Economics, 28(3): 122-191..<br />
20. Sadeghy, Batani, Abdol Hossein, (1384), “ Feasibility study to determine the filter rules in Tehran<br />
Stock Exchange”, M.A thesis, Tehran university, financial management field.<br />
21. Shadkam, Hamed, (1380), “ Refer to average and continuity in stock price and <strong>efficiency</strong> <strong>of</strong> developed<br />
countries <strong>market</strong>”, M.A thesis, Research Institute in programming and developing.<br />
22. Sheng Huang, Y(1995),” The Trading Performance <strong>of</strong> Filter Rrules on Taiwan Stock Exchange“.<br />
Applied Financial Economics, 5: 391-395<br />
23. Sinaie, Hassan Ali (1373), “ The <strong>evaluation</strong> <strong>of</strong> <strong>efficiency</strong> in Tehran Stock Exchange “ financial<br />
researches, first year, NO.2 (46-70).<br />
24. Sweeney, R.J(1988),” Some New Filter Rule Tests: Methods and Results. The Journal <strong>of</strong> Financial and<br />
Quantitative Analysis, 23(3): 285-300.<br />
25. Van Horn J.C. & G.C. Parker(1967),” The Random Walk Theory: an mpirical Test“. Financial Analyst<br />
Journal, 23: 87-92.<br />
26. Watsham, T.J. & Parramore, K. (1997),”Quantitative Methods in Finance“.1st edition. United<br />
Kingdom, London. Thomson Learning.<br />
60


