Population sampling lab - Biology for Life
Population sampling lab - Biology for Life
Population sampling lab - Biology for Life
- No tags were found...

You also want an ePaper? Increase the reach of your titles
YUMPU automatically turns print PDFs into web optimized ePapers that Google loves.
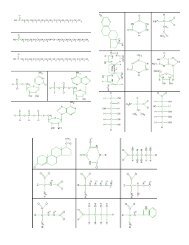
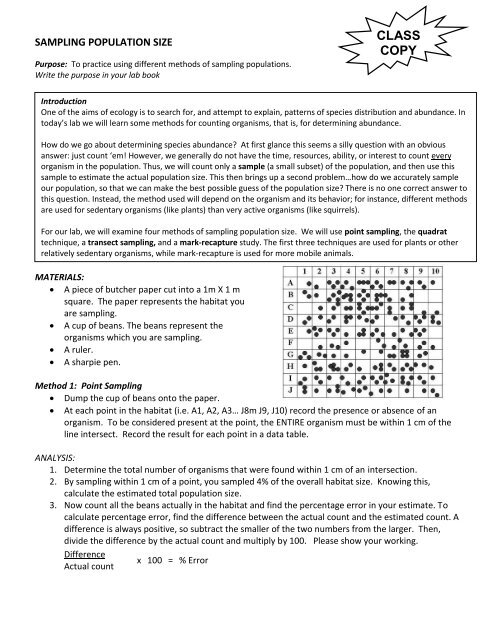
SAMPLING POPULATION SIZEPurpose: To practice using different methods of <strong>sampling</strong> populations.Write the purpose in your <strong>lab</strong> bookCLASSCOPYIntroductionOne of the aims of ecology is to search <strong>for</strong>, and attempt to explain, patterns of species distribution and abundance. Intoday’s <strong>lab</strong> we will learn some methods <strong>for</strong> counting organisms, that is, <strong>for</strong> determining abundance.How do we go about determining species abundance? At first glance this seems a silly question with an obviousanswer: just count ‘em! However, we generally do not have the time, resources, ability, or interest to count everyorganism in the population. Thus, we will count only a sample (a small subset) of the population, and then use thissample to estimate the actual population size. This then brings up a second problem…how do we accurately sampleour population, so that we can make the best possible guess of the population size? There is no one correct answer tothis question. Instead, the method used will depend on the organism and its behavior; <strong>for</strong> instance, different methodsare used <strong>for</strong> sedentary organisms (like plants) than very active organisms (like squirrels).For our <strong>lab</strong>, we will examine four methods of <strong>sampling</strong> population size. We will use point <strong>sampling</strong>, the quadrattechnique, a transect <strong>sampling</strong>, and a mark-recapture study. The first three techniques are used <strong>for</strong> plants or otherrelatively sedentary organisms, while mark-recapture is used <strong>for</strong> more mobile animals.MATERIALS: A piece of butcher paper cut into a 1m X 1 msquare. The paper represents the habitat youare <strong>sampling</strong>. A cup of beans. The beans represent theorganisms which you are <strong>sampling</strong>. A ruler. A sharpie pen.Method 1: Point Sampling Dump the cup of beans onto the paper. At each point in the habitat (i.e. A1, A2, A3… J8m J9, J10) record the presence or absence of anorganism. To be considered present at the point, the ENTIRE organism must be within 1 cm of theline intersect. Record the result <strong>for</strong> each point in a data table.ANALYSIS:1. Determine the total number of organisms that were found within 1 cm of an intersection.2. By <strong>sampling</strong> within 1 cm of a point, you sampled 4% of the overall habitat size. Knowing this,calculate the estimated total population size.3. Now count all the beans actually in the habitat and find the percentage error in your estimate. Tocalculate percentage error, find the difference between the actual count and the estimated count. Adifference is always positive, so subtract the smaller of the two numbers from the larger. Then,divide the difference by the actual count and multiply by 100. Please show your working.Differencex 100 = % ErrorActual count
Method 2: Quadrant Sampling Dump the cup of beans onto the paper. Determine which quadrats you will sample:o Tear a sheet of paper into 20 slips, each approximately 4cm x 4 cm.o Number 10 of the slips from 1 to 10 and put them in a small container.o Label the remaining 10 slips from A through J and put them in a second container.o Randomly remove one slip from each container. Write down the number-letter combinationand find the grid segment that matches the combination.o Place the numbers and letters back into the cups be<strong>for</strong>e picking your next quadrant.o Repeat until you have identified 10 quadrats that you will sample. Count the number of beans in each of the 10 quadrats you are <strong>sampling</strong>. The ENTIRE organismmust be in the quadrant in order <strong>for</strong> it to be recorded. Record the quadrat number-lettercombination and the number of beans in a data table.ANALYSIS:4. Calculate the average population <strong>for</strong> a quadrant.5. Multiply the average by the total number of quadrants (100). This is the population estimate <strong>for</strong> thisarea.6. Now count all the beans actually in the habitat and find the percentage error in your estimate. Tocalculate percentage error, find the difference between the actual count and the estimated count. Adifference is always positive, so subtract the smaller of the two numbers from the larger. Then,divide the difference by the actual count and multiply by 100.Differencex 100 = % ErrorActual count7. In a complete sentence, explain why you drew paper slips, rather than just choosing 10 gridsegments while doing quadrant <strong>sampling</strong>.Method 3: Transect Sampling Dump the cup of beans onto the paper. You will sample the 9 transect lines between each letter on the grid (i.e. the line between A and Bwould be one transect line). For each transect line, record the number of organisms that fall within1 cm of the line. The ENTIRE organism must be within 1 cm of the time in order <strong>for</strong> it to berecorded.ANALYSIS:8. Determine the total number of organisms that were found within 1 cm of a line.9. By <strong>sampling</strong> within 1 cm of a line, you sampled 20% of the overall habitat size. Knowing this,calculate the estimated total population size.10. Now count all the beans actually in the habitat and find the percentage error in your estimate. Tocalculate percentage error, find the difference between the actual count and the estimated count. Adifference is always positive, so subtract the smaller of the two numbers from the larger. Then,divide the difference by the actual count and multiply by 100. Please show your working.Differencex 100 = % ErrorActual count
Method 4: Mark-Recapture Sampling Dump the cup of beans onto the paper. Have one group member close their eyes and “trap” the beans by placing their hand over a randomsection of the habitat. Count the number of trapped beans. This is your first trapping sample (M). Record your answer in adata table. Mark these beans with a sharpie. Return ALL bean to the cup (marked and unmarked). Shake the cup. Dump the cup of beans onto the paper. Without looking, grab another handful of beans. This represents your second trapping sample (n).Count them and record your answer in your data table. How many of the beans in your second trapping sample were already marked? This is your (R) value.Count them and record your answer. Return this trapping sample (white and red) to the cup. Count the actual number of beans in your sack. Record this number.ANALYSIS:11. Use the Lincoln-Petersen index to calculate population size:N = (n M) / R12. where N = estimated total population size, M = the number of individuals caught and marked in theinitial catch, n = the total number of individuals caught in the second catch, and R = the number ofmarked individuals caught in the second catch. Be sure to show your work!!13. Find the percentage error in your estimate. To calculate percentage error, find the differencebetween the actual count and the estimated count. A difference is always positive, so subtract thesmaller of the two numbers from the larger. Then, divide the difference by the actual count andmultiply by 100.Differencex 100 = % ErrorActual countOVERALL ANALYSIS14. Which method was most accurate in estimating the population size? Why?15. In general, explain what changes could you make to a <strong>sampling</strong> procedure to reduce yourpercentage error?16. Which method(s) would work best <strong>for</strong> <strong>sampling</strong> plant populations? Why?17. Which method(s) would work best <strong>for</strong> <strong>sampling</strong> animal populations? Why?