Determination of Planck's constant using LEDs
Determination of Planck's constant using LEDs
Determination of Planck's constant using LEDs
- No tags were found...

Create successful ePaper yourself
Turn your PDF publications into a flip-book with our unique Google optimized e-Paper software.
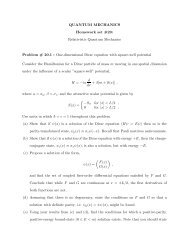
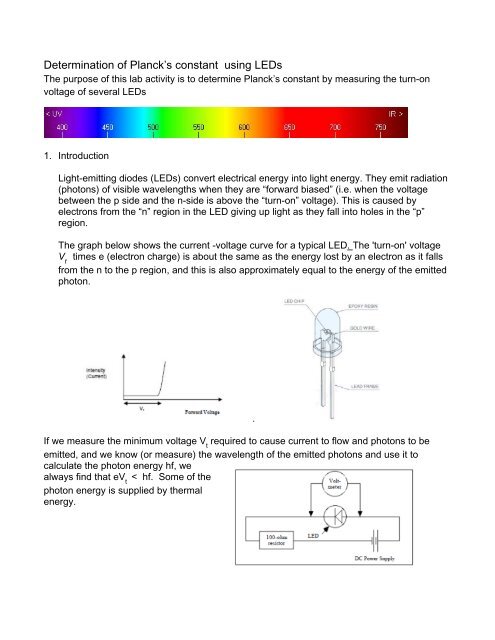
<strong>Determination</strong> <strong>of</strong> Planck’s <strong>constant</strong> <strong>using</strong> <strong>LEDs</strong>The purpose <strong>of</strong> this lab activity is to determine Planck’s <strong>constant</strong> by measuring the turn-onvoltage <strong>of</strong> several <strong>LEDs</strong>1. IntroductionLight-emitting diodes (<strong>LEDs</strong>) convert electrical energy into light energy. They emit radiation(photons) <strong>of</strong> visible wavelengths when they are “forward biased” (i.e. when the voltagebetween the p side and the n-side is above the “turn-on” voltage). This is caused byelectrons from the “n” region in the LED giving up light as they fall into holes in the “p”region.The graph below shows the current -voltage curve for a typical LED. The 'turn-on' voltageV ttimes e (electron charge) is about the same as the energy lost by an electron as it fallsfrom the n to the p region, and this is also approximately equal to the energy <strong>of</strong> the emittedphoton.If we measure the minimum voltage V trequired to cause current to flow and photons to beemitted, and we know (or measure) the wavelength <strong>of</strong> the emitted photons and use it tocalculate the photon energy hf, wealways find that eV t< hf. Some <strong>of</strong> thephoton energy is supplied by thermalenergy..
spreadsheet and type =slope(y‐value range, x‐value range). This will put theslope <strong>of</strong> the line into the cell. You can also get h directly, typing=slope(y‐value range, x‐value range) Similarly you could also get the interceptby typing “= intercept(y‐value range, x‐value range)”Explanation about average, standard deviation, uncertainties:(1) if you repeat measurements <strong>of</strong> the same quantity several times, in general you will seethat the results vary from one attempt to the other; this is due to measurement errors.Repetition <strong>of</strong> measurements can be used to get a more precise estimate <strong>of</strong> the “truevalue” and also give information about the measurement precision.(2) if you have N measurements Xi (i=1,2,…N) <strong>of</strong> some quantity X, the average value isgiven byX1 N XiN i 1 (this means: sum all the values Xi, i.e. take X 1 + X 2 +….+X N , and then divide by the totalnumber <strong>of</strong> measurements, N).(3) the “standard deviation” is a quantity which provides an estimate for the precision withwhich you determined your best estimate <strong>of</strong> X. The square <strong>of</strong> the standard deviation(also called the “sample variance”) is given byN2 12X ( Xi X ) ,N 1i1i.e. to calculate it, you take the sum <strong>of</strong> the squares <strong>of</strong> the deviations between theindividual measurements Xi and the average, and then divide by (N‐1). The standarddeviation (sometimes also called the “root‐mean‐squared deviation”) is then given byN12the square root <strong>of</strong> this: X ( XiX) .N 1i1In Excel, you can get the standard deviation by <strong>using</strong> the function STDEV(data range).(4) You can also try to estimate your measurement precision by making an educatedguess (“guesstimate”) <strong>of</strong> how precisely you know the voltage and the frequency . LetV Vbe the uncertainty (“error”, “imprecision”) <strong>of</strong> your measurement <strong>of</strong> the turn-onvoltage V t , and f the uncertainty <strong>of</strong> the frequency, then the “relative uncertainty” hhhh <strong>of</strong> h determined from this is:fh h V V ( ) ( )h h V V f2 f 2