Introductory Slides for R - Statistics
Introductory Slides for R - Statistics
Introductory Slides for R - Statistics
- No tags were found...

You also want an ePaper? Increase the reach of your titles
YUMPU automatically turns print PDFs into web optimized ePapers that Google loves.
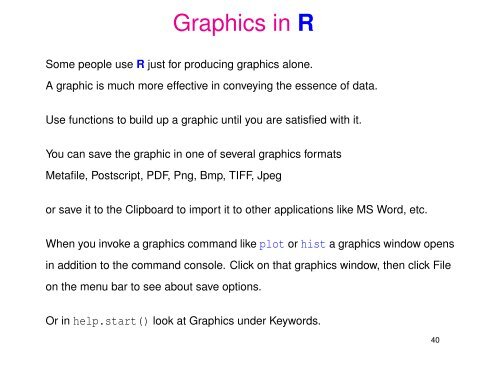
Graphics in RSome people use R just <strong>for</strong> producing graphics alone.A graphic is much more effective in conveying the essence of data.Use functions to build up a graphic until you are satisfied with it.You can save the graphic in one of several graphics <strong>for</strong>matsMetafile, Postscript, PDF, Png, Bmp, TIFF, Jpegor save it to the Clipboard to import it to other applications like MS Word, etc.When you invoke a graphics command like plot or hist a graphics window opensin addition to the command console. Click on that graphics window, then click Fileon the menu bar to see about save options.Or in help.start() look at Graphics under Keywords.40