Identifying International Networks: Latent Spaces and Imputation ...
Identifying International Networks: Latent Spaces and Imputation ...
Identifying International Networks: Latent Spaces and Imputation ...

You also want an ePaper? Increase the reach of your titles
YUMPU automatically turns print PDFs into web optimized ePapers that Google loves.
<strong>Identifying</strong> <strong>International</strong> <strong>Networks</strong>:<strong>Latent</strong> <strong>Spaces</strong> <strong>and</strong> <strong>Imputation</strong>Michael D. Ward Peter D. Hoff 1Political ScienceStatisticsUniversity of Washington University of WashingtonSeattle, Washington Seattle, Washington9819598195IntroductionCorey Lowell LofdahlSimulation & InformationTechnology OperationsSAICBurlington, MA 01803Most analyses of world politics <strong>and</strong> studies of national security policies recognize the interdependenceamong the salient actors across the salient issues. Traditionally, internationalpolitics has been defined as the scope <strong>and</strong> extent of the relations among independent countries,thought to be the most important elements in world politics. This means that actorsas well as their actions are strategically interdependent (Signorino 1999). Ignoring the interdependenceamong these phenomena would appear to be a serious oversight that plagueattempts to underst<strong>and</strong>, let alone predict, the course of national security policy <strong>and</strong> worldpolitics more generally. With very few exceptions, quantitative, systematic studies of internationalrelations <strong>and</strong> national security have assumed that the major actors <strong>and</strong> actionsthat comprise world politics consist of unconnected actions <strong>and</strong> actors. Game theoreticmodels are legion, but rarely deal with more than two actors at a time. Some beginningattempts to model the interdependency in international relations have appeared in the literature(Ward <strong>and</strong> Kirby 1987; Gleditsch <strong>and</strong> Ward 2001; Gleditsch <strong>and</strong> Ward 2001; Ward<strong>and</strong> Gleditsch 2002; Gleditsch 2002; Lofdahl 2002), but as yet network models have yetbe widely applied in scholarly or policy work on international politics. This is somewhatsurprising, since it is evident at first blush that international politics is about the interdependencethat appears around the world.Social network analysis is one technique that has been developed to map <strong>and</strong> measurethe relationships <strong>and</strong> flows among agents. The nodes in the network are the individuals<strong>and</strong> groups <strong>and</strong> the links among them illustrate their interdependencies, both in termsof structure <strong>and</strong> in terms of the flows of information from one node to others. Sincethe development of the sociogram (Moreno 1934), sociologists among others have beeninterested in analyzing the linkages among individuals <strong>and</strong> groups. An interesting earlyexample is found in the early work of Coleman, Katz <strong>and</strong> Menzel (1957). Most earlytheoretical advances were based on graph theory as developed <strong>and</strong> advanced by FrankHarary <strong>and</strong> his students <strong>and</strong> collaborators (Harary 1959; Harary 1969; Harary, Norman<strong>and</strong> Cartwright 1965). The so-called “Columbia school” worked throughout the 1960s <strong>and</strong>beyond to further advance the substantive findings in this arena of sociology (White 1963;White, Boorman <strong>and</strong> Breiger 1976). Broader dissemination of these ideas came much morerecently with didactic writings (Knoke <strong>and</strong> Kuklinski 1982; Scott 1991) as well as early1 Peter Hoff’s research is supported by Office of Naval Research grant N00014-02-1-1011.1
applications that are by now canonical (Padgett <strong>and</strong> Ansell 1993; Hansell 1983). Indeed,social network analysis has become even more fashionable as outside of sociology in technicalfields, <strong>and</strong> has spread to the wider press as an important method for underst<strong>and</strong>ing anincreasingly perplexing <strong>and</strong> complicated social environment (Garreau 2001). However, itis somewhat ironic that to date there are no published applications of network analysis tothe study of international relations. 2Hoff, Raftery <strong>and</strong> H<strong>and</strong>cock (2002 in press) developed probabilistic models of linksamong actors based on latent positions of actors in an unobserved “social space.” We applysuch a model a large database on international relations that is typical for the national security<strong>and</strong> international politics literatures, <strong>and</strong> discuss making predictive inference on linksthat are missing at r<strong>and</strong>om. In particular, we analyze the interactions among importantsocial actors in Central Asia, using data taken from the Kansas Event Data Survey an automatedtextually oriented data generating process (Schrodt, Davis <strong>and</strong> Weddle 1994; Gerner,Schrodt, Francisco <strong>and</strong> Weddle 1994), specifically the CASIA database, available from theKEDS Web site at http://www.ku.edu/ keds/data.html. This database captures the dailyebb <strong>and</strong> flow of cooperative <strong>and</strong> conflictual events among important political <strong>and</strong> economicagents (typically called “actors” in the international relations literature) in the CentralAsian region.Our main purpose is to illustrate the value in using a latent space approach to underst<strong>and</strong>ingnetwork structure in an applied, international relations context.Event Data on <strong>International</strong> Relations among CentralAsian CountriesEvent data are nominal or ordinal codings of the recorded interactions of internationalactors. 3 Berelson (1952) introduced the concept of content analysis to the social sciences,but it was North, Holsti, Zaninovich <strong>and</strong> Zinnes (1963) that pioneered its use in studies ofworld politics . Event data have been widely used in quantitative international relationsresearch <strong>and</strong> in policy research for four decades, following their introduction, event datain international relations were widely used (North 1967; McClell<strong>and</strong> <strong>and</strong> Hoggard 1969;Azar 1980). Until the development of machine coding the World Event Interaction Survey(WEIS) <strong>and</strong> Conflict on Peace Databank (COPDAB) were the two dominant schema. Thecontemporary, state-of-the-art is found in the Kansas Event Data System (KEDS) whichuses automated coding of English-language news reports to generate political event data(Schrodt 2000; Schrodt, Davis <strong>and</strong> Weddle 1994).According to Schrodt, there are three major steps involved in creating event data.2 Steven J. Brams (1966; 1968) <strong>and</strong> later Schofield (1972) tried to estimate linkages among countries, butthis line of research was not pursued. Some work with elementary graph theory in the field of internationalrelations has appeared more recently (Lai 1995), but like most of the early work, this applies to a smallnumber of actors, typically three.3 This section is taken <strong>and</strong> adapted with permission from the KEDS Web site athttp://www.ku.edu/ keds/intro.html.2
1. First, a source of news is identified. Typically a news summary is used, ideally onethat is already available in a machine readable format. The two current de factopublically available st<strong>and</strong>ards are the Reuters news service lead paragraphs or theForeign Broadcast Information Service (FBIS) 42. Second, a coding system is developed, or one of the extant coding systems such asthe World Events Interaction Survey (aka WEIS), the Conflict <strong>and</strong> Peace Data Bank(COPDAB), or CAMEO (a KEDS coding schema (Gerner, Schrodt, Ömür Yilmaz<strong>and</strong> Abu-Jabr 2002)) is chosen. This coding system must specify what types ofinteractions constitute an “event.” This requires the specification of which actorswill be coded, for example, whether nonstate actors such as NATO <strong>and</strong> the UnitedNations or guerilla movements or salient individuals will be included. At the sametime the coding rules must specify what basic issue areas will be included. TheCOPDAB data set includes a general “issue area” which describes whether an actionis primarily military, economic, diplomatic or one of five other types of relationship.In contrast, WEIS also had a few specific “issue arenas” such as the Vietnam War,Arab- Israeli conflict, <strong>and</strong> SALT negotiations.3. The coding rules themselves may be developed in terms of a manual that is givento human coders or more frequently is encapsulated in a computer program such asKEDS, which uses extensive dictionaries to identify actors <strong>and</strong> events <strong>and</strong> associatethese with specific numerical codes. These dictionaries are developed theoretically byspecification <strong>and</strong> tuned practically by coding a large number of test sentences fromthe actual data <strong>and</strong> adding the appropriate vocabulary when the machines makes anobserved error.Table 1 shows a sample of the lead sentences of reports on the Reuters newswire thatpreceded Iraq’s invasion of Kuwait in August 1990. Generally each lead corresponds toa single event, though some sentences generate multiple events. For example, the leadsentence for July 23, 1990 is “Iraqi newspapers denounced Kuwait’s foreign minister asa U.S. agent Monday.” This corresponds to WEIS category 122, defined as “Denounce;denigrate; abuse”. In this event, Iraq is the source (actor) of the action <strong>and</strong> Kuwait is thetarget. Together, these generate the event record that corresponds to an event in whichIraq denounces Kuwait. 5The WEIS codes <strong>and</strong> associated Goldstein (1992) weights are given in 2 for some ofthe WEIS categories. Goldstein scores are psychometrically determined weights, where apositive weight means that the event has positive affect; conversely, a negative Goldsteinscore indicates negative affect.Table 3 shows the Reuters stories converted to WEIS events. Event data analysis relieson a large number of events to produce meaningful patterns of interaction. The information4 FBIS is available at http://199.221.15.211/, while Reuters can be contacted via www.reuters.com.5 This gives “900723 IRQ KUW 122” where “900723” is the date of the event, IRQ is a st<strong>and</strong>ard codefor Iraq, KUW is the code for Kuwait, <strong>and</strong> 122 is the WEIS category.3
Table 1: Reuters Chronology of 1990 Iraq-Kuwait Crisis, adapted from Schrodt(http://www.ku.edu/ keds/intro.html), with permission. The Iraqi denunciation of Kuwation July 23, 1990 is a typical conflict event.Date Headline Lead SentenceJuly 17, 1990RESURGENT IRAQ SENDS SHOCKWAVES THROUGH GULF ARABSTATESJuly 23, 1990 IRAQ STEPS UP GULF CRISISWITH ATTACK ON KUWAITI MIN-ISTERJuly 24, 1990July 24, 1990July 25, 1990IRAQ WANTS GULF ARAB AIDDONORS TO WRITE OFF WARCREDITSIRAQ, TROOPS MASSED IN GULF,DEMANDS $25 OPEC OIL PRICEIRAQ TELLS EGYPT IT WILL NOTATTACK KUWAITJuly 27, 1990 IRAQ WARNS IT WON’T BACKDOWN IN TALKS WITH KUWAITJuly 31, 1990IRAQ INCREASES TROOP LEVELSON KUWAIT BORDERAugust 1, 1990 CRISIS TALKS IN JEDDAH BE-TWEEN IRAQ AND KUWAIT COL-LAPSEAugust 2, 1990 IRAQ INVADES KUWAIT, OILPRICES SOAR AS WAR HITSPERSIAN GULFIraq President Saddam Husseinlaunched an attack on Kuwait <strong>and</strong> theUnited Arab Emirates (UAE) Tuesday,charging they had conspired withthe United States to depress world oilprices through overproduction.Iraqi newspapers denounced Kuwait’sforeign minister as a U.S. agent Monday,pouring oil on the flames of a PersianGulf crisis Arab leaders are strugglingto stifle with a flurry of diplomacy.(I.e., Iraq Denounces Kuwait.)Debt-burdened Iraq’s conflict withKuwait is partly aimed at persuadingGulf Arab creditors to write off billionsof dollars lent during the war withIran, Gulf-based bankers <strong>and</strong> diplomatssaid.Iraq’s oil minister hit the OPEC cartelTuesday with a dem<strong>and</strong> that it mustchoke supplies until petroleum pricessoar to $25 a barrel.Iraq has given Egypt assurances thatit would not attack Kuwait in theircurrent dispute over oil <strong>and</strong> territory,Arab diplomats said Wednesday.Iraq made clear Friday it would takean uncompromising st<strong>and</strong> at conciliationtalks with Kuwait, saying its PersianGulf neighbor must respond toBaghdad’s “legitimate rights” <strong>and</strong> repairthe economic damage it caused.Iraq has concentrated nearly 100,000troops close to the Kuwaiti border,more than triple the number reporteda week ago, the Washington Post saidin its Tuesday editions.Talks on defusing an explosive crisisin the Gulf collapsed Wednesdaywhen Kuwait refused to give in to Iraqidem<strong>and</strong>s for money <strong>and</strong> territory, aKuwaiti official said.Iraq invaded Kuwait, ousted its leaders<strong>and</strong> set up a pro-Baghdad governmentThursday in a lightning pre-dawnstrike that sent oil prices soaring <strong>and</strong>world leaders scrambling to douse theflames of war in the strategic PersianGulf.4
Table 2: Selected WEIS action categories <strong>and</strong> Goldstein Scores.Yield (1.0) Surrender (0.6) Retreat (0.6)Retract (2.0) Accommodate, Cease Fire (3.0) Cede Power (5.0)Comment (0.0) Decline Comment (-0.1) Pessimist Comment (-0.4)Neutral Comment (-0.2) Optimist Comment (0.4) Explain Position (0.0)Consult (1.0) Meet (1.0) Visit (1.9)Receive (2.8) Vote, Elect (1.0) Approve (3.5)Praise (3.4) Endorse (3.6) Rally (3.8)...Kidnap, Jail (-2.5) Spy (-5.0)Non-MilitaryForce (-9.0)Non-Injury Destruction (-8.3)Destruction (-8.7) Military Engagement (-10.0)AssassinateTortureRiot, Violent Clash (-7.0)Execute (-9.0) Coup Attempted (-8.0)provided by any single event is very limited; single events are also affected by erroneousreports <strong>and</strong> coding errors. However, important events trigger other interactions throughoutthe system. For example while Iraq’s invasion of Kuwait by itself generates only a singleevent with WEIS code 223–military force–the invasion triggers an avalanche of additionalactivity throughout the international system as states <strong>and</strong> international organizations denounce,approve or comment, so the crisis is very prominent in the event record. This kindof implicit triggering is analyzed <strong>and</strong> described in Schrodt <strong>and</strong> Mintz (1988) <strong>and</strong> Ward <strong>and</strong>House (1988).Table 3: Coding of the 1990 Iraq-Kuwait Crisis, using WEIS coding scheme. These eventsappear in textual format in Table 1, above.Date Actor Target WEIS Action Code Type of Action900717 IRQ KUW 121 CHARGE900717 IRQ UAE 121 CHARGE900723 IRQ KUW 122 DENOUNCE900724 IRQ ARB 150 DEMAND900724 IRQ OPC 150 DEMAND900725 IRQ EGY 054 ASSURE900727 IRQ KUW 160 WARN900731 IRQ KUW 182 MOBILIZATION900801 KUW IRQ 112 REFUSE900802 IRQ KUW 223 MILITARY FORCEData generated in this fashion are exactly the same kind of data that are used to repre-5
sent social networks. Yet, to date, despite the widespread use of such data in internationalrelations, there are no published studies which analyze these kind of data from a socialnetwork perspective. We turn to the application of latent space analysis of social networksusing these data in the following sections.<strong>Latent</strong> Space Models of Network StructuresLet y i,j denote the value of a relationship between agent i <strong>and</strong> agent j; these relationshipsmay be measured discretely or continuously. The matrix Y is variously called a transactionmatrix, a sociomatrix, or a spatial weights matrix. Let X comprise observed characteristics(co-variates) that can be specific to the agents i or j, or specific to their interaction i, j. 6The observed network is assumed to be a function of all relevant co-variates, observedor not observed. The presence of important non-observed co-variates often leads to dependenciesin the network Y . The models of (Hoff, Raftery <strong>and</strong> H<strong>and</strong>cock 2002 in press)assume the dependencies in the data can be represented via a latent, unrealized positionor characteristic z i for each node i, <strong>and</strong> that the network responses are conditionally independentgiven the set of latent positions. Given this assumption, we can express theprobability of the given network conditional on the latent positions of the agents <strong>and</strong> theircharacteristics asP (Y |Z, X, θ) = ∏ i≠jP (y i,j |z i , z j , x i,j , θ, σ 2 ). (1)Unconditional on the z i ’s, the data are dependent.If the data are binary, Equation (1) can be parameterized as a logistic regression modelin which the probability of linkage depends on some projected closeness between the agents(z i <strong>and</strong> z j ) <strong>and</strong> covariates such that:η i,j = log odds(y i,j = 1|z i , z j , x i,j , α, β, σ 2 ) = α + β ′ x i,j + z i′z j , (2)where z i <strong>and</strong> z j represent the projected positions of actors i <strong>and</strong> j in the latent space.Suppose that each actor i has an associated vector z i of characteristics. Each vector can bethought of as comprising a position on a k-dimensional sphere of unit radius (the directionof the z i ), as well as an “activity level” (the length of z i ). In the model above, agents i <strong>and</strong>j are more likely to have linkages if they have simliar locations on the sphere, <strong>and</strong> they are“active,” that is, if z iz ′ j is large <strong>and</strong> positive.This leads to a (log) probability of the sociomatrix specified as:logP (Y |η) = ∑ i≠j(y i,j (α + β ′ x i,j + z i′z j ) − log(1 + e (α+β′ x i,j +z i′zj ) )). (3)6 Most of the notation (but not necessarily the terminology) herein follows (Hoff, Raftery <strong>and</strong> H<strong>and</strong>cock2002 in press).6
Maximum likelihood <strong>and</strong> Bayesian estimates for the parameters in this model can be obtainedin a straightforward way. First, the maximum likelihood estimates of the parametersare formed by direct maximization of Equation (3). Then, with this estimate as a startingvalue <strong>and</strong> with diffuse prior distributions over the model parameters, a Markov chain isconstructed to generate samples of the parameters from the posterior distribution. Sucha sample is generated by drawing proposal values from a symmetric proposal distribution,<strong>and</strong> accepting the proposal with an appropriate probability. For example, in sampling anew Z value at the kth stage of the chain, we sample a proposal value ˘Z from a proposaldistribution J(Z|Z k ), where Z k is the most recently sampled value. The proposal is acceptedas the new value Z k+1 with probability p(Y | ˘Z,α k ,β k ,σk 2,X)π( ˘Z)p(Y |Z,α k ,β k ,σk 2,X) π(Z k, where π(Z) is the prior)distribution for Z. If the proposal is not accepted, then Z k+1 is set equal to Z k . Thisapproach has been used by Hoff, Raftery <strong>and</strong> H<strong>and</strong>cock (2002 in press) to estimate severalof the classic social network analysis data sets. 7 The basic setup is quite general <strong>and</strong> canbe even more widely employed.Estimation of Network Links in CASIA databaseWe use this framework to estimate the network structure of the political interactions ofthe primary actors in Central Asian politics over the period from 1989 through 1999. Thisregion has a great deal of conflict <strong>and</strong> spotty coverage in English language media, despiteits contemporary salience. Based on the CASIA database, there are 113 such actors whichhave been deemed by substantive experts to be significant. Of these, there are 51 countrylevel actors that have interactions with one another during this eleven year period. Wesum the paired interactions among these 51 countries across the eleven year period. A linkis deemed to occur for any interaction between two countries during this period. Thus, ourdata is a 51 × 51 sociomatrix in which an entry is 1 if <strong>and</strong> only if there is an interactionbetween i <strong>and</strong> j in the CASIA database between 1989 <strong>and</strong> 1999; otherwise it is 0. We usea single covariate for this analysis: x i,j is the distance in thous<strong>and</strong>s of kilometers betweenthe capital city of each of the countries. Distance is widely employed as an indicator ofinteraction in international relations: countries closer together have higher probabilities ofhaving linkages.We have glossed over the important content of the interactions. Some will have beencooperative <strong>and</strong> others highly conflictual. There are many debates in the national securityliterature about reciprocity. It turns out that countries that have high levels of cooperativeinteractions also tend to have high levels of conflictual interactions. So this seems a reasonableapproximation, though it is certainly possible to disaggregate these data by eventtype, issues, <strong>and</strong> time.Treating all years in one aggregation is not optimal perhaps, but it does reduce considerablythe sparseness of the data. We also recognize that some pairs of countries will have7 These are the drosophila melanogaster of social network analysis, the so-called Monk data (Sampson1968), as well as data on Florentine marriage patterns among Medici families (Padgett <strong>and</strong> Ansell 1993),<strong>and</strong> data on classroom friendship networks (Hansell 1983).7
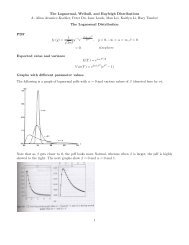
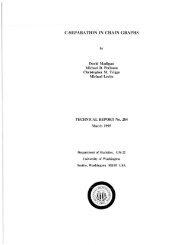
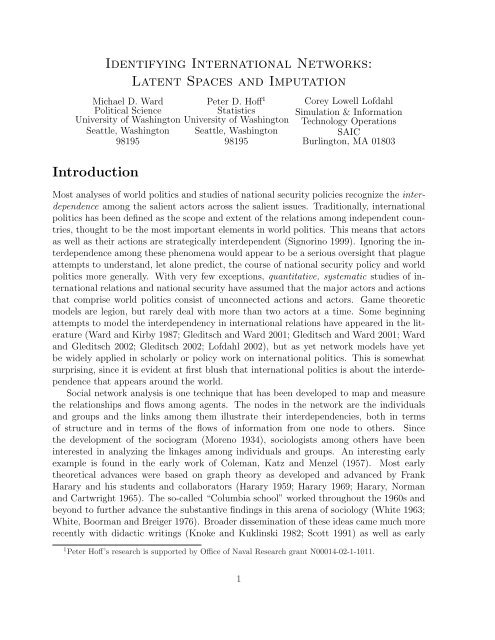
many more interactions. Examination of the histograms of the actual data suggested to usthat most of the information about the linkages was captured in the dichotomy; most ofthe responses were zero <strong>and</strong> the second most likely value was 1.Equation 3 was estimated using direct optimization of the maximum likelihood to generatestarting values for the MCMC. One million iterations of the chain were run to obtainestimates of the parameters α <strong>and</strong> β as well as the latent positions Z <strong>and</strong> their underlyingvariance σ 2 . The negative coefficient for the distance covariate indicates a lower probabilityof interaction at greater distances, consistent with many published results from differentcontexts. These estimates are presented in Table 4.Table 4: Maximum Likelihood <strong>and</strong> MCMC estimates of parameters for the sociogram of the51 countries involved in Central Asian politics over the period from 1989-1999. Quantilebased confidence intervals are provided for the MCMC estimates.95% ConfidenceIntervalParameter MLE MCMC 2.5% 97.5%α -4.32 -4.20 -4.69 -3.06β -0.26 -0.25 -0.40 -0.21σ 2 5.82 4.48 10.53Figure 1 illustrates the trajectories of the log likelihood <strong>and</strong> the parameters ˆα, ˆβ, <strong>and</strong> ˆσ 2over the 10 6 scans of the Markov chain. These plots suggest that the chain mixes reasonablywell for all the estimated parameters. The density of these estimated distributions areFigure 1: MCMC Diagnostic plots of parameter estimation via 10 6 scans of Markov Chain.−470 −460 −450 −440 −4300 500 1000 1500 2000(a) MCMC L4 6 8 100 500 1000 1500 2000−5.5 −5.0 −4.5 −4.0(b) ˆσ 2 (c) ˆα0 500 1000 1500 2000−0.50 −0.45 −0.400 500 1000 1500 2000(d) ˆβpresented in Figure 2. These represent the marginal posterior densities, with vertical linesrepresenting the maximum likelihood estimate. Each of these densities presents a fairlynarrow b<strong>and</strong>width.8
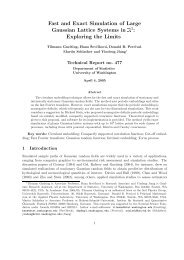
Figure 2: Marginal Posterior Densities of the Estimated Parameters. Vertical lines presentthe MLE.Density0.00 0.05 0.10 0.15 0.20 0.25 0.30Density0.0 0.2 0.4 0.6 0.8 1.0Density0 2 4 6 82 4 6 8 10 12 14 16N = 2000 B<strong>and</strong>width = 0.2822−6 −5 −4 −3 −2N = 2000 B<strong>and</strong>width = 0.08126−0.5 −0.4 −0.3 −0.2N = 2000 B<strong>and</strong>width = 0.00984(a) ˆσ(b) ˆα(c) ˆβAs interesting as these estimates <strong>and</strong> diagnostics are, the most interesting output of alatent space analysis is the position of the actors in the latent space. Figure 3 illustratesthese positions for the 51 countries analyzed. Figure 4 displays the relative, latent positionsof countries projected onto a circle. Countries that are close together on this circle havehigher probability of sharing a link. Since this set of countries shares many ties, manycountries are close to one another in latent space.<strong>Imputation</strong> of Missing Network Linkages in CASIAGauging whether a network is completely sampled is perhaps the holy grail of networkanalysis. As yet there is no simple solution to this perplexing problem. We offer nocomplete solution here. However, practically, it may be useful to use imputation methodsalong with the latent space estimates to gauge whether or not a link that does not turn upactually may be missing at r<strong>and</strong>om.We conduct an experiment using the CASIA database through the following procedure:1. R<strong>and</strong>omly assign NA to 100 y i,j ’s , keeping track of the 100 actual values of these“missing” data;2. Fit the model using the non missing data;3. For each missing y i,j , use the parameter estimates to the calculate predicted probabilityˆp i,j that each missing value y i,j equals one, i.e. is a hidden links;4. Compute the number of correct <strong>and</strong> incorrect predictions, using as a first cut a 0.5threshold;9
<strong>Latent</strong> Dimension 2-2 0 2 4 6 8SingaporeSri LankaKoreaUnited StatesAfghanistanPakistanGermanySwitzerl<strong>and</strong>CambodiaPR ChinaUnited Arab EmiratesIranIndia RussiaSouth KuwaitAfricaCubaSaudi Israel ArabiaKenyaNorway TanzaniaCzechGhana LibyaLebanon Republic QatarYemen Sudan EgyptYugoslaviaNetherl<strong>and</strong>s United KingdomRomaniaBelgiumCanada Italy IraqNorth KoreaIndonesiaPeruAustriaMaliJapanCyprus Angola AustraliaPortugal France-3 -2 -1 0 1 2 3<strong>Latent</strong> Dimension 1Figure 3: The <strong>Latent</strong> Positions of 51 Countries as a function of their interactions inCentral Asia. The United States has links to many of the other countries, as do Pakistan,Afghanistan, China, Russia, <strong>and</strong> India.5. Compute the Brier score (Brier 1950): (n(n − 1)) ∑ −1 i≠j ( pˆi,j − y i,j ) 2 .6. Repeat the above steps 200 times; <strong>and</strong> finally,7. Compare these results to a st<strong>and</strong>ard, logistic framework with the same covariates.The results of this experiment are quite supportive of using latent space to predictnon-sampled or hidden network linkages. For the 200 runs, the average Brier score was0.087, which is quite low. The proportion of correctly predicted observations was 0.88.The original sociomatrix has about four non-links for every link. This means that a modalguess of 0 would result in correctly predicting about 0.80 of the observations. Thus, thelatent space approach improves significantly upon that result, garnering an additional 8 ofthe remaining 20 percent. Specifically, conditional on the true value being no linkage, thepredicted value is 0 with probability of 0.95. Given that the true value is 1 (i.e., linkage),the predicted value is 1 with probability of 0.67.10
SingaporeSriLankaKoreaUnited Arab EmiratesQatarIndiaPR ChinaKuwaitCzech RepublicIran UnitedLebanonStatesSouth Africa IsraelKenyaSaudiArabiaPeruLibyaTanzania RussiaGhanaEgyptUnited KingdomMaliItalyYugoslaviaAfghanistanPakistanIraq Yemen SudanCubaNorth KoreaNetherl<strong>and</strong>sFranceIndonesiaCanadaRomania AustraliaAngola Japan NorwayPortugal AustriaGermanyCyprusBelgiumSwitzerl<strong>and</strong>CambodiaSenegalFigure 4: The latent positions of countries is projected on a unit circle. Because many ofthe positions are very close to one another, the positions have been loosely jittered so thatthe overlap of country labels is reduced.In comparison, a logistic model using the same geographic covariate, the average Brierscore is almost twice as high (0.17); higher Brier scores indicate poorer predictive performance.A logistic model, as is typical of this approach, will correctly predict all the zeros<strong>and</strong> none of the links, because it, like the modal guess, always predicts 0.The upshot of this experiment is the important implication that if we sample networkties at r<strong>and</strong>om, then estimate the latent positions, this approach can be used to predict they i,j that were not sampled.Although quantitative models in international relations that make actual predictionsare themselves rare (Schrodt 2000; King <strong>and</strong> Zeng 2001; Ward <strong>and</strong> Gleditsch 2002) for avariety of reasons (Schrodt 2002), these results are strong in comparison. More broadlythis approach identifies an effective way to sample networks.11
ConclusionThe latent space approach to social network analysis seems promising. It performs quitewell in identifying observed, complete networks in the national security realm. It does so ina way that embraces the interdependence of the network data, rather than assuming thatit is generated r<strong>and</strong>omly. Moreover, the approach facilitates the presentation of networkpositions in an intuitively satisfying way, mapped into a small number of dimensions. Theselocations incorporate measures of uncertainty. Perhaps most importantly this approach isquite general, since it encapsulates a broader class of models. Specifically, a variety ofdiscrete <strong>and</strong> continuous specifications can easily be adapted, depending upon the datagenerating process. Finally, our experiments on using the latent space positions to imputemissing at r<strong>and</strong>om network links proved to be remarkably productive, especially given theabsence of any substantive covariates. This leads to the exciting result that it may bepossible to use this approach to sample network ties at r<strong>and</strong>om, then estimate the latentpositions in order to predict network ties that were not initially sampled.ReferencesAzar, Edward. 1980. “The Conflict <strong>and</strong> Peace Data Bank (COPDAB) Project.” Journalof Conflict Resolution 24:143–152.Berelson, Bernard. 1952. Content Analysis in Communication Research. Glencoe, IL: FreePress.Brams, Steven J. 1966. “Transaction Flows in the <strong>International</strong> System.” American PoliticalScience Review 60:880–898.Brams, Steven J. 1968. “DECOMP: A Computer Program for the Condensation of aDirected Graph <strong>and</strong> the Hierarchical Ordering of Its Strong Components.” BehavioralScience 13:344–345.Brier, G.W. 1950. “Verification of forecasts expressed in terms of probabilities.” BulletinAmerican Meteorological Society 78:1–3.Coleman, James S., Elihu Katz <strong>and</strong> Herbert Menzel. 1957. “The Diffusion of an innovationamong physicians.” Sociometry 20:253–70.Garreau, Joel. 2001. “Disconnect the Dots: Maybe We Can’t Cut Off Terror’s Head, butWe Can Take Out Its Nodes.” Washington Post September 17:C–01.Gerner, Deborah J., Philip A. Schrodt, Ömür Yilmaz <strong>and</strong> Rajaa Abu-Jabr. 2002. Conflict<strong>and</strong> Mediation Event Observations (CAMEO): A New Event Data Framework for aPost Cold War World. Annual Meetings of the American Political Science AssociationBoston, MA: .12
Gerner, Deborah J., Philip A. Schrodt, Ronald Francisco <strong>and</strong> Judith L. Weddle. 1994.“The Analysis of Political Events using Machine Coded Data.” <strong>International</strong> StudiesQuarterly 38:91–119.Gleditsch, Kristian S. <strong>and</strong> Michael D. Ward. 2001. “Measuring Space: A Minimum DistanceDatabase <strong>and</strong> Applications to <strong>International</strong> Studies.” Journal of Peace Research38(6):749–768.Gleditsch, Kristian Skrede. 2002. All <strong>International</strong> Politics is Local: The Diffusion ofConflict, Integration, <strong>and</strong> Democratization. Ann Arbor, MI: University of MichiganPress.Goldstein, Joshua. 1992. “A Conflict-Cooperation Scale for WEIS <strong>International</strong> EventsData.” Journal of Conflict Resolution 36(2):369–385.Hansell, Stephen. 1983. “Cooperative Groups, Weak Ties, <strong>and</strong> the Integration of PeerFriendships.” Social Psychology Quarterly 47(4):316–328.Harary, Frank. 1959. “Graph theoretic methods in the management sciences.” ManagementScience 5:387–403.Harary, Frank. 1969. Graph Theory. Reading, MA: Addison-Wesley.Harary, Frank, Robert Norman <strong>and</strong> Dorwin Cartwright. 1965. Structural Models. NewYork: Wiley.Hoff, Peter D., Adrian E. Raftery <strong>and</strong> Mark S. H<strong>and</strong>cock. 2002 in press. “<strong>Latent</strong> Space Approachesto Social Network Analysis.” Journal of the American Statistical Associationtba(tba):tba.King, Gary <strong>and</strong> Langche Zeng. 2001. “Improving Forecasts of State Failure.” World Politics53(4):623–658.Knoke, David <strong>and</strong> James H. Kuklinski. 1982. Network Analysis. Beverly Hills, CA: Sage.Lai, David. 1995. “A Structural Approach to Alignment: A Case Study of the China-Soviet-U.S. Strategic Triangle, 1971-1988.” <strong>International</strong> Interactions 20(4):349–374.Lofdahl, Corey L. 2002. Environmental Impacts of Globalization <strong>and</strong> Trade: A SystemsStudy. Cambridge, MA: The MIT Press.McClell<strong>and</strong>, Charles A. <strong>and</strong> Gary Hoggard. 1969. Conflict patterns in the interactionsamong nations. In <strong>International</strong> Politics <strong>and</strong> Foreign Policy, ed. James N. Rosenau.New York: The Free Press pp. 711–724.Moreno, Jakob L. 1934. Who Shall Survive? Washington, D.C.: Nervous <strong>and</strong> MentalDisease Publishing Company.13
White, Harrison, Scott Boorman <strong>and</strong> Ronald Breiger. 1976. “Social Structure From Multiple<strong>Networks</strong>; Blockmodels of Roles <strong>and</strong> Positions.” American Journal of Sociology81:730–799.15