Framework for Aircraft Conceptual Design and Environmental ...
Framework for Aircraft Conceptual Design and Environmental ...
Framework for Aircraft Conceptual Design and Environmental ...

Create successful ePaper yourself
Turn your PDF publications into a flip-book with our unique Google optimized e-Paper software.
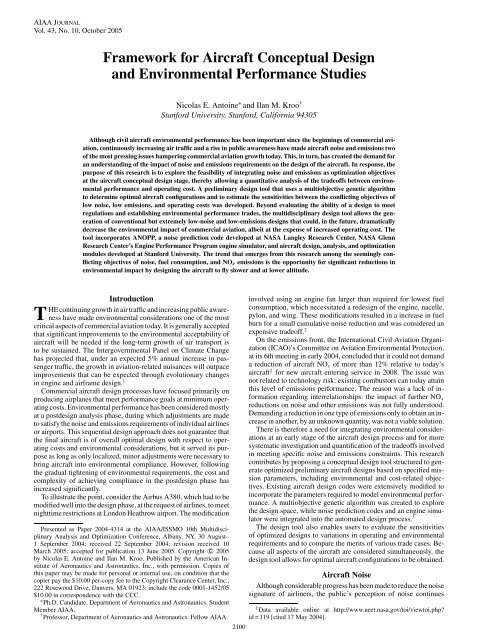
AIAA JOURNAL<br />
Vol. 43, No. 10, October 2005<br />
<strong>Framework</strong> <strong>for</strong> <strong>Aircraft</strong> <strong>Conceptual</strong> <strong>Design</strong><br />
<strong>and</strong> <strong>Environmental</strong> Per<strong>for</strong>mance Studies<br />
Nicolas E. Antoine ∗ <strong>and</strong> Ilan M. Kroo †<br />
Stan<strong>for</strong>d University, Stan<strong>for</strong>d, Cali<strong>for</strong>nia 94305<br />
Although civil aircraft environmental per<strong>for</strong>mance has been important since the beginnings of commercial aviation,<br />
continuously increasing air traffic <strong>and</strong> a rise in public awareness have made aircraft noise <strong>and</strong> emissions two<br />
of the most pressing issues hampering commercial aviation growth today. This, in turn, has created the dem<strong>and</strong> <strong>for</strong><br />
an underst<strong>and</strong>ing of the impact of noise <strong>and</strong> emissions requirements on the design of the aircraft. In response, the<br />
purpose of this research is to explore the feasibility of integrating noise <strong>and</strong> emissions as optimization objectives<br />
at the aircraft conceptual design stage, thereby allowing a quantitative analysis of the tradeoffs between environmental<br />
per<strong>for</strong>mance <strong>and</strong> operating cost. A preliminary design tool that uses a multiobjective genetic algorithm<br />
to determine optimal aircraft configurations <strong>and</strong> to estimate the sensitivities between the conflicting objectives of<br />
low noise, low emissions, <strong>and</strong> operating costs was developed. Beyond evaluating the ability of a design to meet<br />
regulations <strong>and</strong> establishing environmental per<strong>for</strong>mance trades, the multidisciplinary design tool allows the generation<br />
of conventional but extremely low-noise <strong>and</strong> low-emissions designs that could, in the future, dramatically<br />
decrease the environmental impact of commercial aviation, albeit at the expense of increased operating cost. The<br />
tool incorporates ANOPP, a noise prediction code developed at NASA Langley Research Center, NASA Glenn<br />
Research Center’s Engine Per<strong>for</strong>mance Program engine simulator, <strong>and</strong> aircraft design, analysis, <strong>and</strong> optimization<br />
modules developed at Stan<strong>for</strong>d University. The trend that emerges from this research among the seemingly conflicting<br />
objectives of noise, fuel consumption, <strong>and</strong> NOx emissions is the opportunity <strong>for</strong> significant reductions in<br />
environmental impact by designing the aircraft to fly slower <strong>and</strong> at lower altitude.<br />
Introduction<br />
THE continuing growth in air traffic <strong>and</strong> increasing public awareness<br />
have made environmental considerations one of the most<br />
critical aspects of commercial aviation today. It is generally accepted<br />
that significant improvements to the environmental acceptability of<br />
aircraft will be needed if the long-term growth of air transport is<br />
to be sustained. The Intergovernmental Panel on Climate Change<br />
has projected that, under an expected 5% annual increase in passenger<br />
traffic, the growth in aviation-related nuisances will outpace<br />
improvements that can be expected through evolutionary changes<br />
in engine <strong>and</strong> airframe design. 1<br />
Commercial aircraft design processes have focused primarily on<br />
producing airplanes that meet per<strong>for</strong>mance goals at minimum operating<br />
costs. <strong>Environmental</strong> per<strong>for</strong>mance has been considered mostly<br />
at a postdesign analysis phase, during which adjustments are made<br />
to satisfy the noise <strong>and</strong> emissions requirements of individual airlines<br />
or airports. This sequential design approach does not guarantee that<br />
the final aircraft is of overall optimal design with respect to operating<br />
costs <strong>and</strong> environmental considerations, but it served its purpose<br />
as long as only localized, minor adjustments were necessary to<br />
bring aircraft into environmental compliance. However, following<br />
the gradual tightening of environmental requirements, the cost <strong>and</strong><br />
complexity of achieving compliance in the postdesign phase has<br />
increased significantly.<br />
To illustrate the point, consider the Airbus A380, which had to be<br />
modified well into the design phase, at the request of airlines, to meet<br />
nighttime restrictions at London Heathrow airport. The modification<br />
Presented as Paper 2004-4314 at the AIAA/ISSMO 10th Multidisciplinary<br />
Analysis <strong>and</strong> Optimization Conference, Albany, NY, 30 August–<br />
1 September 2004; received 22 September 2004; revision received 10<br />
March 2005; accepted <strong>for</strong> publication 13 June 2005. Copyright c○ 2005<br />
by Nicolas E. Antoine <strong>and</strong> Ilan M. Kroo. Published by the American Institute<br />
of Aeronautics <strong>and</strong> Astronautics, Inc., with permission. Copies of<br />
this paper may be made <strong>for</strong> personal or internal use, on condition that the<br />
copier pay the $10.00 per-copy fee to the Copyright Clearance Center, Inc.,<br />
222 Rosewood Drive, Danvers, MA 01923; include the code 0001-1452/05<br />
$10.00 in correspondence with the CCC.<br />
∗ Ph.D. C<strong>and</strong>idate, Department of Aeronautics <strong>and</strong> Astronautics. Student<br />
Member AIAA.<br />
† Professor, Department of Aeronautics <strong>and</strong> Astronautics. Fellow AIAA.<br />
2100<br />
involved using an engine fan larger than required <strong>for</strong> lowest fuel<br />
consumption, which necessitated a redesign of the engine, nacelle,<br />
pylon, <strong>and</strong> wing. These modifications resulted in a increase in fuel<br />
burn <strong>for</strong> a small cumulative noise reduction <strong>and</strong> was considered an<br />
expensive tradeoff. 2<br />
On the emissions front, the International Civil Aviation Organization<br />
(ICAO)’s Committee on Aviation <strong>Environmental</strong> Protection,<br />
at its 6th meeting in early 2004, concluded that it could not dem<strong>and</strong><br />
a reduction of aircraft NOx of more than 12% relative to today’s<br />
aircraft ‡ <strong>for</strong> new aircraft entering service in 2008. The issue was<br />
not related to technology risk: existing combustors can today attain<br />
this level of emissions per<strong>for</strong>mance. The reason was a lack of in<strong>for</strong>mation<br />
regarding interrelationships: the impact of further NOx<br />
reductions on noise <strong>and</strong> other emissions was not fully understood.<br />
Dem<strong>and</strong>ing a reduction in one type of emissions only to obtain an increase<br />
in another, by an unknown quantity, was not a viable solution.<br />
There is there<strong>for</strong>e a need <strong>for</strong> integrating environmental considerations<br />
at an early stage of the aircraft design process <strong>and</strong> <strong>for</strong> more<br />
systematic investigation <strong>and</strong> quantification of the tradeoffs involved<br />
in meeting specific noise <strong>and</strong> emissions constraints. This research<br />
contributes by proposing a conceptual design tool structured to generate<br />
optimized preliminary aircraft designs based on specified mission<br />
parameters, including environmental <strong>and</strong> cost-related objectives.<br />
Existing aircraft design codes were extensively modified to<br />
incorporate the parameters required to model environmental per<strong>for</strong>mance.<br />
A multiobjective genetic algorithm was created to explore<br />
the design space, while noise prediction codes <strong>and</strong> an engine simulator<br />
were integrated into the automated design process. 3<br />
The design tool also enables users to evaluate the sensitivities<br />
of optimized designs to variations in operating <strong>and</strong> environmental<br />
requirements <strong>and</strong> to compare the merits of various trade cases. Because<br />
all aspects of the aircraft are considered simultaneously, the<br />
design tool allows <strong>for</strong> optimal aircraft configurations to be obtained.<br />
<strong>Aircraft</strong> Noise<br />
Although considerable progress has been made to reduce the noise<br />
signature of airliners, the public’s perception of noise continues<br />
‡ Data available online at http://www.ueet.nasa.gov/toi/viewtoi.php?<br />
id = 119 [cited 17 May 2004].
Fig. 1 ICAO certification noise measurement points. 7<br />
to grow, as evidenced by the ever-increasing number of public<br />
complaints. This can be attributed to increasing air traffic as well as<br />
further encroachment by airport-neighboring communities. In the<br />
United States, 60% of all airports consider noise a major problem,<br />
<strong>and</strong> the 50 largest airports view it as their biggest issue. 4 As a result,<br />
noise has become a major constraint to air traffic. A survey of the<br />
world’s airports reveals a twofold increase in the number of noiserelated<br />
restrictions in the past 10 years, 5 including curfews, fines,<br />
operating restrictions, <strong>and</strong> quotas.<br />
The historical trend in aircraft noise has shown a reduction of<br />
approximately 20 EPNdB since the 1960s, largely because of the<br />
adoption of high-bypass turbofans <strong>and</strong> more effective lining materials.<br />
Reductions since the mid-1980s have not been as dramatic. 6<br />
The point seems to have been reached where future improvements<br />
through technological advances will be possible only by significantly<br />
trading off operating costs <strong>for</strong> environmental per<strong>for</strong>mance.<br />
Quantifying the terms of this tradeoff, which will be critical <strong>for</strong> the<br />
efficient design of future aircraft, is one of the main objectives of<br />
this research.<br />
Noise Prediction<br />
The ICAO <strong>and</strong> Federal Aviation Administration issue noise certifications<br />
based on measurements of approach, sideline <strong>and</strong> flyover<br />
noise made at three points during the l<strong>and</strong>ing <strong>and</strong> takeoff cycle<br />
(LTO), as illustrated in Fig. 1 (Ref. 7). Noise is recorded continuously<br />
at these locations during takeoff <strong>and</strong> l<strong>and</strong>ing. The total timeintegrated<br />
noise, known as effective perceived noise level (EPNL),<br />
must not exceed a set limit, itself based on the maximum takeoff<br />
weight of the airplane <strong>and</strong> the number of engines. Jet noise typically<br />
dominates in sideline <strong>and</strong> flyover noise. On approach, high-bypassratio<br />
engines operate at reduced thrust <strong>and</strong> are relatively quiet, making<br />
airframe noise a relevant component.<br />
<strong>Aircraft</strong> Noise Prediction Program (ANOPP) is a semiempirical<br />
code developed <strong>and</strong> updated continuously by the NASA Langley<br />
Research Center. 8,9 It incorporates publicly available noise prediction<br />
schemes <strong>and</strong> models noise from a variety of sources, including<br />
fan noise, jet noise, <strong>and</strong> airframe noise. By using engine data supplied<br />
from the engine per<strong>for</strong>mance code, <strong>and</strong> aircraft geometry <strong>and</strong><br />
LTO data supplied from other analysis routines, ANOPP computes<br />
near-field sound spectra <strong>for</strong> each noise source. The ANOPP propagation<br />
module is then run to determine the tone-corrected perceived<br />
noise levels as measured at the ICAO certification points, be<strong>for</strong>e<br />
ANOPP computes the time-averaged EPNLs.<br />
Noise Reduction<br />
Bypass Ratio<br />
As noted earlier, jet engines produce most of the sideline <strong>and</strong><br />
flyover noise measured during the certification process. It follows<br />
that engine design is critical to the noise per<strong>for</strong>mance of the aircraft.<br />
Along with advances in liner materials, high-bypass-ratio engines<br />
have been the single largest contributor to aircraft noise reduction.<br />
The particular importance of bypass ratios in this respect is well<br />
known: increasing the bypass ratio can have a dramatic effect on fuel<br />
efficiency, noise, <strong>and</strong> emissions. By increasing the amount of airflow<br />
directed around the combustion chamber relative to the amount of<br />
air passing through it, mixing between the flows on exit is increased,<br />
<strong>and</strong> exhaust velocities reduced. The result is a considerable decrease<br />
in jet noise <strong>and</strong> overall engine noise (Fig. 2): increasing bypass ratios<br />
from 6 to 14 results in a cumulative noise reduction of 8 dB. These<br />
results were obtained with the design tool developed as part of this<br />
research <strong>for</strong> a 280-passenger aircraft.<br />
ANTOINE AND KROO 2101<br />
Fig. 2 Impact of increasing bypass ratio on cumulative certification<br />
noise <strong>and</strong> total fuel required to complete the mission.<br />
Fig. 3 Noise measured at the three certification points as a function of<br />
bypass ratio.<br />
The impact on emissions <strong>and</strong> operating costs of increasing bypass<br />
ratio is not as obvious. 10 Figure 2 also illustrates the variations<br />
<strong>for</strong> cost-optimized aircraft in total fuel carried (which largely determines<br />
both cost <strong>and</strong> emissions per<strong>for</strong>mance) as a function of the<br />
bypass ratio. Although fuel consumption improves by about 9%<br />
when the bypass ratio increases from 4 to 8, it increases again when<br />
the bypass ratio exceeds 10. The relative deterioration of the fuel<br />
consumption <strong>for</strong> high-bypass engines is caused in part by the significant<br />
parasite drag associated with their large fans. In addition, <strong>for</strong><br />
agiven thrust requirement at cruise conditions, high-bypass-ratio<br />
engines will typically have excess sea-level static (SLS) thrust. For<br />
instance, an engine with a bypass ratio of 10 can produce about 20%<br />
less thrust at 31,000 ft than a engine with a bypass ratio of 6 having<br />
identical SLS thrust. As a result, whereas high-bypass-ratio engines<br />
have low noise emissions because of reduced exhaust velocities,<br />
some of this advantage is offset by the need to increase the SLS<br />
thrust (i.e., oversize the engines) to achieve the required cruising<br />
altitude thrust.<br />
The noise measured at each of the certification points <strong>for</strong> the<br />
same aircraft, as a function of bypass ratio, is shown in Fig. 3.<br />
Note that sideline <strong>and</strong> flyover noise both gain significantly from the<br />
decrease in jet velocities associated with increasing bypass ratios.<br />
At the reduced throttle settings required at approach, however, jet<br />
noise is not a dominating factor. Airframe <strong>and</strong> fan noise are the<br />
most important contributors in this regime. This is illustrated by the<br />
relatively flat approach noise data shown in Fig. 3.<br />
Having achieved significant progress in reducing jet noise, the<br />
focus of most current research is on reducing fan <strong>and</strong> airframe noise,<br />
currently seen as the limiting factors in the manufacturers’ present<br />
ability to improve aircraft noise per<strong>for</strong>mance on approach.
2102 ANTOINE AND KROO<br />
Climb Per<strong>for</strong>mance<br />
Another method of reducing certification noise involves increasing<br />
the distance between the aircraft <strong>and</strong> the measurement point.<br />
One option is a steeper climb. The balance between increased noise<br />
at the source <strong>and</strong> the improved climb per<strong>for</strong>mance af<strong>for</strong>ded by larger<br />
engines is delicate <strong>and</strong> there<strong>for</strong>e perfectly suited <strong>for</strong> an optimization<br />
process.<br />
Although beyond the scope of this research, operational procedures<br />
<strong>for</strong> existing aircraft, such as thrust cutback, steeper descents,<br />
<strong>and</strong> continuous descent approaches can offer significant reductions<br />
in noise.<br />
Engine Emissions<br />
The release of exhaust gases in the atmosphere is the second major<br />
environmental issue associated with commercial airliners. The<br />
world fleet releases approximately 13% of CO2 emissions from all<br />
transportation sources, or 2% of all anthropogenic sources. 11 The<br />
expected doubling of the fleet in the next 20 years § will certainly<br />
exacerbate the issue: the contribution of aviation is expected to increase<br />
by a factor of 1.6 to 10, depending on the fuel consumption<br />
scenario.<br />
Current emissions regulations have focused on local air quality in<br />
the vicinity of airports. Emissions released during cruise in the upper<br />
atmosphere are recognized as an important issue with potentially<br />
severe long-term environmental consequences, <strong>and</strong> ICAO is actively<br />
seeking support <strong>for</strong> regulating them as well.<br />
Local <strong>and</strong> Cruise Emissions<br />
Both particulate <strong>and</strong> gaseous pollutants are produced through the<br />
combustion of jet kerosene.<br />
Reactants: Air: N2, O2<br />
Fuel: CnHm, S<br />
Products: CO2, H2O, N2, O2, NOx, UHC, CO, Csoot, SOx<br />
The greenhouse gases carbon dioxide CO2 <strong>and</strong> water H2O are<br />
the major products. Minor emissions <strong>for</strong>med during combustion include<br />
nitrous oxides (NOx), unburned hydrocarbons (UHC), carbon<br />
monoxide (CO), <strong>and</strong> smoke (Csoot).<br />
ICAO regulations <strong>for</strong> the LTO cycle cover NOx, CO, UHC, <strong>and</strong><br />
smoke emissions. 12 NOx are the main regulated pollutants, accounting<br />
<strong>for</strong> 80% of regulated emissions during the cycle. For certification<br />
purposes, they are computed based on the combustor emission index<br />
(EI, expressed in grams of NOx released per kilogram of jet fuel<br />
used) <strong>and</strong> engine fuel flow (expressed in kilograms/second). Fuel<br />
flow itself is a strong function of power setting during the LTO cycle,<br />
which involves four different throttle modes, m<strong>and</strong>ated by the<br />
ICAO. The engine is run in a test facility, <strong>and</strong> the various segments of<br />
the cycle are simulated as follows: 0.7 min <strong>for</strong> takeoff (full throttle),<br />
2.2 min <strong>for</strong> climb (85% throttle), 4 min <strong>for</strong> approach (30% throttle),<br />
<strong>and</strong> 26 min <strong>for</strong> taxi/idle (7% throttle). The amount of NOx produced<br />
during the LTO cycle is computed as the sum of the emissions <strong>for</strong><br />
the preceding four modes (expressed in kilograms):<br />
�<br />
NOx = fuel flow × EINOx × time in mode<br />
The combustor emission index is estimated as a function of P3,<br />
the combustor entrance pressure, <strong>and</strong> T3 <strong>and</strong> T4, respectively, the<br />
entrance <strong>and</strong> exit temperatures in the combustor (personal communication<br />
with S. Jones, Aerospace Engineer, Airbreathing Systems<br />
Analysis Office, NASA Glenn Research Center, Dayton, Ohio,<br />
2003) (units are psia <strong>and</strong> Rankine):<br />
EINOx = 0.004194T4(P3/439) 0.37 e (T3 − 1471)/345<br />
During cruise, NOx emissions become relatively unimportant<br />
(0.3% of the mass flow emerging from the engine) compared to<br />
other emissions, including CO2, CO, <strong>and</strong> SO2, which account <strong>for</strong><br />
over6%ofthe mass flow. Because the carbon <strong>and</strong> sulphur necessary<br />
to <strong>for</strong>m these emissions are found in the jet fuel, it follows that cruise<br />
§ Data available online at http://www.boeing.com/commercial/cmo [cited<br />
8 April 2003].<br />
emissions are directly proportional to the amount of fuel burned in<br />
flight. Consequently, an aircraft can be optimized <strong>for</strong> cruise emissions<br />
by introducing fuel weight as an objective to be minimized<br />
at the conceptual design stage, which leads to a four-way tradeoff<br />
between operating cost, cruise emissions, <strong>and</strong> the already discussed<br />
NOx emissions <strong>and</strong> noise objectives.<br />
Reduction Methods<br />
Combustor <strong>and</strong> Engine Cycle<br />
The two methods that allow a reduction in emissions at the level<br />
of the powerplant include improving the combustor to yield a lower<br />
emissions index (that is, reduce the amount of pollutant emitted<br />
per kilogram of fuel burned) <strong>and</strong> choosing an engine cycle that<br />
yields lower fuel flow (to reduce the amount of fuel consumed).<br />
Increasing the overall engine pressure ratio promotes more complete<br />
combustion, resulting in reduced fuel flow. The tradeoff is higher<br />
NOx emissions caused by the increased combustion temperature,<br />
leading to increased dissociation of nitrogen, <strong>and</strong> consequently a<br />
higher NOx EI. Although improvements to the combustor could<br />
decrease the amount of NOx or CO2 released into the atmosphere,<br />
these are generally conflicting requirements. Typically, changing<br />
the operating conditions or combustor configuration to reduce NOx<br />
emissions increases the quantity of CO2 <strong>and</strong> unburned hydrocarbons<br />
produced. 13<br />
In particular, as the bypass ratio of large turbofans is increased,<br />
the resulting power requirements of the larger fan m<strong>and</strong>ate that more<br />
energy must be extracted from the low-pressure turbine. This typically<br />
leads to higher pressures, combustion temperatures, <strong>and</strong> NOx<br />
production. In fact, total aviation NOx emissions increased faster<br />
than total fuel consumption over the last few decades because of the<br />
higher pressure ratios (<strong>and</strong> there<strong>for</strong>e combustion temperatures) dem<strong>and</strong>ed<br />
by the more fuel-efficient high-bypass-ratio engines. Other<br />
types of emissions, however, have decreased per unit of fuel consumption.<br />
This increase in NOx production can be partially offset through<br />
detailed combustor design, which is beyond the scope of the present<br />
conceptual design tool. Advanced double-annular, lean premixed,<br />
<strong>and</strong> rich/quench/lean combustors could all be subsequently incorporated<br />
if data were made available relating design parameters (combustion<br />
temperature, overall pressure ratio) with emissions indices.<br />
Cruise Altitude Effects<br />
Contrail <strong>for</strong>mation 14 is another issue that is receiving increased<br />
attention. Although the long-term impact on climate change as a<br />
result of increasing water content at altitude is uncertain, one possible<br />
solution to minimize contrails is to operate the aircraft at lower<br />
cruise altitudes to increase ambient temperatures.<br />
The advantages of decreasing cruise altitude are two-fold: contrail<br />
<strong>for</strong>mation would be dramatically reduced, <strong>and</strong> the net total impact of<br />
other emissions could be reduced, as the aircraft would be operating<br />
outside of the sensitive tropopause. Figure 4 (Ref. 15) illustrates<br />
these effects <strong>for</strong> two fuels: kerosene <strong>and</strong> hydrogen. In the case of<br />
kerosene, reducing the cruise altitude from 11 to 9 km reduces the<br />
net impact of NOx by half because the aircraft has traveled out of the<br />
troposphere <strong>and</strong> H2Oby75% because of the prevention of contrail<br />
<strong>for</strong>mation. However, the net impact of operating the aircraft at this<br />
off-design altitude, from a fuel efficiency perspective, is apparent:<br />
CO2 effects increase by a third. A separate Boeing study supports<br />
this general trend, concluding that operating an existing aircraft in<br />
the 747-400 class at lower altitudes would increase CO2 production<br />
by 15% <strong>and</strong> NOx emissions by up to 25% (Ref. 16). To minimize this<br />
degradation in per<strong>for</strong>mance, an aircraft would have to be designed<br />
specifically to operate at these lower altitudes, which is discussed<br />
in the Results section. It must be noted, however, that there are<br />
complications to operating an aircraft a lower altitudes, the most<br />
important being weather.<br />
As a side note, although hydrogen fuel is not considered as part of<br />
this research it is interesting to note that, being the major byproduct<br />
of so-called “clean” combustion, water effects would be as much<br />
as three times more important than with kerosene fuel at a cruise<br />
altitude of 11 km.
Fig. 4 Effect of fuel type <strong>and</strong> cruise altitude on net greenhouse effects.<br />
<strong>Aircraft</strong> Aerodynamics<br />
The advantages of reducing fuel flow, at the engine level, on the<br />
production of emissions have been discussed earlier. At the aircraft<br />
level, drag contributes directly to the thrust requirements. Improving<br />
the aerodynamic efficiency of an aircraft by reducing drag, <strong>and</strong><br />
there<strong>for</strong>e reducing the amount of thrust required, can result in a<br />
decrease of required fuel <strong>and</strong> related emissions.<br />
Reducing the aircraft cruise Mach number is one solution to reducing<br />
drag, <strong>for</strong> example. This must be carefully balanced with<br />
other mission requirements, however, <strong>and</strong> highlights the importance<br />
of considering the aircraft as a whole. New technologies, such as<br />
increased laminar flow <strong>and</strong> induced drag-reduction methods, are<br />
promising in their ability to increase the aerodynamic efficiency<br />
<strong>and</strong> reduce the fuel consumption of the aircraft. These are discussed<br />
in more detail in the Results section.<br />
<strong>Design</strong> Tool<br />
<strong>Aircraft</strong> <strong>Design</strong> <strong>and</strong> Optimization<br />
The design tool is structured around PASS, a program <strong>for</strong> aircraft<br />
synthesis studies, 17 the ANOPP, NASA Glenn’s NEPP (NASA Engine<br />
Per<strong>for</strong>mance Program) <strong>for</strong> engine simulation, 18 a genetic multiobjective<br />
optimizer, <strong>and</strong> a database management module.<br />
The PASS design modules are used to analyze key aspects of<br />
the aircraft, including aerodynamics, per<strong>for</strong>mance, stability/control,<br />
structures, <strong>and</strong> economics. They offer the resolution required to capture<br />
environmental concerns <strong>and</strong> are amenable to optimization. The<br />
engine per<strong>for</strong>mance <strong>and</strong> noise estimation codes are coupled to the<br />
aircraft per<strong>for</strong>mance <strong>and</strong> operating cost modules. 19,20 An illustration<br />
of the framework is shown in Fig. 5.<br />
The multidisciplinary analysis of the aircraft <strong>and</strong> the optimizing<br />
of its design are per<strong>for</strong>med within a design environment, known as<br />
the Collaborative Application <strong>Framework</strong> <strong>for</strong> Engineering (CAFFE)<br />
(see Ref. 21), in conjunction with the optimizer. CAFFE provides <strong>for</strong><br />
easy reconfiguration of the design tool: adding or removing design<br />
variables, objectives, <strong>and</strong> constraints is done via a simple graphical<br />
interface, which af<strong>for</strong>ds the rapid execution <strong>and</strong> robustness needed<br />
<strong>for</strong> optimization.<br />
Any parameter introduced in the database can be set as an objective,<br />
a variable, a constraint, or a fixed numerical value. Consequently,<br />
the design tool allows great flexibility in selecting objective<br />
functions <strong>and</strong> in exploring the sensitivity of optimized designs to<br />
changes in specifications or constraints. Objective functions can<br />
include per<strong>for</strong>mance parameters (<strong>for</strong> instance takeoff weight, operating<br />
cost, or range), as well as environmental parameters (certification<br />
noise <strong>and</strong> emissions levels). The latter can also be set<br />
as constraints, with the user specifying the level of environmental<br />
friendliness required of the aircraft: from slight improvements over<br />
designs optimized <strong>for</strong> minimal cost, to “silent” <strong>and</strong> “clean” aircraft.<br />
<strong>Design</strong> variables typically include parameters pertaining to aircraft<br />
configuration, propulsion, <strong>and</strong> mission profile.<br />
ANTOINE AND KROO 2103<br />
Fig. 5 <strong>Design</strong> framework: the PASS aircraft design modules, noise<br />
prediction, <strong>and</strong> engine simulator are coupled with an optimizer <strong>and</strong> a<br />
database manager.<br />
Fig. 6 Example two-objective minimization problem showing the<br />
Pareto set.<br />
Multiobjective Optimization<br />
Genetic algorithms 22 mimic nature’s evolutionary principles in<br />
searching <strong>for</strong> optimal solutions. Such algorithms are particularly<br />
well suited to multiobjective optimization problems because they<br />
can h<strong>and</strong>le large populations of solutions, which they drive toward<br />
optimality through a generational process of selection <strong>and</strong> elimination.<br />
Over the course of multiple generations, increasingly optimal<br />
“nondominated” solutions (i.e., solutions that are not outper<strong>for</strong>med<br />
by others having better scores on all objectives) are identified <strong>and</strong><br />
retained. 23 For each generation, a ranking approach is used to evaluate<br />
the relative dominance (per<strong>for</strong>mance) of each solution <strong>and</strong> to<br />
determine the set of nondominated, rank 1 solutions, known as the<br />
Pareto set.<br />
The concept is illustrated <strong>for</strong> a two-objective minimization problem<br />
in Fig. 6. Of the eight solutions shown, four are dominated<br />
because at least one other solution shows better scores on both<br />
objectives. The Pareto set contains the solutions offering the best<br />
tradeoff between the two objectives <strong>for</strong> the current generation: <strong>for</strong><br />
these solutions, any improvement in per<strong>for</strong>mance relating to one<br />
objective is possible only by accepting a reduction of per<strong>for</strong>mance<br />
in the other. Through the generations, the genetic algorithm drives
2104 ANTOINE AND KROO<br />
Table 1 Variable names, units, <strong>and</strong> minimum <strong>and</strong><br />
maximum allowable values <strong>for</strong> the optimization problems<br />
Variable Min Max<br />
Maximum takeoff weight, lb 280,000 550,000<br />
Wing reference area, ft 2 1,500 4,000<br />
Wing thickness over chord, % 0.07 0.20<br />
Wing location along fuselage, % 0.2 0.6<br />
Wing aspect ratio 4.0 15.0<br />
Wing taper ratio 0.1 0.7<br />
Wing sweep, deg 0.0 40.0<br />
Horizontal tail area, ft 2 225 600<br />
Sea-level static thrust, lb 40,000 100,000<br />
Turbine inlet temperature, ◦ F 3,000 3,300<br />
Bypass ratio 4.0 15.0<br />
Engine pressure ratio 40.0 60.0<br />
Initial cruise altitude, ft 20,000 40,000<br />
Final cruise altitude, ft 20,000 50,000<br />
Cruise Mach number 0.65 0.95<br />
Fig. 7 Pareto front indicates the set of nondominated solutions in a<br />
given generation. The optimization process drives the population toward<br />
their optimal values.<br />
the population toward better solutions. This is illustrated in Fig. 7:<br />
a 200-seat, 6000-n mile range aircraft is optimized simultaneously<br />
<strong>for</strong> both minimum cost <strong>and</strong> maximum cruise Mach number.<br />
With each generation, the Pareto front is pushed toward higher<br />
Mach numbers <strong>and</strong> lower costs. Eventually, the front no longer progresses,<br />
<strong>and</strong> the set of optimal tradeoffs between Mach number<br />
<strong>and</strong> cost is obtained. Selecting one solution among those belonging<br />
to the Pareto set typically requires in<strong>for</strong>mation extraneous to the<br />
optimization problem (<strong>for</strong> instance, technical risk, certification, or<br />
operational requirements).<br />
The uncertainty associated with the approximate methods used<br />
in this conceptual design tool could be propagated through the optimization<br />
process. The outcome would be a distribution of solutions,<br />
as opposed to the current single-point deterministic result <strong>for</strong> each<br />
design. This probabilistic approach would allow the user to underst<strong>and</strong>,<br />
<strong>and</strong> quantify, the impact of modeling error on the conceptual<br />
design process. The computing cost associated with generating such<br />
aPareto “b<strong>and</strong>” (as opposed to a well-defined front), however, would<br />
be considerable.<br />
Multiobjective Trade Studies<br />
<strong>Aircraft</strong> Mission, Variables, <strong>and</strong> Constraints<br />
This section illustrates the optimization process per<strong>for</strong>med by<br />
the design tool in the case of a 280-passenger, twin-engine airliner<br />
with a 6000-n mile range, <strong>and</strong> takeoff, cruise, <strong>and</strong> l<strong>and</strong>ing per<strong>for</strong>mances<br />
in line with industry st<strong>and</strong>ards <strong>for</strong> similarly sized aircraft.<br />
The 15 design variables are listed in Table 1, split in three groups:<br />
aircraft geometry, engine parameters, <strong>and</strong> per<strong>for</strong>mance. Constraints<br />
are shown in Table 2.<br />
Table 2 Constraints <strong>for</strong> the optimization<br />
problems<br />
Constraint Value<br />
Cruise range, n mile ≥ 6000<br />
Takeoff field length, ft ≤ 9000<br />
L<strong>and</strong>ing field length, ft ≤ 8000<br />
Engine-out climb gradient ≥ 0.024<br />
Drag-to-thrust ratio ≤ 0.88<br />
Stability margin ≥ 0.18<br />
Wing cruise lift coeff. margin ≥ 0.01<br />
Tail rotation lift coeff. margin ≥ 0.01<br />
Tail cruise lift coeff. margin ≥ 0.01<br />
Tail l<strong>and</strong>ing lift coeff. margin ≥ 0.01<br />
Wing span, ft ≤ 260.0<br />
Table 3 Data <strong>for</strong> the optimal extreme designs obtained with the<br />
single-objective genetic algorithm<br />
<strong>Design</strong> A <strong>Design</strong> B <strong>Design</strong> C <strong>Design</strong> D<br />
Parameter min cost min fuel min NOx min noise<br />
Objectives<br />
Relative cost 1.0 1.02 1.10 1.26<br />
Fuel carried, lb 119,018 106,707 129,605 138,840<br />
LTO NOx ,kg 30.88 29.68 14.04 41.09<br />
Relative noise, EPNdB 0.0 −5.13 3.66 −14.98<br />
Variables<br />
Max. takeoff weight, lb 372,539 352,515 419,842 473,532<br />
Wing reference area, ft 2 3,461 2,942 4,283 3,578<br />
Wing t/c,% 11.7 13.5 12.8 11.5<br />
Wing location, % 39.2 41.2 43.6 48.2<br />
Wing aspect ratio 7.38 9.99 9.81 14.43<br />
Wing taper ratio 0.10 0.10 0.21 0.1<br />
Wing sweep, deg 33.70 26.17 18.80 14.25<br />
Horizontal tail area, ft 2 929 766 1220 1,431<br />
SLS thrust (per engine), lb 68,404 67,311 60,954 100,000<br />
Thrust-to-weight ratio 0.367 0.382 0.290 0.422<br />
Turbine inlet temp., ◦ F 3,203 3,215 3,071 3,300<br />
Bypass ratio 9.59 10.35 10.48 14.87<br />
Engine pressure ratio 59.91 59.63 40.23 59.78<br />
Init. cruise altitude, ft 32,937 30,746 29,170 31,674<br />
Final cruise altitude, ft 40,790 38,734 39,843 35,486<br />
Cruise Mach number 0.844 0.739 0.691 0.664<br />
Operating Cost vs Cruise Emissions, LTO NOx Emissions, <strong>and</strong> Noise<br />
The process of obtaining a low-rank Pareto front can be significantly<br />
accelerated by first computing the extreme points of the<br />
fronts. This is done by running a single-objective version of the<br />
genetic algorithm. These optimal designs are subsequently inserted<br />
into the initial population of the multiobjective problems.<br />
The resulting Pareto fronts of fuel carried, NOx emissions, <strong>and</strong><br />
relative cumulative noise vs cost are shown in Fig. 8. The reference<br />
<strong>for</strong> all relative data is the min-cost design (design A). Key parameters<br />
<strong>for</strong> the optimized extreme designs are summarized in Table 3.<br />
The configuration leading to minimum operating cost (design A)<br />
was computed first by running the design tool. This aircraft is considered<br />
as the baseline <strong>and</strong> is representative of existing aircraft that<br />
are optimized <strong>for</strong> minimum operating cost. Reflecting the impact<br />
of block time (including the effects of crew costs) on the operating<br />
cost function, the cruise Mach number is higher than would be required<br />
<strong>for</strong> minimal fuel burn (design B). Fuel plays a dominating<br />
role in the cost calculation, as illustrated by the similarities in the<br />
designs <strong>for</strong> minimum cost <strong>and</strong> minimum fuel carried (<strong>and</strong> there<strong>for</strong>e,<br />
minimum cruise CO2, SO2, <strong>and</strong> H2O). This tight coupling is also<br />
reflected in the relatively small fuel-cost trade space. (Notice that<br />
the fuel-cost Pareto front is narrow.) At the engine level, noticeably,<br />
both designs attain high fuel efficiency via large pressure ratios <strong>and</strong><br />
high turbine inlet temperatures. Optimizing the aircraft <strong>for</strong> lowest<br />
fuel yields a 10% decrease in fuel carried (propagating through the<br />
design to yield a 5.4% decrease in maximum takeoff weight) <strong>for</strong> a<br />
cost increase of 2% relative to min-cost design A. Because block<br />
time is no longer a design driver, design B flies slower (Mach 0.74
ANTOINE AND KROO 2105<br />
Fig. 8 Pareto fronts of fuel carried, LTO NOx, <strong>and</strong> cumulative certification noise vs operating cost. Only rank 1 designs are shown. Average rank<br />
<strong>for</strong> all fronts is under 4.<br />
vs 0.84) <strong>and</strong> there<strong>for</strong>e lower (30,746 vs 32,937 ft) than design A to<br />
minimize fuel burn.<br />
The generation of NOx emissions is a strong function of combustor<br />
exhaust temperature <strong>and</strong> compression ratio. <strong>Design</strong> C there<strong>for</strong>e<br />
compromises fuel efficiency <strong>for</strong> low NOx emissions by reducing<br />
the engine overall pressure ratio <strong>and</strong> combustor temperature. The<br />
resulting 11% reduction in sea-level static thrust relative to the mincost<br />
design m<strong>and</strong>ates that the aircraft fly slower (Mach 0.69, close<br />
to the lower allowable limit, vs Mach 0.84) <strong>and</strong> at lower altitudes.<br />
(The initial cruise altitude is reduced from approximately 33,000 to<br />
29,000 ft.) The result is a 54.5% drop in LTO NOx emissions <strong>for</strong><br />
an 10% <strong>and</strong> 9% increase in operating cost <strong>and</strong> fuel consumption,<br />
respectively.<br />
These divergent requirements <strong>for</strong> min-NOx <strong>and</strong> min-fuel designs<br />
are well illustrated by a wide, <strong>and</strong> very smooth, Pareto front. As<br />
a result of the lower cruise Mach number, wing sweep is reduced<br />
from 34 to 19 deg <strong>for</strong> the min-NOx aircraft. With significantly reduced<br />
available thrust, the wing taper ratio is increased from 0.10<br />
to 0.21 to increase the maximum lift coefficient during takeoff <strong>and</strong><br />
initial climb. For similar reasons, the wing area is enlarged by 23%,<br />
contributing to an increase in maximum takeoff weight of 13%.<br />
Combined with lower available thrust, the climb per<strong>for</strong>mance of<br />
the min-NOx design is significantly deteriorated: thrust-to-weight<br />
ratio drops to 0.290, resulting in the highest cumulative certification<br />
noise of any design, over 3.5 dB louder than the baseline design A.<br />
The large fan necessary to reduce noise to the minimum (design<br />
D, with a bypass ratio very close to the maximum allowable value<br />
of 15) requires more power, resulting in the selection of the highest<br />
allowable combustion temperatures <strong>and</strong> overall engine pressure ratio.<br />
The result is a 15 cumulative EPNdB reduction in noise relative<br />
to the min-cost design, equivalent to a 25-fold reduction in noise<br />
energy distributed over the three certification points. The penalty<br />
is a 26% increase in operating cost <strong>and</strong> 16% in fuel carried, along<br />
with NOx emissions that are 33% higher because of the increased<br />
combustion temperature.<br />
In a bid to reduce noise, the sea-level static thrust is raised from<br />
68,404 to 100,000 lb (the maximum allowable), a 46% increase.<br />
This higher thrust enables the aircraft to climb faster, increasing the<br />
distance to the flyover certification point <strong>and</strong> decreasing measured<br />
noise. These enormous, <strong>and</strong> there<strong>for</strong>e very heavy, engines cause a<br />
27% maximum takeoff weight increase relative to design A. The<br />
large frontal area, <strong>and</strong> there<strong>for</strong>e increased drag of the design, leads<br />
the aircraft to fly slower than the min-cost c<strong>and</strong>idate (Mach 0.66 vs<br />
Mach 0.83). Similarly to the min-NOx aircraft, the reduced cruise<br />
Mach number results in a reduced sweep of 14 deg. A summary<br />
quantifying the trades between designs is shown in Table 4.<br />
Table 4 Fuel carried, LTO NOx, orcumulative noise can be<br />
traded with operating cost<br />
For this<br />
Can reduce one of these by<br />
increase in Cumulative<br />
cost, % Fuel carried, % LTO NOx ,% noise, EPNdB<br />
1 7 10 3<br />
2 10 25 6<br />
9 10 54 10<br />
25 10 54 15<br />
The importance of fuel consumption in operating costs is readily<br />
apparent when comparing the first two columns of Table 4. The<br />
trade space between these two objectives is very limited, as it is<br />
possible to reduce fuel consumption by only 10%, regardless of the<br />
increase in operating cost. It is also worthwhile to note the high<br />
cost of decreasing cumulative noise. For a 2% increase in operating<br />
cost, LTO NOx could be reduced by as much as 25%, whereas a<br />
cumulative noise reduction of only 6 EPNdB could be attained at<br />
a similar cost. These figures illustrate the fundamental difficulties<br />
associated with noise reduction at the source <strong>and</strong> point toward the<br />
benefits of noise shielding as an alternative reduction mechanism.<br />
Cruise Emissions vs LTO NOx Emissions<br />
To explore the interrelationship between the conflicting requirements<br />
of reducing NOx <strong>and</strong> fuel-based emissions (CO2, H2O, <strong>and</strong><br />
SO2), the multiobjective optimizer was applied to the min-NOx/minfuel<br />
problem. The resulting Pareto front is shown in Fig. 9, with<br />
design B (min-fuel) <strong>and</strong> design C (min-NOx) the extreme points<br />
discussed earlier.<br />
According to these results, a decrease in LTO NOx of 12% (as<br />
recommended by ICAO <strong>for</strong> new aircraft after 2008 under CAEP/6)<br />
would require an increase of approximately 1.5% in fuel consumption<br />
<strong>and</strong> related emissions. As the dem<strong>and</strong> <strong>for</strong> reductions in NOx<br />
increases, this penalty grows: the next 12% require a further 3.5%<br />
increase in fuel. These results illustrate the delicate tradeoff that<br />
must be resolved as new regulations come into play: What is the<br />
“value” of trading one type of emissions <strong>for</strong> another?<br />
Noise vs Cruise vs LTO NOx Emissions<br />
This tradeoff approach is exp<strong>and</strong>ed to include a third objective,<br />
cumulative noise. The surface that is obtained <strong>and</strong> the location of<br />
the three extreme points are shown in Fig. 10. Note that all objective<br />
data are shown in quantities relative to the extreme design at<br />
which they are maximum. The conflicting design requirements <strong>for</strong>
2106 ANTOINE AND KROO<br />
Fig. 9 Pareto front of LTO NOx vs fuel carried. Only rank 1 designs are shown (average rank = 3.47).<br />
Fig. 10 Pareto surface of LTO NOx vs fuel carried vs cumulative noise.<br />
Only rank 1 designs are shown.<br />
the min-noise (design D) <strong>and</strong> min-NOx (design C) aircraft are well<br />
illustrated here: the min-noise aircraft is the design with highest<br />
NOx, <strong>and</strong>, conversely, the aircraft with lowest NOx is the noisiest.<br />
Indeed, designs D <strong>and</strong> C are costly to obtain <strong>and</strong> require almost<br />
complete deterioration of the other two objectives. The minimum<br />
fuel design (design B), however, is obtained without entirely <strong>for</strong>going<br />
reductions in noise or NOx emissions.<br />
The usefulness of this Pareto surface is not limited to the extreme<br />
designs. Every design on the surface is optimized <strong>for</strong> a combination<br />
of noise, fuel, <strong>and</strong> NOx per<strong>for</strong>mance; the impact of reducing<br />
one objective on the two others can be estimated directly from the<br />
surface. Displaying three objectives also allows the selection of the<br />
objective to <strong>for</strong>ego in order to improve the design. If the goal is to<br />
trade noise <strong>and</strong> fuel efficiency <strong>for</strong> a 20% decrease in NOx, <strong>for</strong> example,<br />
a whole family of designs is applicable. Each aircraft features a<br />
different fuel <strong>and</strong> noise trade to attain the desired reduction in NOx.<br />
The final decision <strong>for</strong> selecting the appropriate design lies with the<br />
user: higher-level in<strong>for</strong>mation, such as certification or operational<br />
requirements, is required.<br />
Cruise Altitude Study<br />
Reducing the cruise altitude of commercial aircraft would reduce<br />
contrail <strong>for</strong>mation <strong>and</strong> potentially reduce the net impact of aircraft<br />
emissions. Today’s aircraft operate at 30,000–40,000 ft, the optimal<br />
altitudes considering range <strong>and</strong> cruise speed. To minimize the impact<br />
Fig. 11 <strong>Aircraft</strong> optimized <strong>for</strong> cruise altitudes of 28,000 ft (design E)<br />
<strong>and</strong> 24,000 ft (design F).<br />
Table 5 Data <strong>for</strong> the cost-optimized designs with initial cruise<br />
altitude fixed at 28,000 ft (design E) <strong>and</strong> 24,000 ft (design F)<br />
compared to the optimized design <strong>for</strong> minimum cost (design A)<br />
Parameter <strong>Design</strong> A <strong>Design</strong> E <strong>Design</strong> F<br />
Objectives<br />
Relative cost 1.00 1.04 1.07<br />
Fuel carried, lb 119,018 112,950 127,069<br />
LTO NOx ,kg 30.88 31.74 29.85<br />
Relative noise, EPNdB 0.0 −3.87 1.85<br />
Variables<br />
Max. takeoff weight, lb 372,539 357,802 374,525<br />
Wing reference area, ft 2 3,461 2,955 3,502<br />
Wing t/c, % 11.7 14.8 13.6<br />
Wing location, % 39.2 40.6 39.2<br />
Wing aspect ratio 7.38 9.39 8.15<br />
Wing taper ratio 0.10 0.10 0.22<br />
Wing sweep, deg 33.70 29.41 29.51<br />
Horizontal tail area, ft 2 929 778 732<br />
SLS thrust, lb 68,404 71,106 63,602<br />
Turbine inlet temp., ◦ F 3,203 3,220 3,228<br />
Bypass ratio 9.59 9.88 9.59<br />
Engine pressure ratio 59.91 59.61 60.00<br />
Init. cruise altitude, ft 32,937 28,000 24,000<br />
Final cruise altitude, ft 40,790 33,023 29,531<br />
Cruise Mach number 0.844 0.762 0.728<br />
on fuel economy, the aircraft needs to be designed to operate at these<br />
altitudes. The single-objective version of the genetic algorithm was<br />
run with the initial cruise altitude fixed to 24,000 <strong>and</strong> 28,000 ft. A<br />
maximum cruise climb of 4000 ft is allowed. Data <strong>for</strong> the optimized<br />
designs are shown in Table 5. As expected, designs E <strong>and</strong> F are<br />
designed to fly slower (Mach 0.762 <strong>and</strong> 0.728 <strong>for</strong> designs E <strong>and</strong><br />
F, respectively) to negotiate the increased drag inherent to lower<br />
altitude cruise. The overall geometry of the aircraft is shown in<br />
Fig. 11.
ANTOINE AND KROO 2107<br />
Fig. 12 Impact of increasing fuel cost by 25% is reflected on the fuel-operating cost Pareto front.<br />
The corresponding increase in operating cost is 4% <strong>for</strong> design E<br />
<strong>and</strong> 7% <strong>for</strong> design F. The amount of fuel carried is decreased by 5%<br />
if the aircraft is designed to fly at 28,000 ft, a similar altitude to the<br />
aircraft optimized <strong>for</strong> min-fuel, design B. This cruise altitude seems<br />
to offer the best tradeoff between drag <strong>and</strong> thrust lapse, there<strong>for</strong>e<br />
minimizing the fuel requirements. On the other h<strong>and</strong>, the higher<br />
drag of operating the aircraft at a lower design altitude of 24,000 ft<br />
results in a 7% increase in fuel carried.<br />
Changes in NOx production are minimal: with all three designs<br />
optimized <strong>for</strong> minimal operating cost, the optimizer is driven to<br />
select high pressure ratios <strong>and</strong> combustion temperatures, regardless<br />
of cruise altitude.<br />
The purpose of operating aircraft at lower altitudes would be to<br />
reduce the net impact of the emissions on the atmosphere. Accurately<br />
estimating these net effects requires more in<strong>for</strong>mation than<br />
the amount of emissions generated by the engines. To truly underst<strong>and</strong><br />
the effects of the combustion products on the atmosphere, a<br />
detailed study of the propagation <strong>and</strong> absorption characteristics of<br />
the troposphere is required. This study, however, shows probable<br />
costs impacts to aircraft that might in the future have to cruise at<br />
lower altitudes when the effects of contrails are more fully understood<br />
<strong>and</strong> regulated.<br />
Contribution of Fuel Cost to Total Cost<br />
The impact of fuel cost on the aircraft design can be investigated<br />
using the design tool. By increasing the cost of fuel by 25%, from<br />
$0.96 per gallon to $1.20 per gallon, the Pareto front illustrating the<br />
optimal tradeoff between fuel carried <strong>and</strong> operating cost is shifted<br />
toward higher operating costs (Fig. 12).<br />
<strong>Design</strong> B (min-fuel carried at $0.96 per gallon) <strong>and</strong> design H<br />
(min-fuel carried at $1.20 per gallon) carry an essentially identical<br />
fuel load: both are optimized <strong>for</strong> minimum fuel carried, regardless<br />
of fuel cost.<br />
The minimum cost design with fuel at $1.20 per gallon (design<br />
G), on the other h<strong>and</strong>, carries 2% less fuel than the minimum cost<br />
design at $0.96 per gallon (design A): with increasing fuel costs,<br />
designs that carry less fuel are preferred. The decreased drag that<br />
yields this reduction in required fuel stems from the lower cruise<br />
speed (0.832 vs 0.844), which, however, causes an increase in block<br />
time <strong>and</strong> overall operating costs. Overall, the 25% increase in fuel<br />
price results in only a 3% increase in operating cost. The two minfuel<br />
<strong>and</strong> min-cost aircraft are geometrically very similar, reflecting<br />
the relatively low importance of fuel cost as a design driver (Table 6).<br />
Impact of Future Technologies<br />
Increased laminar flow, greater use of composites in the aircraft<br />
structure, <strong>and</strong> reduced induced drag are three examples of advanced<br />
technologies studied with the design tool: 1) increased laminar<br />
Table 6 Data <strong>for</strong> the optimized designs with fuel cost at $0.96 per<br />
gallon (designs A <strong>and</strong> B) <strong>and</strong> $1.20 per gallon (designs G <strong>and</strong> H)<br />
<strong>Design</strong> A <strong>Design</strong> B <strong>Design</strong> G <strong>Design</strong> H<br />
Parameter min cost min fuel min cost min fuel<br />
Fuel cost, $/gallon 0.96 0.96 1.20 1.20<br />
Objectives<br />
Relative cost 1.0 1.02 1.03 1.04<br />
Fuel Carried, lb 119,018 106,707 116,592 106,430<br />
LTO NOx ,kg 30.88 29.68 30.18 28.30<br />
Relative noise, EPNdB 0.0 −5.13 −1.49 −5.90<br />
Variables<br />
Max. takeoff weight, lb 372,539 352,515 367,881 356,868<br />
Wing reference area, ft 2 3,461 2,942 3,451 3,184<br />
Wing t/c, % 11.7 13.5 12.7 13.7<br />
Wing location, % 39.2 41.2 38.6 40.4<br />
Wing aspect ratio 7.38 9.99 7.54 9.97<br />
Wing taper ratio 0.10 0.10 0.10 0.10<br />
Wing sweep, deg 33.70 26.17 34.59 27.31<br />
Horizontal tail area, ft 2 929 766 882 779<br />
SLS thrust (per engine), lb 68,404 67,311 67,791 64,732<br />
Thrust-to-weight ratio 0.367 0.382 0.369 0.363<br />
Turbine inlet temp., ◦ F 3,203 3,215 3,219 3,220<br />
Bypass ratio 9.59 10.35 10.30 10.98<br />
Engine pressure ratio 59.91 59.63 59.91 59.79<br />
Init. cruise altitude, ft 32,937 30,746 32,198 30,805<br />
Final cruise altitude, ft 40,790 38,734 41,668 39,219<br />
Cruise Mach number, 0.844 0.739 0.832 0.755<br />
flow—<strong>for</strong> wing sweeps under 20 deg, laminar flow extends over<br />
60% of the chord; 2) composite structure—a factor of 0.8 is applied<br />
to the aircraft structural weight; <strong>and</strong> 3) 10% reduction in induced<br />
drag.<br />
These technologies, meant to improve aerodynamic efficiency or<br />
reduce structural weight, are of interest because they also have significant<br />
impact on the environmental per<strong>for</strong>mance of the aircraft.<br />
Figure 13 illustrates the changes to the aircraft fuel-NOx per<strong>for</strong>mance.<br />
Data <strong>for</strong> the extreme designs are summarized in Table 7.<br />
The advanced technology min-NOx aircraft (design K) produces<br />
34% less NOx per LTO cycle than the conventional min-NOx aircraft<br />
(design C), at 9% lower operating cost.<br />
Similarly, the advanced min-fuel c<strong>and</strong>idate (design J) requires<br />
27% less fuel (<strong>and</strong> there<strong>for</strong>e produces 27% fewer fuel-proportional<br />
emissions) to complete the mission while releasing 32% fewer NOx<br />
emissions than the conventional min-fuel aircraft (design B). Taking<br />
advantage of the drag benefits associated with increased laminar<br />
flow, the two advanced designs feature wing sweep under 20 deg,<br />
without any impact on cruise Mach number, a benefit of the thinner<br />
wing af<strong>for</strong>ded by the reduced fuel capacity requirement.
2108 ANTOINE AND KROO<br />
Fig. 13 Benefits of increased laminar flow, reduced induced drag, <strong>and</strong> lower structural weight are illustrated on the fuel-cost Pareto front.<br />
Table 7 Data <strong>for</strong> optimized min-fuel <strong>and</strong> min-NOx conventional<br />
designs B <strong>and</strong> C <strong>and</strong> advanced technology designs J <strong>and</strong> K<br />
<strong>Design</strong> B <strong>Design</strong> C <strong>Design</strong> J <strong>Design</strong> K<br />
Parameter min fuel min NOx min fuel min NOx<br />
Objectives<br />
Relative cost 1.02 1.09 0.96 1.00<br />
Fuel carried, lb 106,707 134,796 78,243 87,485<br />
LTO NOx ,kg 29.68 14.36 20.18 9.47<br />
Relative noise, EPNdB −5.13 3.66 −5.50 −0.80<br />
Variables<br />
Max. takeoff weight, lb 352,515 407,516 304,611 333,634<br />
Wing reference area, ft 2 2,942 3,887 3,122 3,855<br />
Wing t/c, % 13.5 12.8 12.9 12.8<br />
Wing location, % 41.2 48.1 41.3 44.7<br />
Wing aspect ratio 9.99 8.94 10.00 9.96<br />
Wing taper ratio 0.10 0.39 0.10 0.21<br />
Wing sweep, deg 26.17 11.22 19.81 12.10<br />
Horizontal tail area, ft 2 766 953 870 1,099<br />
SLS thrust (per engine), lb 67,311 60,264 46,525 41,120<br />
Thrust-to-weight ratio 0.382 0.296 0.422 0.246<br />
Turbine inlet temp., ◦ F 3,215 3,147 3,222 3,135<br />
Bypass ratio 10.35 10.32 11.50 12.18<br />
Engine pressure ratio 59.63 40.27 59.36 40.05<br />
Init. cruise altitude, ft 30,746 28,381 32,372 30,114<br />
Final cruise altitude, ft 38,734 33,288 40,097 38,718<br />
Cruise Mach number 0.739 0.669 0.725 0.669<br />
Incorporating these advanced technologies negates some of the<br />
adverse effects of optimizing the aircraft <strong>for</strong> min-noise or minemissions.<br />
Indeed, the advanced min-NOx aircraft (design K) generates<br />
30% of the NOx emissions generated by the conventional<br />
min-cost design (design A), at the same operating cost. From the<br />
reduced structural weight <strong>and</strong> fuel load (<strong>and</strong> there<strong>for</strong>e maximum<br />
takeoff weight), the two advanced designs require approximately<br />
30% less installed thrust, resulting in a cumulative noise reduction<br />
of 5.5 EPNdB <strong>for</strong> design J <strong>and</strong> 0.8 EPNdB <strong>for</strong> design K.<br />
One advantage of the design tool is that the Pareto front can be<br />
used to decide which objective(s) should benefit from these advanced<br />
technologies. This further illustrates the role of tradeoffs<br />
early in the design phase.<br />
Conclusions<br />
The objective of this research was to determine the feasibility of<br />
including environmental per<strong>for</strong>mance during the initial phase of aircraft<br />
design. A design tool was developed using a multidisciplinary,<br />
multiobjective genetic algorithm to quantify the tradeoffs between<br />
aircraft noise, emissions, <strong>and</strong> operating cost at the conceptual design<br />
level. In-house conceptual design tools, as well as engine <strong>and</strong> noise<br />
models available from NASA, were integrated into the optimization<br />
framework. The application of this design approach was successful<br />
in producing optimal solutions <strong>and</strong> Pareto fronts illustrating the trade<br />
space of these designs. The ability of a conceptual tool to predict the<br />
consequences of design changes, however, is heavily dependent on<br />
validation: because of the uncertainty in modeling noise <strong>and</strong> emissions,<br />
it is important that the design tool be compared to additional<br />
experimental results <strong>and</strong> existing, usually proprietary, databases.<br />
The study established a tradeoff between noise, emissions, <strong>and</strong><br />
cost per<strong>for</strong>mance. The resolution of these diverging requirements<br />
will largely depend on the environmental regulations applying to the<br />
markets served by the aircraft. Significant reductions in emissions<br />
<strong>and</strong> perceived noise were found to be possible <strong>for</strong> aircraft specifically<br />
optimized with these objectives in mind. For an increase in<br />
operating cost of 9%, NOx emissions could be reduced by as much<br />
as 51%, whereas cumulative certification noise could be lowered by<br />
15 EPNdB <strong>for</strong> a cost increase of 25%. With total fuel consumption<br />
as an objective, a decrease in CO2 <strong>and</strong> other fuel-related emissions<br />
of 10% is feasible, albeit at an increase in cost of 2%. Quantifying<br />
these trades with tools similar to the one described will become<br />
essential as stricter regulations are adopted.<br />
The relative importance of reducing one emission level over another<br />
requires significant studies into the mechanisms of the global<br />
atmosphere. Indeed, with the eventual adoption of cruise emissions<br />
restrictions, developing an appropriate metric is essential. As we<br />
have seen, simply quantifying the amount of emissions generated<br />
by the aircraft is not sufficient; the properties of the atmosphere<br />
mean that the diffusion <strong>and</strong> mixing of the emissions are crucial. Accurate<br />
models of these mechanisms near the troposphere are critical<br />
in underst<strong>and</strong>ing the net impact of aircraft emissions on the global<br />
atmosphere, particularly <strong>for</strong> contrails. Further enhancing the design<br />
tool by incorporating the details of the mission profile would also<br />
allow a more accurate estimate of the emissions release schedule.<br />
Finally, assessing the changes to airspace capacity caused by lower<br />
<strong>and</strong> slower aircraft would be essential. In addition to new challenges<br />
<strong>for</strong> air traffic control, integrating these new designs with potentially<br />
vastly different cruise speeds would require extensive schedule <strong>and</strong><br />
equipment assignment changes.<br />
As noise <strong>and</strong> emissions become ever more important design<br />
drivers, unconventional designs might offer the only viable solution<br />
to ensure commercial aviation continues its spectacular growth. In<br />
addition, unconventional aircraft might eventually offer truly ultraquiet<br />
<strong>and</strong> clean operations, potentially revolutionizing air transport<br />
by enabling aircraft to operate closer to major cities than ever be<strong>for</strong>e.
The one trend that emerges from this research among the seemingly<br />
conflicting objectives of noise, fuel consumption, <strong>and</strong> NOx<br />
emissions is the opportunity <strong>for</strong> significant reductions in environmental<br />
impact by designing the aircraft to fly slower <strong>and</strong> at lower<br />
altitude. The larger fan frontal area of min-noise designs, the reduced<br />
thrust capabilities of min-NOx engines, <strong>and</strong> the reduced drag<br />
m<strong>and</strong>ated by the min-fuel aircraft: all of these requirements point<br />
toward “slower, lower, greener.”<br />
Acknowledgments<br />
This work was made possible by a grant from the NASA John<br />
H. Glenn Research Center at Lewis Field. CAFFE was developed<br />
<strong>and</strong> provided by Desktop Aeronautics, Inc. The authors gratefully<br />
acknowledge the contributions to this work by our colleagues at<br />
Stan<strong>for</strong>d University, the Massachusetts Institute of Technology, <strong>and</strong><br />
the NASA Langley <strong>and</strong> Glenn Research centers.<br />
References<br />
1Penner, J. E., Aviation <strong>and</strong> the Global Atmosphere, Cambridge Univ.<br />
Press, Cambridge, Engl<strong>and</strong>, U.K., 1999, pp. 1–15.<br />
2Pacull, M., “Transport <strong>Aircraft</strong> Noise Technologies,” Proceedings of<br />
the International Symposium: Which Technologies <strong>for</strong> Future <strong>Aircraft</strong> Noise<br />
Reduction?, Association Aéronautique et Astronautique de France, Verneuil<br />
sur Seine, France, 2002.<br />
3Antoine, N. E., “<strong>Aircraft</strong> Optimization <strong>for</strong> Minimal <strong>Environmental</strong> Impact,”<br />
Ph.D. Dissertation, Dept. of Aeronautics <strong>and</strong> Astronautics, Stan<strong>for</strong>d<br />
Univ., Stan<strong>for</strong>d, CA, Sept. 2004.<br />
4Sietzen, F., Jr., “New Blueprint <strong>for</strong> NASA Aeronautics,” Aerospace<br />
America, Aug. 2002, p. 25.<br />
5Erickson, J. D., “<strong>Environmental</strong> Acceptability,” Office of Environment<br />
<strong>and</strong> Energy, presented to the Federal Aviation Administration, Washington,<br />
DC, 2000.<br />
6Smith, M. J. T., <strong>Aircraft</strong> Noise, Cambridge Univ. Press, Cambridge,<br />
Engl<strong>and</strong>, U.K., 1989.<br />
7ICAO Annex 16 Volume I—<strong>Aircraft</strong> Noise, 3rd ed., International Civil<br />
Aviation Organization, Montreal, 1993.<br />
ANTOINE AND KROO 2109<br />
8Gillian, R. E., <strong>Aircraft</strong> Noise Prediction Program User’s Manual,NASA<br />
Langley Research Center, Hampton, VA, 1982.<br />
9Zorumski, W. E., <strong>Aircraft</strong> Noise Prediction Program Theoretical Manual,<br />
Parts 1 <strong>and</strong> 2, NASA TM-83199-PT-1 <strong>and</strong> PT-2, Feb. 1982.<br />
10Antoine, N. E., <strong>and</strong> Kroo, I. M., “<strong>Aircraft</strong> Optimization <strong>for</strong> Minimal<br />
<strong>Environmental</strong> Impact,” Journal of <strong>Aircraft</strong>, Vol. 41, No. 4, 2004,<br />
pp. 790–797.<br />
11Penner, J. E., Aviation <strong>and</strong> the Global Atmosphere, Cambridge Univ.<br />
Press, Cambridge, Engl<strong>and</strong>, U.K., 1999, p. 6.<br />
12ICAO Annex 16 Volume II—<strong>Aircraft</strong> Engine Emissions, 2nd ed., International<br />
Civil Aviation Organization, Montreal, 1993.<br />
13Lefebvre, A., Gas Turbine Combustion, Taylor <strong>and</strong> Francis, Philadelphia,<br />
1999, pp. 331–335.<br />
14Penner, J. E., Aviation <strong>and</strong> the Global Atmosphere, Cambridge Univ.<br />
Press, Cambridge, Engl<strong>and</strong>, U.K., 1999, pp. 76–79.<br />
15Penner, J. E., Aviation <strong>and</strong> the Global Atmosphere, Cambridge Univ.<br />
Press, Cambridge, Engl<strong>and</strong>, U.K., 1999, p. 257.<br />
16Garrison, M., DuBois, D., <strong>and</strong> Baughcum, S., “<strong>Aircraft</strong> Emission Inventories<br />
& Scenarios,” Ultra-Efficient Engine Technology Program (UEET)<br />
Technology Forum, Oct. 2003.<br />
17Kroo, I. M., “An Interactive System <strong>for</strong> <strong>Aircraft</strong> <strong>Design</strong> <strong>and</strong> Optimization,”<br />
AIAA Paper 92-1190, Feb. 1992.<br />
18Klann, J. L., <strong>and</strong> Snyder, C. A., NEPP User’s Manual, NASA, March<br />
1997.<br />
19 “St<strong>and</strong>ard Method of Estimating Comparative Direct Operating Costs<br />
of Turbine Powered Transport Airplanes,” Air Transportation Association<br />
of America, Washington, DC, Dec. 1967.<br />
20Schaufele, R., The Elements of <strong>Aircraft</strong> Preliminary <strong>Design</strong>, Aries Publixations,<br />
Santa Ana, CA, 2000, pp. 311–323.<br />
21Kroo, I. M., <strong>and</strong> Manning, V. M., “Collaborative Optimization: Status<br />
<strong>and</strong> Directions,” AIAA Paper 2000-4721, Sept. 2000.<br />
22Goldberg, D. E., Genetic Algorithms in Search, Optimization, <strong>and</strong> Machine<br />
Learning, Addison Wesley Longman, Boston, 1989.<br />
23Deb, K., Multi-Objective Optimization Using Evolutionary Algorithms,<br />
Wiley, Hoboken, NJ, 2001.<br />
M. Ahmadian<br />
Associate Editor