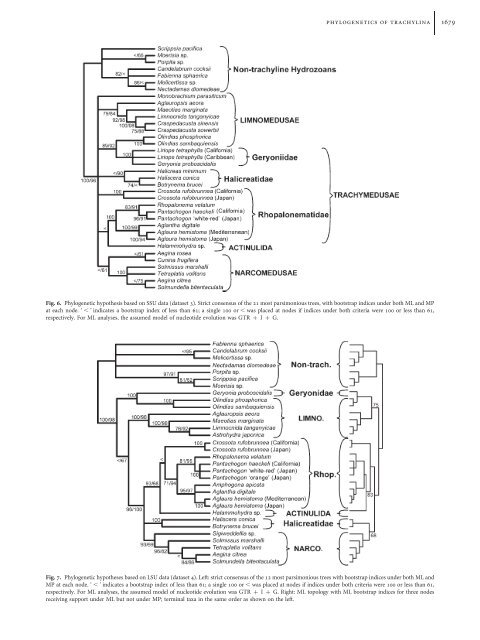
1678 allen g. collins et al.Fig. 5. Phylogenetic hypothesis based on mitochondrial 16S data (dataset 2). Phylogram <strong>of</strong> one <strong>of</strong> the 20 most parsimonious trees, <strong>with</strong> bootstrap indices underboth ML and MP at each node. ‘ , ’ indicates a bootstrap index <strong>of</strong> less than 61; a single 100 or , was placed at nodes if indices under both criteria were 100 or lessthan 61, respectively. For ML analyses, the assumed model <strong>of</strong> nucleotide evolution was K81uf þ I þ G. Scale bar is equivalent to 20 substitutions.or LSU had successfully been derived (Table 1; Figure 8), as wellas the seven outgroup hydroidolinans for which all threemarkers were available. For this dataset, two chimericalsequences were constructed. Mitochondrial 16S fromSolmundella bitentaculata from Antarctica was combined<strong>with</strong> nuclear SSU and LSU <strong>of</strong> S. bitentaculata from theMediterranean Sea. Mitochondrial 16S from Pantachogonhaeckeli from the central coast <strong>of</strong> California was combined<strong>with</strong> un-vouchered Genbank SSU and LSU sequences derivedfrom P. haeckeli from Californian coastal waters.Phylogenetic analysesPhylogenetic hypotheses were constructed under bothmaximum likelihood (ML) and maximum parsimony (MP)optimality criteria. Modeltest (Posada & Crandall, 1998) wasused, employing the Akaike information criterion, to choosethe most appropriate model for each <strong>of</strong> the datasets.Assuming these models, PAUP (Sw<strong>of</strong>ford, 2002) was usedto search (<strong>with</strong> 100 random addition replicates) for the topology<strong>with</strong> the greatest likelihood and GARLI v0.951(Zwickl, 2006) was used to calculate ML bootstrap indicesfrom searches for 500 replicate datasets. PAUP was furtheremployed to find most parsimonious topologies, <strong>with</strong> 100random replicate searches and to calculate bootstrap indices(500 replicates, <strong>with</strong> 10 searches per replicate).R E S U L T SIn general, ML and MP topologies are congruent, only differingwhere bootstrap values are low under one or both criteria.Topologies, either ML or MP, for each <strong>of</strong> the five datasets arepresented as Figures 4–8. In addition, both ML and MP bootstrapindices are reported on these figures at each <strong>of</strong> the relevantnodes. Two main results are drawn from Figure 4 showing theML topology for the combined SSU and LSU analysis includingnon-hydrozoan taxa as outgroups. First, the representative <strong>of</strong>Actinulida, Halammohydra sp., does not appear to be an earlydiverging lineage <strong>of</strong> <strong>Hydrozoa</strong>, but is instead revealed as amember<strong>of</strong><strong>Trachylina</strong>.Second,Microhydrulalimopsicola(classifiedin the family Microhydrulidae <strong>with</strong>in Limnomedusae) isshown to not be a member <strong>of</strong> <strong>Hydrozoa</strong> at all, but instead tohave a very close relationship to the stauromedusanHaliclystus octoradiatus.Figure 5 presents one <strong>of</strong> 20 MP trees based on our 16S data.Generally, nodes in the topology do not receive high support.There is a well-supported split between two clades, one containingspecies <strong>of</strong> Limnomedusae plus species <strong>of</strong> the trachymedusanfamily Geryoniidae and the other comprising allthe remaining trachymedusans, narcomedusans and the actinulidanHalammohydra sp. Other phylogenetic associationsthat receive method-independent (i.e. both MP and ML)support include: the limnomedusan genera Limnocnida and
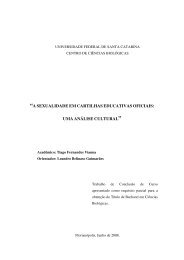
phylogenetics <strong>of</strong> trachylina 1679Fig. 6. Phylogenetic hypothesis based on SSU data (dataset 3). Strict consensus <strong>of</strong> the 21 most parsimonious trees, <strong>with</strong> bootstrap indices under both ML and MPat each node. ‘ , ’ indicates a bootstrap index <strong>of</strong> less than 61; a single 100 or , was placed at nodes if indices under both criteria were 100 or less than 61,respectively. For ML analyses, the assumed model <strong>of</strong> nucleotide evolution was GTR þ I þ G.Fig. 7. Phylogenetic hypotheses based on LSU data (dataset 4). Left: strict consensus <strong>of</strong> the 12 most parsimonious trees <strong>with</strong> bootstrap indices under both ML andMP at each node. ‘ , ’ indicates a bootstrap index <strong>of</strong> less than 61; a single 100 or , was placed at nodes if indices under both criteria were 100 or less than 61,respectively. For ML analyses, the assumed model <strong>of</strong> nucleotide evolution was GTR þ I þ G. Right: ML topology <strong>with</strong> ML bootstrap indices for three nodesreceiving support under ML but not under MP; terminal taxa in the same order as shown on the left.