<strong>ETF</strong> <strong>Landscape</strong> April 20<strong>10</strong><strong>Celebrat<strong>in</strong>g</strong> <strong>10</strong> <strong>Years</strong> <strong>of</strong> <strong>ETF</strong>s <strong>in</strong> <strong>Europe</strong> from <strong>BlackRock</strong>Private equity <strong>ETF</strong>s: the first private equity <strong>ETF</strong> was launched <strong>in</strong>October 2006. Private equity firms raise capital primarily from<strong>in</strong>stitutional <strong>in</strong>vestors such as pension funds, banks, <strong>in</strong>surancecompanies, endowments, family <strong>of</strong>fices, funds <strong>of</strong> funds andfoundations to <strong>in</strong>vest <strong>in</strong> venture capital, buy-outs and specialsituations (distressed companies). Typically, private equitycompanies <strong>in</strong>vest <strong>in</strong> high growth, start-up companies or acquirebus<strong>in</strong>esses where superior efficiencies could be achieved.Real estate <strong>ETF</strong>s: the first real estate <strong>ETF</strong> was launched <strong>in</strong> theUnited States <strong>in</strong> June 2000. The exist<strong>in</strong>g range <strong>of</strong> real estate <strong>ETF</strong>s<strong>in</strong>clude listed real estate companies and Real Estate InvestmentTrusts (REITs) which own and usually actively manage <strong>in</strong>comeproduc<strong>in</strong>gcommercial real estate. REITs are typically required topay out at least 90% <strong>of</strong> all taxable <strong>in</strong>come, provid<strong>in</strong>g dividend<strong>in</strong>come to <strong>in</strong>vestors, along with the potential for long term shareprice appreciation. There are several <strong>ETF</strong>s available allow<strong>in</strong>g<strong>in</strong>vestors to ga<strong>in</strong> global, regional or s<strong>in</strong>gle country REIT exposure.Dividend <strong>ETF</strong>s: the first dividend weighted <strong>ETF</strong> was launched <strong>in</strong>November 2003. Several <strong>ETF</strong> providers have structured <strong>ETF</strong>s byselect<strong>in</strong>g and weight<strong>in</strong>g the constituents based on dividend yield orabsolute dividend payments. Some research suggests that dividendweighted <strong>in</strong>dices generate higher cumulative returns with lowervolatility than comparable standard market cap weighted <strong>in</strong>dicesover the long term. There are many <strong>ETF</strong>s provid<strong>in</strong>g dividendweighted global, regional, s<strong>in</strong>gle country and emerg<strong>in</strong>g marketsexposure with Total Expense Ratios (TERs) rang<strong>in</strong>g from 0.25%to 0.75%.Fundamental <strong>ETF</strong>s: the first fundamental factor weighted <strong>ETF</strong> waslaunched <strong>in</strong> May 2000. Fundamental factors such as sales, cashflow, book value, dividends, earn<strong>in</strong>gs, and employees, are<strong>in</strong>creas<strong>in</strong>gly be<strong>in</strong>g used to create new <strong>in</strong>dices. It has been arguedthat traditional market cap weighted <strong>in</strong>dices are systematically<strong>in</strong>efficient by overweight<strong>in</strong>g overvalued stocks and underweight<strong>in</strong>gundervalued stocks.Sector <strong>ETF</strong>s: the first sector <strong>ETF</strong>s were launched <strong>in</strong> December1998 cover<strong>in</strong>g n<strong>in</strong>e United States economic sectors allow<strong>in</strong>g<strong>in</strong>vestors to ga<strong>in</strong> United States sector exposure or implementsector rotation strategies. Certa<strong>in</strong> sectors outperform <strong>in</strong> particularstages <strong>of</strong> the economic cycle. Sector rotation strategies aredesigned to beat the market by rotat<strong>in</strong>g the <strong>in</strong>vestment <strong>in</strong>to thesector which is expected to outperform <strong>in</strong> the given stage <strong>of</strong> theeconomic cycle. There are many <strong>ETF</strong>s provid<strong>in</strong>g global, regional, ands<strong>in</strong>gle country sector exposure with TERs rang<strong>in</strong>g from 0.12%to 1.50%.Inverse/leveraged <strong>ETF</strong>s: the first <strong>in</strong>verse or leveraged <strong>ETF</strong> waslaunched <strong>in</strong> February 2005. Leveraged <strong>ETF</strong>s are designed to provideup to 300% daily upside performance, while the <strong>in</strong>verse range <strong>of</strong><strong>ETF</strong>s provide one and two times daily reverse (short) <strong>in</strong>dexperformance. These <strong>ETF</strong>s can be used to magnify returns, hedgeportfolios and manage risk without the need for a marg<strong>in</strong> account ormarg<strong>in</strong> calls. TERs for these <strong>ETF</strong>s range from 0.40% to 1.60%.Global <strong>ETF</strong>s: the first global <strong>ETF</strong> was launched <strong>in</strong> August 1997 <strong>in</strong>New Zealand. Global <strong>ETF</strong>s allow <strong>in</strong>vestors to ga<strong>in</strong> diversifiedexposure to broad developed markets such as MSCI World whichtracks the performance <strong>of</strong> 23 developed countries. Internationaldiversification can m<strong>in</strong>imise the impact <strong>of</strong> economic downturnswith<strong>in</strong> <strong>in</strong>dividual countries or regions and reduce overall risk. Thereare global <strong>ETF</strong>s with TERs rang<strong>in</strong>g from 0.25% to 0.94%.Emerg<strong>in</strong>g Market <strong>ETF</strong>s: the first emerg<strong>in</strong>g market <strong>ETF</strong> waslaunched <strong>in</strong> March 1996. Emerg<strong>in</strong>g market countries are typicallycharacterised by rapid economic growth, volatility, immature<strong>in</strong>stitutions and political <strong>in</strong>stability. <strong>ETF</strong>s that track global emerg<strong>in</strong>gmarket <strong>in</strong>dices such as the MSCI Emerg<strong>in</strong>g Markets Index provide<strong>in</strong>vestors with diversified exposure to 25 EM countries. There aremany <strong>ETF</strong>s provid<strong>in</strong>g global, regional, and s<strong>in</strong>gle country emerg<strong>in</strong>gmarket exposure with TERs rang<strong>in</strong>g from 0.19% to 1.50%.Source: Various <strong>ETF</strong> Providers, Exchanges, Global <strong>ETF</strong> Research and Implementation Strategy Team, <strong>BlackRock</strong>.This document is not an <strong>of</strong>fer to buy or sell any security or to participate <strong>in</strong> any trad<strong>in</strong>g strategy. Please refer to important <strong>in</strong>formation and qualifications at the end <strong>of</strong> this material. 37
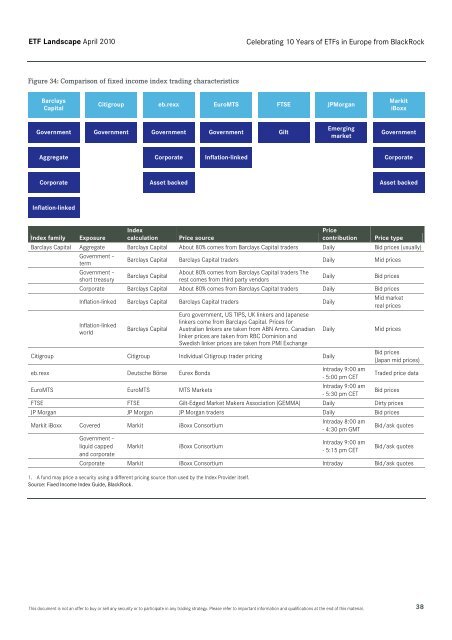
<strong>ETF</strong> <strong>Landscape</strong> April 20<strong>10</strong><strong>Celebrat<strong>in</strong>g</strong> <strong>10</strong> <strong>Years</strong> <strong>of</strong> <strong>ETF</strong>s <strong>in</strong> <strong>Europe</strong> from <strong>BlackRock</strong>Figure 34: Comparison <strong>of</strong> fixed <strong>in</strong>come <strong>in</strong>dex trad<strong>in</strong>g characteristicsBarclaysCapitalCitigroupeb.rexxEuroMTSFTSEJPMorganMarkitiBoxxGovernmentGovernmentGovernmentGovernmentGiltEmerg<strong>in</strong>gmarketGovernmentAggregate Corporate Inflation-l<strong>in</strong>ked CorporateCorporate Asset backed Asset backedInflation-l<strong>in</strong>kedIndex familyExposureIndexcalculationPrice sourcePricecontributionPrice typeBarclays Capital Aggregate Barclays Capital About 80% comes from Barclays Capital traders Daily Bid prices (usually)Government –termGovernment –short treasuryBarclays Capital Barclays Capital traders Daily Mid pricesBarclays CapitalAbout 80% comes from Barclays Capital traders Therest comes from third party vendorsDailyBid pricesCorporate Barclays Capital About 80% comes from Barclays Capital traders Daily Bid pricesInflation-l<strong>in</strong>ked Barclays Capital Barclays Capital traders DailyMid marketreal pricesInflation-l<strong>in</strong>kedworldBarclays CapitalEuro government, US TIPS, UK l<strong>in</strong>kers and Japanesel<strong>in</strong>kers come from Barclays Capital. Prices forAustralian l<strong>in</strong>kers are taken from ABN Amro. Canadianl<strong>in</strong>ker prices are taken from RBC Dom<strong>in</strong>ion andSwedish l<strong>in</strong>ker prices are taken from PMI ExchangeDailyMid pricesCitigroup Citigroup Individual Citigroup trader pric<strong>in</strong>g DailyBid prices(Japan mid prices)eb.rexx Deutsche Börse Eurex BondsIntraday 9:00 am- 5:00 pm CETTraded price dataEuroMTS EuroMTS MTS MarketsIntraday 9:00 am- 5:30 pm CETBid pricesFTSE FTSE Gilt-Edged Market Makers Association (GEMMA) Daily Dirty pricesJP Morgan JP Morgan JP Morgan traders Daily Bid pricesMarkit iBoxx Covered Markit iBoxx ConsortiumIntraday 8:00 am- 4:30 pm GMTBid/ask quotesGovernment –liquid cappedand corporateMarkitiBoxx ConsortiumIntraday 9:00 am- 5:15 pm CETBid/ask quotesCorporate Markit iBoxx Consortium Intraday Bid/ask quotes1. A fund may price a security us<strong>in</strong>g a different pric<strong>in</strong>g source than used by the Index Provider itself.Source: Fixed Income Index Guide, <strong>BlackRock</strong>.This document is not an <strong>of</strong>fer to buy or sell any security or to participate <strong>in</strong> any trad<strong>in</strong>g strategy. Please refer to important <strong>in</strong>formation and qualifications at the end <strong>of</strong> this material. 38