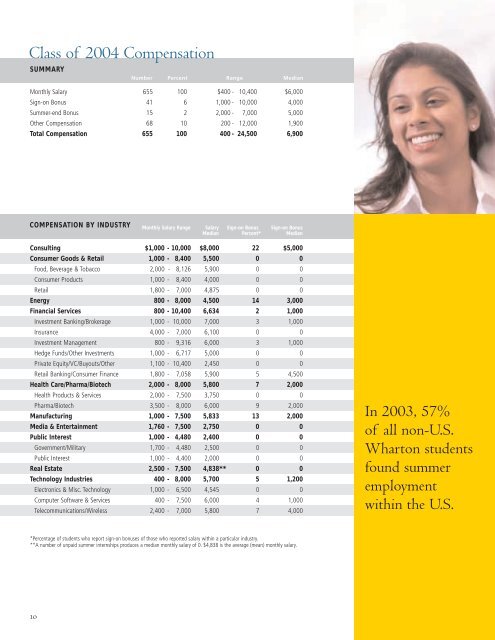
Class of 2004 CompensationSUMMARYNumber Percent Range MedianMonthly Salary 655 100 $400 - 10,400 $6,000Sign-on Bonus 41 6 1,000 - 10,000 4,000Summer-end Bonus 15 2 2,000 - 7,000 5,000Other Compensation 68 10 200 - 12,000 1,900Total Compensation 655 100 400 - 24,500 6,900COMPENSATION BY INDUSTRY Monthly Salary Range Salary Sign-on Bonus Sign-on BonusMedian Percent* MedianConsulting $1,000 - 10,000 $8,000 22 $5,000Consumer Goods & Retail 1,000 - 8,400 5,500 0 0Food, Beverage & Tobacco 2,000 - 8,126 5,900 0 0Consumer Products 1,000 - 8,400 4,000 0 0Retail 1,800 - 7,000 4,875 0 0Energy 800 - 8,000 4,500 14 3,000Financial Services 800 - 10,400 6,634 2 1,000Investment Banking/Brokerage 1,000 - 10,000 7,000 3 1,000Insurance 4,000 - 7,000 6,100 0 0Investment <strong>Management</strong> 800 - 9,316 6,000 3 1,000Hedge Funds/Other Investments 1,000 - 6,717 5,000 0 0Private Equity/VC/Buyouts/Other 1,100 - 10,400 2,450 0 0Retail Banking/Consumer Finance 1,800 - 7,058 5,900 5 4,500Health Care/Pharma/Biotech 2,000 - 8,000 5,800 7 2,000Health Products & Services 2,000 - 7,500 3,750 0 0Pharma/Biotech 3,500 - 8,000 6,000 9 2,000Manufacturing 1,000 - 7,500 5,833 13 2,000Media & Entertainment 1,760 - 7,500 2,750 0 0Public Interest 1,000 - 4,480 2,400 0 0Government/Military 1,700 - 4,480 2,500 0 0Public Interest 1,000 - 4,400 2,000 0 0Real Estate 2,500 - 7,500 4,838** 0 0Technology Industries 400 - 8,000 5,700 5 1,200Electronics & Misc. Technology 1,000 - 6,500 4,545 0 0Computer Software & Services 400 - 7,500 6,000 4 1,000Telecommunications/Wireless 2,400 - 7,000 5,800 7 4,000In <strong>2003</strong>, 57%of all non-U.S.<strong>Wharton</strong> studentsfound summeremploymentwithin the U.S.*Percentage of students who report sign-on bonuses of those who reported salary within a particular industry.**A number of unpaid summer internships produces a median monthly salary of 0. $4,838 is the average (mean) monthly salary.10
Puja Bhargava, WG’04Major: Marketing andStrategic <strong>Management</strong>Previous Education: B.B.A.in Finance,University of MichiganWork History: 6 years in investmentbanking at JPMorganChase & Co. in New York,Hong Kong, and LondonInternship: Gucci, Florence, ItalyOne of the reasons I wantedan <strong>MBA</strong> was because I wascontemplating making a careerswitch and specialize in a particulararea. Here at <strong>Wharton</strong>,you learn fundamentals,techniques, discipline behindtheories, and then you learnhow to apply them to realworld situations. I also likethe way <strong>Wharton</strong> deliversthe curriculum. I was ableto double major and takehigh-level electives, and inmarketing, we didn’t just takea 30,000 foot view — it wasquantitative too.COMPENSATION BY FUNCTIONMonthly Salary Range Salary Sign-on Bonus Sign-on BonusMedian Percent* MedianConsulting/Strategy $1,000 - 10,000 $7,000 15 $5,000Corporate Finance/Mergers & Acquisitions 800 - 9,300 7,000 5 2,000General/Project <strong>Management</strong>/<strong>Management</strong>Development/Rotational Program 400 - 8,000 6,000 0Investment Mgmt/Portfolio <strong>Management</strong> 800 - 8,000 5,375 0Operations/Production <strong>Management</strong> 1,000 - 6,900 3,333 0Product/Brand Marketing 600 - 7,900 5,500 4 1,100Product Development/Structuring 3,000 - 7,000 5,250 0Research 1,300 - 9,316 6,250 0Sales 1,760 - 7,500 7,080 5 1,000Trading 2,000 - 10,000 7,083 0*Percentage of students who report sign-on bonuses of those who reported salary within a particular function.LOCATION CHOICES AND COMPENSATIONPercent Monthly Salary Range Salary Median Sign-on BonusMedianUNITED STATES OF AMERICA 80.0 $600 - 10,400 $6,000 $3,000NORTHEAST 36.9 1,000 - 10,400 6,667 3,000Boston 3.4 2,125 - 8,500 6,600 10,000New York City 25.5 1,000 - 10,400 7,000 3,000MID-ATLANTIC 20.0 800 - 8,500 4,000 2,500Philadelphia 13.0 800 - 8,000 3,417 3,000Washington, D.C. 3.2 2,000 - 7,500 3,000 5,000WEST 10.0 2,000 - 8,600 6,225 2,000Los Angeles 2.5 2,000 - 8,600 5,000 -Seattle 1.6 3,000 - 7,050 6,250 1,000San Francisco 3.4 2,100 - 8,500 6,400 2,000MIDWEST 5.4 600 - 9,316 6,500 4,500Chicago 2.0 1,900 - 9,316 7,600 5,000Minneapolis/St. Paul 1.4 5,500 - 7,500 6,457 -SOUTH 3.9 2,000 - 8,500 6,000 2,500Atlanta 1.4 5,000 - 8,500 6,000 -SOUTHWEST 2.2 1,100 - 8,500 6,400 5,000INTERNATIONAL 18.1 400 - 10,000 6,875 5,000EUROPE 8.3 800 - 10,000 7,083 7,500Western Europe 8.0 1,000 - 10,000 7,142 7,500United Kingdom 5.4 1,000 - 10,000 7,142 10,000London, United Kingdom 4.6 1,000 - 9,700 7,142 10,000ASIA 7.0 400 - 8,126 5,500 5,000Hong Kong 1.4 6,500 - 8,000 7,085 -Japan 1.8 1,800 - 8,126 5,000 -Tokyo, Japan 1.3 1,800 - 8,126 5,500 -South Korea 1.7 1,000 - 8,000 2,000 5,000LATIN AMERICA 2.2 1,000 - 7,083 4,000 4,000NOT SPECIFIED 1.8 - - - -11