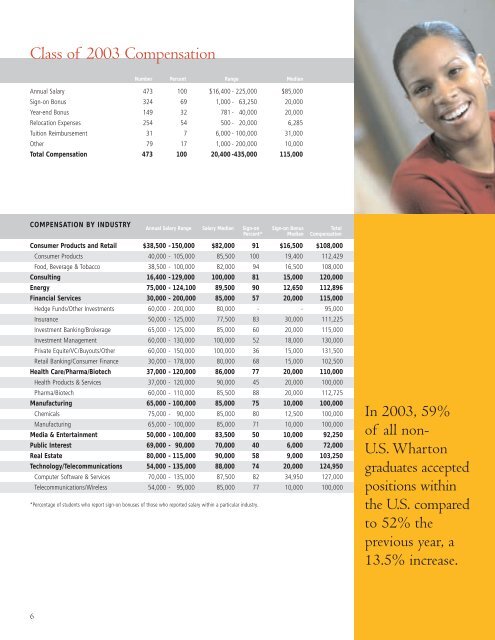
Class of <strong>2003</strong> CompensationNumber Percent Range MedianAnnual Salary 473 100 $16,400 - 225,000 $85,000Sign-on Bonus 324 69 1,000 - 63,250 20,000Year-end Bonus 149 32 781 - 40,000 20,000Relocation Expenses 254 54 500 - 20,000 6,285Tuition Reimbursement 31 7 6,000 - 100,000 31,000Other 79 17 1,000 - 200,000 10,000Total Compensation 473 100 20,400 -435,000 115,000COMPENSATION BY INDUSTRYAnnual Salary Range Salary Median Sign-on Sign-on Bonus TotalPercent* Median CompensationConsumer Products and Retail $38,500 - 150,000 $82,000 91 $16,500 $108,000Consumer Products 40,000 - 105,000 85,500 100 19,400 112,429Food, Beverage & Tobacco 38,500 - 100,000 82,000 94 16,500 108,000Consulting 16,400 - 129,000 100,000 81 15,000 120,000Energy 75,000 - 124,100 89,500 90 12,650 112,896Financial Services 30,000 - 200,000 85,000 57 20,000 115,000Hedge Funds/Other Investments 60,000 - 200,000 80,000 - - 95,000Insurance 50,000 - 125,000 77,500 83 30,000 111,225Investment Banking/Brokerage 65,000 - 125,000 85,000 60 20,000 115,000Investment <strong>Management</strong> 60,000 - 130,000 100,000 52 18,000 130,000Private Equite/VC/Buyouts/Other 60,000 - 150,000 100,000 36 15,000 131,500Retail Banking/Consumer Finance 30,000 - 178,000 80,000 68 15,000 102,500Health Care/Pharma/Biotech 37,000 - 120,000 86,000 77 20,000 110,000Health Products & Services 37,000 - 120,000 90,000 45 20,000 100,000Pharma/Biotech 60,000 - 110,000 85,500 88 20,000 112,725Manufacturing 65,000 - 100,000 85,000 75 10,000 100,000Chemicals 75,000 - 90,000 85,000 80 12,500 100,000Manufacturing 65,000 - 100,000 85,000 71 10,000 100,000Media & Entertainment 50,000 - 100,000 83,500 50 10,000 92,250Public Interest 69,000 - 90,000 70,000 40 6,000 72,000Real Estate 80,000 - 115,000 90,000 58 9,000 103,250Technology/Telecommunications 54,000 - 135,000 88,000 74 20,000 124,950Computer Software & Services 70,000 - 135,000 87,500 82 34,950 127,000Telecommunications/Wireless 54,000 - 95,000 85,000 77 10,000 100,000*Percentage of students who report sign-on bonuses of those who reported salary within a particular industry.In <strong>2003</strong>, 59%of all non-U.S. <strong>Wharton</strong>graduates acceptedpositions withinthe U.S. comparedto 52% theprevious year, a13.5% increase.6
Shawn M. Harvey, WG’03Major: Strategic <strong>Management</strong>Previous Education: B.S. inElectrical Engineering,Howard UniversityWork History: 3 years asBusiness Consultant,Accenture, New YorkPlans After Graduation:Consulting, AccentureReston, VAI was working as a systemsengineering intern whenI read an article about awoman who was heading theAmoco Foundation at thetime, and I said, “This is it.I want her job!” I realizedthat I needed a groundingin business fundamentalsfirst, which is how I endedup at <strong>Wharton</strong>.My internship at thePew Charitable Trustsallowed me to combine mypassion for making a differencein the world with mynewfound strategy andconsulting skills. I evaluatedbest practices in grantmakingstrategy development andperformed a gap analysis todetermine Pew’s organizationalcapabilities and needs— this is similar to the workI do as a consultant. At theend of the day, to know thatmy efforts — somewheredown the line — helped getmoney to a community wasincredibly rewarding.COMPENSATION BY FUNCTIONAnnual Salary Range Salary Median Sign-on Bonus Sign-on Bonus TotalPercent* Median CompensationConsulting/Strategy $16,400 - 129,000 $100,000 78 $15,000 $120,000Control/Accounting 50,000 - 90,000 89,000 50 10,000 132,000Corporate Finance/Mergers & Acquisitions 30,000 - 150,000 85,000 69 20,000 110,000General/Project <strong>Management</strong>/<strong>Management</strong>Development/Rotational Programs 44,000 - 178,000 90,000 69 15,000 110,000Investment/Portfolio <strong>Management</strong> 55,000 - 200,000 90,000 52 20,000 122,500Product/Brand Marketing 40,000 - 135,000 84,000 82 20,000 111,000Product Development/Structuring 65,000 - 120,000 85,000 60 20,000 107,500Research 79,500 - 85,000 85,000 73 20,000 109,000Sales 65,000 - 86,000 85,000 69 20,000 115,000Trading 80,000 - 85,000 85,000 70 20,000 115,000*Percentage of students who report sign-on bonuses of those who reported salary within a particular function.LOCATION CHOICES AND COMPENSATIONPercent Annual Salary Range Salary Median Sign-on Bonus TotalMedian CompensationUNITED STATES OF AMERICA 79.9 $37,000 - 200,000 $85,000 $18,000 $115,000NORTHEAST 41.4 38,500 - 150,000 85,000 20,000 113,000Boston 3.7 85,000 - 150,000 100,000 17,500 141,250New York City 26.4 38,500 - 140,000 85,000 20,000 114,225MID-ATLANTIC 12.9 37,000 - 124,100 89,500 15,000 105,000Philadelphia 5.5 37,000 - 110,000 85,000 15,000 102,750Washington, D.C. 4.1 69,000 - 124,100 90,000 11,825 118,530WEST 9.4 48,000 - 135,000 85,000 20,000 115,000Los Angeles 2.0 70,000 - 100,000 85,000 23,500 113,000Seattle 1.6 70,000 - 88,000 77,500 35,000 125,350San Francisco 2.1 70,000 - 110,000 100,000 20,000 115,000MIDWEST 7.4 75,000 - 115,000 89,500 17,500 116,000Chicago 2.9 75,000 - 115,000 100,000 15,000 120,000Minneapolis/St. Paul 2.3 83,000 - 100,000 85,000 20,000 111,500SOUTH 4.5 60,000 - 200,000 100,000 10,000 120,000Atlanta 2.3 80,000 - 100,000 100,000 15,000 120,000SOUTHWEST 2.3 80,000 - 150,000 97,500 22,500 140,000Dallas/Fort Worth 1.4 80,000 - 150,000 100,000 12,500 140,000INTERNATIONAL 17.2 16,400 - 225,000 85,000 20,000 113,500ASIA 7.4 16,400 - 150,000 85,000 20,000 110,400Hong Kong 1.6 80,000 - 94,000 85,000 20,000 117,746Japan 1.4 68,000 - 150,000 86,500 20,000 121,428South Korea 2.3 50,000 - 129,000 65,000 20,000 99,000EUROPE 5.9 66,000 - 105,000 85,000 20,000 115,000Western Europe 5.3 66,000 - 105,000 85,000 20,000 116,000United Kingdom 3.7 70,000 - 105,000 85,000 20,000 115,000London, United Kingdom 2.1 80,000 - 105,000 85,000 20,000 115,000LATIN AMERICA 2.9 38,000 - 225,000 70,000 16,000 100,000Brazil 2.1 38,000 - 225,000 54,000 21,000 100,000NOT SPECIFIED 2.9 - - - - -7