

INST 262 (DCS and Fieldbus), section 2 Lab Automatically ...
INST 262 (DCS and Fieldbus), section 2 Lab Automatically ...
INST 262 (DCS and Fieldbus), section 2 Lab Automatically ...

Create successful ePaper yourself
Turn your PDF publications into a flip-book with our unique Google optimized e-Paper software.
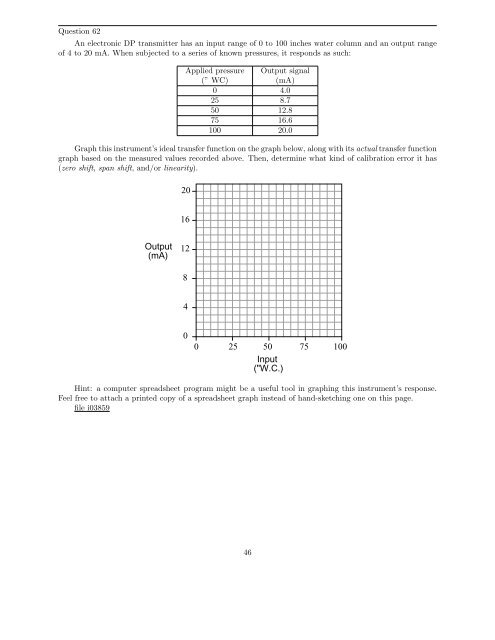
Question 62<br />
An electronic DP transmitter has an input range of 0 to 100 inches water column <strong>and</strong> an output range<br />
of 4 to 20 mA. When subjected to a series of known pressures, it responds as such:<br />
Applied pressure Output signal<br />
(” WC) (mA)<br />
0 4.0<br />
25 8.7<br />
50 12.8<br />
75 16.6<br />
100 20.0<br />
Graph this instrument’s ideal transfer function on the graph below, along with its actual transfer function<br />
graph based on the measured values recorded above. Then, determine what kind of calibration error it has<br />
(zero shift, span shift, <strong>and</strong>/or linearity).<br />
Output<br />
(mA)<br />
20<br />
16<br />
12<br />
8<br />
4<br />
0<br />
0<br />
25<br />
50<br />
Input<br />
("W.C.)<br />
Hint: a computer spreadsheet program might be a useful tool in graphing this instrument’s response.<br />
Feel free to attach a printed copy of a spreadsheet graph instead of h<strong>and</strong>-sketching one on this page.<br />
file i03859<br />
46<br />
75<br />
100
