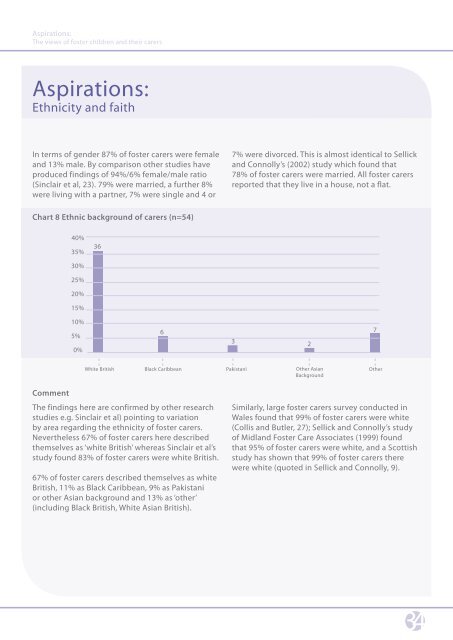
<strong>Aspirations</strong>:The views of foster children and their carers<strong>Aspirations</strong>:Ethnicity and faithIn terms of gender 87% of foster carers were femaleand 13% male. By comparison other studies haveproduced findings of 94%/6% female/male ratio(Sinclair et al, 23). 79% were married, a further 8%were living with a partner, 7% were single and 4 or7% were divorced. This is almost identical to Sellickand Connolly’s (2002) study which found that78% of foster carers were married. All foster carersreported that they live in a house, not a flat.Chart 8 Ethnic background of carers (n=54)40%35%3630%25%20%15%10%5%0%63 27White BritishBlack Caribbean Pakistani Other AsianOtherBackgroundCommentThe findings here are confirmed by other researchstudies e.g. Sinclair et al) pointing to variationby area regarding the ethnicity of foster carers.Nevertheless 67% of foster carers here describedthemselves as ‘white British’ whereas Sinclair et al’sstudy found 83% of foster carers were white British.67% of foster carers described themselves as whiteBritish, 11% as Black Caribbean, 9% as Pakistanior other Asian background and 13% as ‘other’(including Black British, White Asian British).Similarly, large foster carers survey conducted inWales found that 99% of foster carers were white(Collis and Butler, 27); Sellick and Connolly’s studyof Midland Foster Care Associates (1999) foundthat 95% of foster carers were white, and a Scottishstudy has shown that 99% of foster carers therewere white (quoted in Sellick and Connolly, 9).34
<strong>Aspirations</strong>:The views of foster children and their carersEthnicity of carers and childrenIn 34 cases, both carers and children described theirethnicity. 97% (all but one) of children were placedwith a carer from the same or a similar ethnicbackground. (e.g. White Irish and White Britishmarked as similar ethnic background, but Africanand Asian marked as different ethnic backgrounds.)The National Minimum Standards for Foster Carerequire that ‘placement decisions consider thechild’s assessed racial, ethnic, religious, culturaland linguistic needs and match these as closelyas possible with the ethnic origin, race, religion,culture and language of the foster family’ (Standard8), which presumes that these characteristics areknown and recorded for each foster carer. However,it is worth noting that currently no requirementexists for local authorities to register the ethnicity,language, religion, education or employmenthistory of foster carers.In Sinclair, Gibbs and Wilson’s study of foster carers(2004, 20), the proportion of carers in full timeemployment varied between 9 and 27% (average15%). Clearly, in <strong>TACT</strong> a significantly higherpercentage. Similarly, this study found that 8%of the main foster carers were in part-time work,compared with 25% in Sinclair et al’s study. Of<strong>TACT</strong> foster carers’ partners (n=45), 16 describedthemselves as full time foster carers, 16 as workingfull time, 5 part time, 4 were retired, and 4 ‘other’.The high percentage of carers whose soleoccupation is being a foster carer illustrates theimportance of maintaining proper and professionallevels of payment and allowances.Faith75% of carers identified with a religious faith, and18 (25%) did not identify with any religious faith. Inanother foster carers study, based in Wales (Collisand Butler, 26) a slightly smaller proportion (66%)identified themselves with a religious faith. Here, ofthe 51 carers identifying with a religious faith 52%described themselves as Christian, 6% as Muslimand 4% as Jehovah’s Witness. By comparison inanother study, 92% of those stating religiousaffiliation were Christian and the remainder Hindi,Muslim, spiritualist or pagan (Collis and Butler, 26).Work status of foster carersThe study found that for 85% of foster carers, ‘beinga foster carer’ was their primary source of income.(5% worked full-time. 8% part-time and 2% statedother). This is virtually the same percentage (87%)of the children’s foster carers who were female,married or living with a partner.35