Final Report Summary: - The Minnesota Project
Final Report Summary: - The Minnesota Project
Final Report Summary: - The Minnesota Project

You also want an ePaper? Increase the reach of your titles
YUMPU automatically turns print PDFs into web optimized ePapers that Google loves.
<strong>Final</strong> <strong>Report</strong> <strong>Summary</strong>:<br />
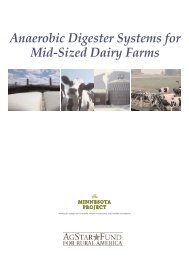
Haubenschild Farms Anaerobic Digester<br />
Updated!<br />
Download the entire report at: www.mnproject.org<br />
August 2002<br />
Carl Nelson<br />
John Lamb<br />
1
About this report<br />
<strong>The</strong> original Haubenschild <strong>Report</strong> was published in December of 1999, and updated with<br />
new operating information in August 2002. This is a summary of the full updated report,<br />
which has over 30 pages of more detailed information on the Haubenschild digester as<br />
well as general information on digesters. It can be downloaded at www.mnproject.org.<br />
<strong>The</strong> update for this report was made possible by a grant from the U.S. Department of<br />
Energy and the <strong>Minnesota</strong> Department of Commerce.<br />
<strong>The</strong> <strong>Minnesota</strong> <strong>Project</strong><br />
1885 University Avenue<br />
Suite 315<br />
St. Paul, MN 55104<br />
651-645-6159<br />
www.mnproject.org<br />
cnelson@mnproject.org<br />
© <strong>The</strong> <strong>Minnesota</strong> <strong>Project</strong> 2002. All or portions of this report may be copied or otherwise<br />
distributed, as long as printed acknowledgement is given of the source of the material.<br />
You may also retrieve a copy of the report at our website: www.mnproject.org.<br />
2
<strong>Summary</strong><br />
This report is an update of the December 2000 report and documents the installation and<br />
34-month performance of a heated plug-flow anaerobic digester for managing dairy<br />
manure at Haubenschild Farms. This type of digester is appropriate for treating manure<br />
with a high solids content, such as cow manure that is collected by scraping.<br />
Haubenschild Farms is a 1000-acre, family owned and operated dairy farm near<br />
Princeton, <strong>Minnesota</strong>. In 1998 the owners were planning to increase the size of their<br />
operations, and considered the possibility of installing an anaerobic manure digester.<br />
<strong>The</strong>y knew that this type of system could result in environmental benefits while offering<br />
a return on their investment.<br />
Some of the key expected benefits of an anaerobic digester are:<br />
• Odor control<br />
• Renewable energy production<br />
• Pathogen reduction<br />
• Greenhouse gas reduction<br />
• Reduction in total oxygen demand of the treated manure (total oxygen demand is a<br />
measure of potential impact on aquatic systems)<br />
Haubenschild Farms applied for and was selected as an AgSTAR “Charter Farm,” one of<br />
13 such farms selected nationwide to demonstrate farm-scale anaerobic digestion<br />
technologies. AgSTAR is a joint program of the Environmental Protection Agency,<br />
Department of Energy and Department of Agriculture, designed to promote the use of<br />
anaerobic digestion systems. In addition to the AgSTAR program, the Haubenschild<br />
Farms project received assistance from the <strong>Minnesota</strong> Department of Agriculture,<br />
Department of Commerce and Office of Environmental Assistance. With financing<br />
complete, construction of the digester was started in the summer of 1999 and completed<br />
in October of the same year. Total construction cost of the digester and generator system<br />
was about $355,000.<br />
<strong>The</strong> Haubenschild Farms digester is a covered 350,000-gallon concrete tank installed in<br />
the ground, with suspended heating pipes to heat the manure inside the digester where<br />
bacteria breaks down the manure, creating methane. A 135-kilowatt engine-generator set<br />
is fueled with methane captured from the digester. <strong>The</strong> hot water to heat the digester is<br />
recovered from the engine-generator’s cooling jacket. Barn floor space is also heated<br />
with the recovered heat. <strong>The</strong> digested effluent, odor reduced, flows to a lined storage<br />
pond where it is kept until it can be injected or broadcast spread on fields for crop<br />
production.<br />
When the digester was started, it was processing manure from about 425 dairy cows,<br />
which was about half of its total design capacity of 1000 cows. In 2000, Haubenschild<br />
Farms built a second free stall barn and has expanded to a current size of about 750 cows.<br />
1
Since startup in the fall of 1999, the biogas output of the digester steadily increased to<br />
about 65,000 cubic feet by May 2000. Currently, more biogas is being produced than can<br />
be used by the engine-generator, so it is hard to estimate exactly how much biogas is<br />
being produced. <strong>The</strong> Haubenschilds are considering adding generation capacity to<br />
utilize the excess biogas. Approximately 70,000 cubic feet/day of biogas is used by the<br />
engine-generator; the rest is currently flared. With 425 cows, the biogas output per cow<br />
was almost twice projections – with 750 cows, the output per cow has come down<br />
somewhat to about 40 percent above projections. Haubenschild’s cows are producing<br />
about 50 percent more manure per cow than the digester was engineered for, which<br />
somewhat explains the high biogas production per cow.<br />
<strong>The</strong> sale of the electricity generated is an important benefit of the project. Before the<br />
digester was built, Haubenschild Farms entered into a power purchase contract proposed<br />
by the local electric cooperative, East Central Energy, who greeted the project with<br />
enthusiasm and offered Haubenschild Farms a very favorable contract. Since the<br />
expansion of the milking herd size from 425 to about 750 cows in the summer of 2000,<br />
the digester has been producing enough electricity to provide all the electric needs onfarm,<br />
plus enough surplus electricity to power about 75 additional homes.<br />
<strong>The</strong> building and operation of the Haubenschild Farms project has offered several key<br />
lessons for future digesters:<br />
• Payback of 5 years on investment is possible<br />
• A good time to install a digester is when changing or expanding operations<br />
• Electric utility cooperation is important<br />
• Active management is crucial for stable digester and engine operation<br />
• Digester design and engineering expertise is key<br />
• <strong>The</strong>re are barriers to financing digester systems<br />
• Cooperative agency participation reduces the barriers to a project’s success<br />
• Manure collection method and collection frequency are important<br />
2
Table 1: <strong>Project</strong>ed and Actual Costs of Haubenschild Farm Digester<br />
System<br />
Component <strong>Project</strong>ed $ Actual $<br />
Mix Tank/ Manure Collection<br />
Excavation/grading<br />
Cement work<br />
Manure pump<br />
Other (piping, installing)<br />
3<br />
3,400<br />
12,500<br />
10,000<br />
0*<br />
18,800<br />
11,300<br />
2,300<br />
Subtotal 25,900 32,400<br />
Digester<br />
Excavation/grading<br />
Digester tank<br />
Heating<br />
Cover<br />
Start-up<br />
Miscellaneous<br />
10,600<br />
68,500<br />
8,500<br />
4,600<br />
5,000<br />
7,800<br />
8,500<br />
88,700<br />
19,800<br />
8,100<br />
0*<br />
0*<br />
Subtotal 105,000 125,100<br />
Energy Conversion<br />
Building<br />
Gas pipes<br />
Gas pump/meter<br />
Engine-generator/hot water recovery<br />
Components and installation<br />
17,400<br />
2,000<br />
6,000<br />
87,000<br />
13,700<br />
16,400<br />
2,100<br />
2,000<br />
106,000<br />
31,000<br />
Subtotal 126,100 157,500<br />
Miscellaneous<br />
Engineering<br />
25,000<br />
40,000<br />
Contingencies<br />
25,700<br />
0*<br />
Subtotal 50,700 40,000<br />
TOTAL 307,700 355,000<br />
COST/COW (assuming 1000 cows) $307 $355<br />
*Costs for these items are embedded in other items for which costs are shown
Table 2: Digester Design and Actual Performance<br />
Design Actual, 425 cows Actual, 750 cows<br />
Time frame 1998 Jan - May 2000 Sep 2000 - Jul 2002<br />
Cows (average)<br />
Manure production<br />
1,000 425 750<br />
gallons (per cow per day)<br />
Manure slurry<br />
(including wash water and bedding)<br />
14 n/a n/a<br />
gallons (per cow per day) 17.5 27 27<br />
total gallons slurry (per day)<br />
Digester size<br />
17,500 11,500 20,000<br />
volume (cubic feet) 47,000 47,000 47,000<br />
volume (gallons) 352,000 352,000 352,000<br />
retention time (days)<br />
Gas production<br />
20 31 15<br />
per gallon of manure slurry<br />
3.7 5.1 3.5*<br />
(cubic feet/day)<br />
per cow (cubic feet per day) 65 139 93*<br />
total (per day) 65,000 58,900 70,000*<br />
Electrical output<br />
per cow (kWh per day 1 ) 2.3 5.5 4.0<br />
total (kWh per day) 2340 2350 2970<br />
generator capacity (kW) 120 135 135<br />
generator availability 90% 98% 98.8%<br />
yearly output (kWh) 766,500 860,000 1,080,000<br />
<strong>The</strong>rmal output<br />
total thermal output (mmBtu/day) 18 n/a n/a<br />
Revenue Generation<br />
offset heating costs (per year) $4000 $4000 $4000<br />
offset electricity use on-farm ($/kWh) $0.07 $0.0725 $0.073**<br />
excess electricity sales ($/kWh) $0.02 $0.0725 $0.073**<br />
projected annual electric revenue 2 $40,300 $62,200 $80,957<br />
(actual, 2001)<br />
total projected annual revenue $44,300 $66,200 $84,957<br />
n/a means not available<br />
* Actual biogas production is higher than reported here, because more biogas is being produced<br />
than the engine can accommodate, and thus cannot be metered with the current metering<br />
configuration<br />
** A rate increase from 7.25 cents/kWh to 7.3 cents/kWh occurred effective Jan 1, 2001.<br />
1 For the design calculations of kWh per cow, this assumes an energy value of 600 Btu per cubic foot<br />
biogas and a heat rate of 15,000 Btu per kWh.<br />
2 <strong>Project</strong>ed annual electric revenue for the 425 cow column is calculated based on the average electric<br />
production from January 14 to June 2. See later discussion on revenue generated.<br />
4