Capacitance Measurements and AC Conductivity of Nickel ...
Capacitance Measurements and AC Conductivity of Nickel ...
Capacitance Measurements and AC Conductivity of Nickel ...

Create successful ePaper yourself
Turn your PDF publications into a flip-book with our unique Google optimized e-Paper software.
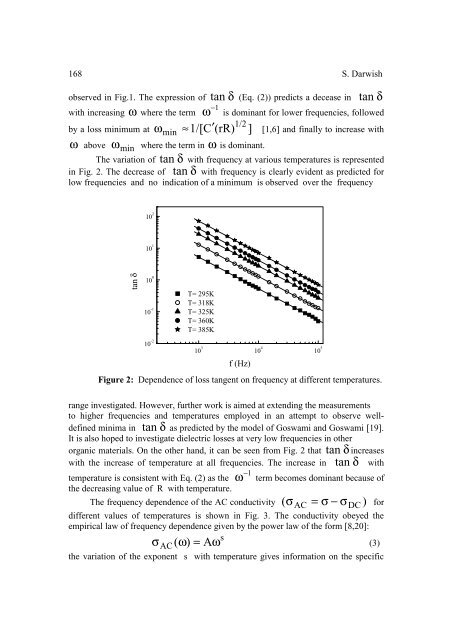
168 S. Darwishtan δ (Eq. (2)) predicts a decease in tan δobserved in Fig.1. The expression <strong>of</strong>−1with increasing ω where the term ω is dominant for lower frequencies, followed1/2by a loss minimum at ω min ≈1/[C ′(rR)] [1,6] <strong>and</strong> finally to increase withω above ω min where the term in ω is dominant.The variation <strong>of</strong> tan δ with frequency at various temperatures is representedin Fig. 2. The decrease <strong>of</strong> tan δ with frequency is clearly evident as predicted forlow frequencies <strong>and</strong> no indication <strong>of</strong> a minimum is observed over the frequency10 2 T= 295K10 1tan δ10 010 -1T= 318KT= 325KT= 360KT= 385K10 -210 3 10 4 10 5f (Hz)Figure 2: Dependence <strong>of</strong> loss tangent on frequency at different temperatures.range investigated. However, further work is aimed at extending the measurementsto higher frequencies <strong>and</strong> temperatures employed in an attempt to observe welldefinedminima in tan δ as predicted by the model <strong>of</strong> Goswami <strong>and</strong> Goswami [19].It is also hoped to investigate dielectric losses at very low frequencies in otherorganic materials. On the other h<strong>and</strong>, it can be seen from Fig. 2 that tan δ increaseswith the increase <strong>of</strong> temperature at all frequencies. The increase in tan δ with−1temperature is consistent with Eq. (2) as the ω term becomes dominant because <strong>of</strong>the decreasing value <strong>of</strong> R with temperature.The frequency dependence <strong>of</strong> the <strong>AC</strong> conductivity ( σ <strong>AC</strong> = σ − σDC) fordifferent values <strong>of</strong> temperatures is shown in Fig. 3. The conductivity obeyed theempirical law <strong>of</strong> frequency dependence given by the power law <strong>of</strong> the form [8,20]:sσ <strong>AC</strong>( ω)= Aω(3)the variation <strong>of</strong> the exponent s with temperature gives information on the specific