An Inventory of My Traits
An Inventory of My Traits
An Inventory of My Traits
- No tags were found...

You also want an ePaper? Increase the reach of your titles
YUMPU automatically turns print PDFs into web optimized ePapers that Google loves.
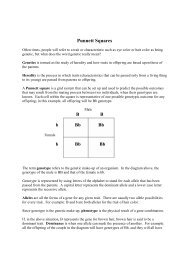
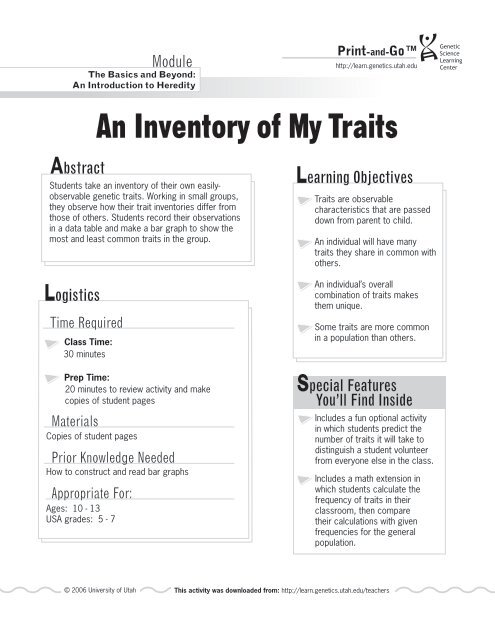
ModuleThe Basics and Beyond:<strong>An</strong> Introduction to HeredityPrint-and-Gohttp://learn.genetics.utah.edu<strong>An</strong> <strong>Inventory</strong> <strong>of</strong> <strong>My</strong> <strong>Traits</strong>AbstractStudents take an inventory <strong>of</strong> their own easilyobservablegenetic traits. Working in small groups,they observe how their trait inventories differ fromthose <strong>of</strong> others. Students record their observationsin a data table and make a bar graph to show themost and least common traits in the group.LogisticsTime RequiredClass Time:30 minutesPrep Time:20 minutes to review activity and makecopies <strong>of</strong> student pagesMaterialsCopies <strong>of</strong> student pagesPrior Knowledge NeededHow to construct and read bar graphsAppropriate For:Ages: 10 - 13USA grades: 5 - 7Learning Objectives<strong>Traits</strong> are observablecharacteristics that are passeddown from parent to child.<strong>An</strong> individual will have manytraits they share in common withothers.<strong>An</strong> individual’s overallcombination <strong>of</strong> traits makesthem unique.Some traits are more commonin a population than others.Special FeaturesYou’ll Find InsideIncludes a fun optional activityin which students predict thenumber <strong>of</strong> traits it will take todistinguish a student volunteerfrom everyone else in the class.Includes a math extension inwhich students calculate thefrequency <strong>of</strong> traits in theirclassroom, then comparetheir calculations with givenfrequencies for the generalpopulation.© 2006 University <strong>of</strong> Utah This activity was downloaded from: http://learn.genetics.utah.edu/teachers
ModuleThe Basics and Beyond:<strong>An</strong> Introduction to HeredityClassroom ImplementationActivity instructions:Print-and-Gohttp://learn.genetics.utah.edu<strong>An</strong> <strong>Inventory</strong> <strong>of</strong> <strong>My</strong> <strong>Traits</strong>• Begin by demonstrating one <strong>of</strong> the traits listed in <strong>An</strong> <strong>Inventory</strong> <strong>of</strong> <strong>My</strong><strong>Traits</strong>: Survey (page S-1). Ask students who possess this trait to stand.Point out the relative numbers <strong>of</strong> students standing and sitting for thetrait. Continue this process with 2-3 more traits.QuantitiesPer StudentOne copy <strong>of</strong> student pagesS-1 to S-3• Explain that traits are observable characteristics we inherit fromour parents. Some traits are common in a population (our class)while others are not. <strong>An</strong>d, every person has a different overallcombination <strong>of</strong> traits that makes them unique.• Divide students into groups <strong>of</strong> four or more. Have each student inthe group complete <strong>An</strong> <strong>Inventory</strong> <strong>of</strong> <strong>My</strong> <strong>Traits</strong>: Survey (page S-1)to determine their unique combination <strong>of</strong> the traits described.• After students complete the survey, have them tally their groupinformation on the data table (page S-2) and draw a bar graph(page S-3).• Optional: You may collect the traits data from the whole classby creating a large wall chart (see example on the left). Have arepresentative from each group fill in their data. Once all the datahas been collected, have the students make a bar graph from theclass data or make one large graph together.Optional activity:• Ask students to predict how many traits they would haveto look at on the Survey in order to identify any givenclassmate as unique.• Select a volunteer who would like to determine his or heruniqueness. Ask all students to stand.• Have the volunteer call out one <strong>of</strong> their traits at a time,beginning with question 1 on the Survey and continuing insequence. For each trait, direct all students who do notshare that trait to sit down; students who share the traitremain standing. Once a student sits down, they do notget up again.Common MisconceptionsStudents may think that the more common traitsare “better”, but this is not always the case.Sometimes traits simply show up more frequentlyin the human population.More advanced students may think that dominanttraits are more common than recessive traits.However, frequency has very little to do withwhether a trait is dominant or recessive. That is,a dominant trait is not necessarily more commonand a recessive trait is not necessarily rare in apopulation.© 2006 University <strong>of</strong> Utah This activity was downloaded from: http://learn.genetics.utah.edu/teachers 1
NameDatePrint-and-Gohttp://learn.genetics.utah.eduAdapted from “Alike But Not The Same” in Human Genetic Variation, NIH Curriculum Supplement Series 1999. http://science-education.nih.gov<strong>An</strong> <strong>Inventory</strong> <strong>of</strong> <strong>My</strong> <strong>Traits</strong> - SurveyWhat combination <strong>of</strong> these traits do you have? Complete the survey to find out.1. I have detached earlobes Yes No2. I can roll my tongue Yes No3. I have dimples Yes No4. I am right-handed Yes No5. I have freckles Yes No6. I have naturally curly hair Yes No7. I have a cleft chin Yes No8. I have allergies Yes No9. I cross my left thumb over my Yes Noright when I clasp my handstogether10. I can see the colors red and green Yes No( I am not color blind)11. The hairline on my forehead is Yes Nostraight.12. I am a: Male Female© 2006 University <strong>of</strong> Utah Permission granted for classroom use.S-1
NameDateAdapted from “Alike But Not The Same” in Human Genetic Variation, NIH Curriculum Supplement Series 1999. http://science-education.nih.gov<strong>An</strong> <strong>Inventory</strong> <strong>of</strong> <strong>My</strong> <strong>Traits</strong> - Data TableHow many people in your group have each trait?Fill in the data table below by counting the number <strong>of</strong> people who marked “yes” andthe number <strong>of</strong> people who marked “no” for each trait.Detached earlobesTongue rollingDimplesRight-handedFrecklesNaturally curly hairCleft chinAllergiesCross left thumb over rightSee the colors red and greenHave a straight hairlinePrint-and-Gohttp://learn.genetics.utah.eduTRAIT YES NO© 2006 University <strong>of</strong> Utah Permission granted for classroom use.S-2
NameDate© 2006 University <strong>of</strong> Utah Permission granted for classroom use.S-3<strong>Traits</strong>01# <strong>of</strong> students2345Make a bar graph showing how many people in your group answered “yes” for each trait.Be sure to label each trait under the bar you draw for it.<strong>An</strong> <strong>Inventory</strong> <strong>of</strong> <strong>My</strong> <strong>Traits</strong> - Graphhttp://learn.genetics.utah.eduPrint-and-Go
NameDateAdapted from “Alike But Not The Same” in Human Genetic Variation, NIH Curriculum Supplement Series 1999. http://science-education.nih.govPrint-and-Gohttp://learn.genetics.utah.eduUn Inventario de mis Rasgos - Encuesta¿Quales son los rasgos que tú tienes que se le hacen singular?Para averigüar, completa la encuesta que sigue abajo.1. Tengo los lóbulos de las orejas separados Si No2. Puedo hacer rollito mi lengua Si No3. Tengo hoyuelos Si No4. Escribo con la mano derecha Si No5. Tengo pecas Si No6. Mi cabello es rizado por naturaleza Si No7. Tengo la barbilla partida Si No8. Tengo alergias Si No9. Cuando entrelazo mis dedos pongo mi pulgar Si Noizquierdo sobre mi pulgar derecho10. Puedo ver los colores rojo y verde Si No(No soy daltónico)11. La rayita en mi frente es recta Si No12. Yo soy: Hombre Mujer© 2006 University <strong>of</strong> Utah Permission granted for classroom use.S-1
NameDatePrint-and-Gohttp://learn.genetics.utah.eduAdapted from “Alike But Not The Same” in Human Genetic Variation, NIH Curriculum Supplement Series 1999. http://science-education.nih.govUn Inventario de mis Rasgos - Tabla de Datos¿Cuantas personas de tú grupo tienen cada rasgo?Completa la tabla de datos que aparece a continuación contando el número de personasque marcaron “Si” y el número de personas que marcaron “No” en cada rasgo.Lóbulos de las orejas unidosPuede hacer rollito la lenguaHoyuelosEscribe con la mano derechaPecasCabello rizado naturalBarba partidaAlergiaRASGO SI NOCruza el pulgar izquierdo sobre elderechoPuede ver los colores rojo y verdeTenga una rayita recta© 2006 University <strong>of</strong> Utah Permission granted for classroom use.S-2
NameDate© 2006 University <strong>of</strong> Utah Permission granted for classroom use.S-3Rasgos01# de estudiantes2345Haz una gráfica de líneas mostrando cuántas personas en tu grupo contestaron “Si” encada rasgo. Asegúrate de marcar cada barra con el nombre del rasgo que estás dibujando.Un Inventario de mis Rasgos - Gráficahttp://learn.genetics.utah.eduPrint-and-Go