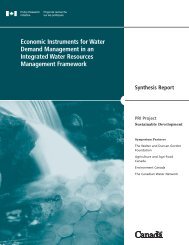
FINAL<strong>Okanagan</strong> <strong>Basin</strong> <strong>Instream</strong> <strong>Flow</strong> <strong>Needs</strong>2.52.0<strong>Flow</strong> (cms)1.51.00.50.0Jan Feb Mar Apr May Jun Jul Aug Sep Oct Nov DecFigure 2.7. Natural mean daily flows (light blue) for Pennask Creek, with flow time series superimposed for eachyear on record. The dark blue lines show the minimum and maximum diversion thresholds ascalculated using the proposed guideline for fish-bearing streams. <strong>Flow</strong>s occurring between these twothresholds are available for diversion/allocation (example figure taken from Hatfield et al. 2003,Appendix D).The BCIFN approach also includes a method that can be applied to fishless streams. For our project wedid not apply this to any node. Residual areas defined for the <strong>Okanagan</strong> that had no perennial flow wereconsidered fishless and were excluded from our IFN calculations.For this project, streamflow data were provided as mean weekly flows (instead of mean daily flows) overa shorter period of record (1996-2006) than the standard 20+ years recommended for the BCIFN method.As a result, the BCIFN method required adjustment to accommodate these differences in data frequencyand duration. Data were assessed over 4-week extents (referred to as periods in the analysis) instead ofmonthly extents for calculation of median/percentile flows. This data structure led to assessment of 13periods instead of 12 months in the calendar year. With only 11 years of data and using only weekly data,percentile flows for each 4-week period of the calendar year were determined from 44 data points (i.e.4 weekly flows per period multiplied by 11 years) instead of the 560–620+ data points (i.e. 28–31 dailyflows per month multiplied by 20+ years) than would have been standard for the BCIFN approach.Similarly, calculation of the 80th percentile flow for setting the maximum diversion rate utilized 572 datapoints (i.e. 52 weekly flows per year multiplied by 11 years) instead of 7300+ data points (i.e. 365 dailyflows per year multiplied by 20+ years of data) used typically for the BCIFN approach. The effects ofthese adjustments on determining minimum instream flow thresholds and maximum diversion rates arediscussed in section 2.5.1In addition to determining BCIFN minimum risk instream flow thresholds and BCIFN maximumdiversion rates, results of our analyses were used to calculate a recommended minimum watershedconservation flow for each week of the calendar year. The watershed conservation flow establishes aESSA Technologies Ltd. & 26Solander Ecological Research
FINAL<strong>Okanagan</strong> <strong>Basin</strong> <strong>Instream</strong> <strong>Flow</strong> <strong>Needs</strong>target flow that should be attained in at least some years for the purpose of maintaining geomorphicprocesses and wetland linkages that are important for aquatic ecosystem function. Weekly watershedconservation flows were calculated as the maximum of the BCIFN minimum risk flow threshold and themean regulated flow (i.e., naturalized flow minus BCIFN allowable diversion) over the period of recordfor each week. Functional watershed conservation flows will generally only occur during high flowmonths when flows may exceed the sum of the minimum flow threshold and the maximum diversion rate.2.5.1 Exploratory analysis of altering data frequency and durationModifying the BCIFN approach to use weekly (instead of daily) flow data over only 11 years will havereduced the precision of the statistical results relative to the standard BCIFN approach (e.g.,determination of the 90th percentile flow for the lowest flow period using only 44 instead of 560+ datapoint). There would not be any expected bias toward higher or lower thresholds, but results would be lessprecise simply due to calculations of summary statistics from a smaller sample size. As discussedpreviously, using weekly flow data required us to split the data into 4-week periods instead of monthlyperiods for analysis. This alteration resulted in an adjustment to the timing of transitions betweenthresholds. The overall impact of the timing change, however, is considered negligible.To illustrate the impacts of using a streamflow dataset with lower frequency and duration, the BCIFNanalysis was applied repeatedly to discharge data from two <strong>Water</strong> Survey of Canada (WSC) stations[Vaseux Creek above Solco Creek (#08NM171) and Whiteman Creek above Bouleau Creek(#08NM174)] using varying data frequencies and durations. Both catchments are considered natural (i.e.,unregulated). Vaseux Creek is a 117 km 2 west-draining catchment in the south <strong>Okanagan</strong> and has acomplete set of daily flow data spanning 1971–2006. Whiteman Creek is a 112 km 2 east-drainingcatchment in the north <strong>Okanagan</strong>, and has a mostly complete set of daily flow data spanning 1970-2006,other than several months of data that are missing from 1997. The BCIFN analysis was applied for eachcatchment 4 times: with daily data and the entire record (1970/71-2006), with weekly data and the entirerecord, with daily data and the 11-year record (1996-2006), and with weekly data and the 11-year record.Summary results from these analyses are provided in Table 2.4.Table 2.4.Vaseux Creek above Solco Creek (WSC #08NM171) and Whiteman Creek above Bouleau Creek(WSC #08NM174). Average minimum instream flow thresholds, maximum diversion rates, and 1999and 2001 diverted volumes (hypothetical). 1999 and 2001 had the highest and lowest mean annualdischarges over the entire periods of record, respectively.VaseuxWhitemanAverage Minimum <strong>Instream</strong> <strong>Flow</strong>Threshold (m 3 /s)1970/71-2006 Record 1996-2006 RecordDaily Data Weekly Data Daily Data Weekly Data0.82 0.84 0.86 0.89Maximum Diversion Rate (m 3 /s) 1.10 1.16 1.29 1.28Volume Diverted (m 3 )Average Minimum <strong>Instream</strong> <strong>Flow</strong>Threshold (m 3 /s)1999 7,960,000 7,820,000 9,040,000 8,850,0002001 895,000 743,000 770,000 571,0000.59 0.53 0.67 0.65Maximum Diversion Rate (m 3 /s) 0.71 0.73 0.73 0.79Volume Diverted (m 3 )1999 5,030,000 5,410,000 4,750,000 5,090,0002001 705,000 908,000 508,000 389,00027 ESSA Technologies Ltd. &Solander Ecological Research