HEALTHY BORDER 2010 - Mexico Border Health Commission
HEALTHY BORDER 2010 - Mexico Border Health Commission
HEALTHY BORDER 2010 - Mexico Border Health Commission
- No tags were found...

Create successful ePaper yourself
Turn your PDF publications into a flip-book with our unique Google optimized e-Paper software.
<strong>HEALTHY</strong> <strong>BORDER</strong> <strong>2010</strong>MIDTERM REVIEWU.S. <strong>Border</strong> Area
<strong>HEALTHY</strong> <strong>BORDER</strong> <strong>2010</strong>MIDTERM REVIEWU.S. <strong>Border</strong> AreaUnited States-México <strong>Border</strong> <strong>Health</strong> <strong>Commission</strong>
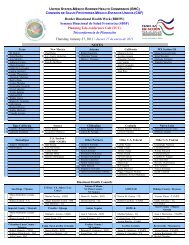
United States-México <strong>Border</strong> <strong>Health</strong> <strong>Commission</strong>Study AreaUS <strong>Border</strong> AreaUS <strong>Border</strong> Region CountiesStatesARIZONA1. Cochise2. Pima3. Santa Cruz4. YumaCALIFORNIA1. Imperial2. San DiegoNEW MEXICO1. Doña Ana2. Grant3. Hidalgo4. Luna5. Otero6. SierraTEXAS1. Brewster2. Brooks3. Cameron4. Crockett5. Culberson6. Dimmit7. Duval8. Edwards9. El Paso10. Frio11. Hidalgo12. Hudspeth13. Jeff Davis14. Jim Hogg15. Kenedy16. Kinney17. La Salle18. Maverick19. McMullen20. Pecos21. Presidio22. Real23. Reeves24. Starr25. Sutton26. Terrell27. Uvalde28. Val Verde29. Webb30. Willacy31. Zapata32. Zavala<strong>Border</strong> Area: Defined in P.L. 103-400 (22 U.S. Code, 290 n-5) and the La Paz Agreement of 1983, as the area 100kilometers (62 miles) north and south of the United States-Mexican border. This area includes 80 municipios in 6 Mexicanstates and 48 counties in 4 U.S. states. For the purposes of the <strong>Health</strong>y <strong>Border</strong> <strong>2010</strong> initiative, the border definition islimited only to the 44 U.S. border counties, excluding Maricopa, Pinal, and La Paz in Arizona and Riverside County inCalifornia. The terms “area” and “region” are used interchangeably.<strong>Border</strong> States: In the U.S. the states are Arizona, California, New <strong>Mexico</strong>, and Texas. In México, the states are BajaCalifornia Norte, Chihuahua, Coahuila, Nuevo León, Sonora, and Tamaulipas.2
<strong>Health</strong>y <strong>Border</strong> <strong>2010</strong> Midterm Review–U.S. <strong>Border</strong> AreaIntroductionIn March of 2001, the United States-México <strong>Border</strong><strong>Health</strong> <strong>Commission</strong> (BHC) established <strong>Health</strong>y <strong>Border</strong><strong>2010</strong> as an initiative for health promotion and diseaseprevention. Details on the framework for the strategicactions of the initiative have been previously described inthe 2003 publication of <strong>Health</strong>y <strong>Border</strong> <strong>2010</strong>: An Agenda forImproving <strong>Health</strong> on the United States-México <strong>Border</strong> 1 .Development of <strong>Health</strong>y <strong>Border</strong> <strong>2010</strong>In 2000, the four U.S. border states–Arizona, California,New <strong>Mexico</strong>, and Texas–adapted the framework of theU.S. Department of <strong>Health</strong> and Human Services’ (HHS)<strong>Health</strong>y People <strong>2010</strong> program to the needs of the U.S.border area. This approach was combined with México’sIndicadores de Resultado (<strong>Health</strong> Indicators) program toestablish the <strong>Health</strong>y <strong>Border</strong> <strong>2010</strong> initiative, which isbased on the following goals: 1) improve the quality of lifeand increase the number of years of healthy life and 2)eliminate health disparities.According to Public Law 103-400 (22 U.S. Code, 290n-5) and the La Paz Agreement of 1983, the border areawas defined as the area 100 kilometers (62 miles) northand south of the United States-México border. This areaincludes 80 municipios in 6 Mexican states and 48 countiesin 4 U.S. states. For the purposes of the <strong>Health</strong>y <strong>Border</strong><strong>2010</strong> initiative, the U.S. data are limited to 44 bordercounties, excluding Maricopa, Pinal, and La Paz countiesin Arizona and Riverside County in California.In July 2003 the BHC hosted a meeting of expertswhere final agreement was established on the binationalindicators that would comprise <strong>Health</strong>y <strong>Border</strong> <strong>2010</strong> forthe United States and Frontera Saludable <strong>2010</strong> for México.U.S. and Mexican officials and experts established 20measurable health objectives and associated <strong>2010</strong> targets,divided into 11 focus areas. For one objective, hepatitis,México chose to set a single objective for hepatitis casesof all types while the United States developed separateobjectives for hepatitis A and hepatitis B. For this reason,the U.S. portion of the <strong>Health</strong>y <strong>Border</strong> <strong>2010</strong> has 21objectives.Considerable differences in the way health are recordedacross states and between the two countries made itchallenging to define comparable targets for the entireregion. Thus, for the most part, targets are expressedusing percent changes in specified health indicators.Meeting the end-of-decade targets will also be challenging,requiring a concerted effort from both the United Statesand México. The United States will need to coordinatethe vast array of federal, state, and local governmenthealth programs, as well as the activities of foundations,local charities, and other private entities in small-scalecommunity health improvement projects. Governmentbasedhealth activities in México may be morestraightforward, but coordination requires synchronizingthe related border activities of Mexican foundations andcharities.Despite these challenges, however, the <strong>Health</strong>y <strong>Border</strong><strong>2010</strong> initiative will provide individuals, organizations, andcommunities with valuable tools for prioritizing issues,designing community health programs, and trackingsuccess for the first time in the United States-Méxicoborder area. This will thereby bring a new focus on healthimprovement activities and allocation of health resourcesfrom public and private sources on both sides of theborder.<strong>Health</strong>y <strong>Border</strong> <strong>2010</strong> U.S. Midterm ReviewFrom the beginning, the U.S. portion of the <strong>Health</strong>y<strong>Border</strong> <strong>2010</strong> initiative included plans for a mid-decadereview. The aim was to ensure that the <strong>Health</strong>y <strong>Border</strong><strong>2010</strong> initiative remains current, accurate, and relevant.However, it was clear from the outset of the initiative thatobtaining detailed data on 21 objectives for 44 bordercounties, spread across four states, would be difficult.Nearly one-quarter of the <strong>Health</strong>y <strong>Border</strong> objectives3
<strong>Health</strong>y <strong>Border</strong> <strong>2010</strong> Midterm Review–U.S. <strong>Border</strong> AreaOverview of Progress, 2000-2005The status of the U.S. <strong>Health</strong>y <strong>Border</strong> <strong>2010</strong> objectivesin 2005 varied, as Table 1 summarizes. It suggests thatobjectives 6 and 7 should be dropped because baselinedata could not be collected by 2005, and there is noprospect of data by <strong>2010</strong>. From 2000 to 2005, baselinedata, but no tracking data, became available for three otherdevelopmental objectives, while two other objectives hadbaseline data only. Fourteen objectives, two-thirds of thetotal number of objectives in <strong>Health</strong>y <strong>Border</strong> <strong>2010</strong>, hadboth baseline and tracking data available. In addition, twoobjectives had modified wording or data sources.Progress was recorded toward the year <strong>2010</strong> targets forthe 14 <strong>Health</strong>y <strong>Border</strong> objectives with both baseline andtracking data, as shown in Table 1. Eleven objectivesreported some progress toward the <strong>2010</strong> targets. Of the11, one objective had already exceeded the <strong>2010</strong> target,another three had achieved more than 90 percent of thetargeted change, and the remaining seven objectives hadcompleted 50 percent or more of the targeted change.Three objectives, however, made insufficient progresstowards the targets, although this trend was small for twoof the three objectives.Percent*§Source: 2000-2003 National <strong>Health</strong> Interview Survey, NCHS/CDC.* Age-adjusted to the US 2000 standard population.§ 95% confidence interval.Figure 1:Percent without health insurance, USA and border counties,2000-2003Rate* per 100,000 populationSource: National mortality files, NCHS/CDC.* Rates are age-adjusted to the US 2000 standard population.§ 95% confidence interval.§Figure 2:Breast cancer death rates by ethnicity, USA and bordercounties, 2000 and 2005Focus Area 1: Access to <strong>Health</strong> CareObjective 1: Reduce by 25 percent the populationlacking access to a primary care provider in anunderserved area.This objective was initially defined using the only accessdata available in 2000: data from the Bureau of <strong>Health</strong>Professions on the number of counties or sub-countyareas defined as primary health care shortage areas.Limitations existed with this definition and data sourcesince issues such as lack of after-hours care, longeroffice waits, and transportation issues can reduce borderresidents’ access to primary care providers, regardless oftheir availability 3 .Moreover, a more appropriate measure of access to careis the proportion of the population with health insurance,since there is a strong association between insurance andaccess to health care 4 . By combining four years of data(2000-2003) from the U.S. National <strong>Health</strong> InterviewSurvey, <strong>Health</strong>y <strong>Border</strong> <strong>2010</strong> was able to obtain estimatesof health insurance coverage rates for border residents,6
<strong>Health</strong>y <strong>Border</strong> <strong>2010</strong> Midterm Review–U.S. <strong>Border</strong> AreaRate* per 100,000 populationSource: National mortality files, NCHS/CDC.* Rates are age-adjusted to the US 2000 standard population.Figure 3:Breast cancer death rate, border counties, 2000-2005<strong>Health</strong>y<strong>Border</strong>Goal20%as shown in Figure 1. During the 2000-2003 interval,22.9 percent of border residents lacked health insurancecoverage, as compared to 14.7 percent nationally. Asan additional advantage, this data source also providessupplementary information on access to care forHispanics, a major subpopulation of the border.a recent mammogram 7 or other appropriate cancerscreenings because of socioeconomic or access barriers 8 .As shown in Figure 2, the decline in breast cancer deathrates from 2000 to 2005 was statistically significant forthe U.S. and all border counties combined. Death ratesalso decreased for border Hispanics and non-HispanicWhites but were not statistically significant. Specifically,breast cancer mortality in the border area has declinedover the first half of the decade, falling from 27.2 deathsper 100,000 population in 2000 to 22.1 in 2005 (Figure 3).This statistically significant decrease in the breast cancerdeath rate represents 94 percent of the progress requiredto meet the <strong>2010</strong> target of 21.8 deaths. The decline inborder female breast cancer mortality may be the resultof improved treatment and increases in breast cancerscreening. Data on changes in the proportion of borderwomen receiving regular mammograms and other breastcancer screening tests will be available in the future asadditional data from the National <strong>Health</strong> Interview Surveyare produced.Objective 3: Reduce cervical cancer death rate by30 percent.Focus Area 2: CancerObjective 2: Reduce female breast cancer rate by20 percent.Breast cancer is the second leading cause of cancerdeaths among U.S. women 5 and the leading cause amongHispanic women 6 , making this an important health issue.However, the border area’s rate of breast cancer mortalityis lower than the national breast cancer death rate. Thismay be due in part to the low rate of breast cancermortality among border Hispanic women, as shown inFigure 2. The reasons for the lower death rate amongborder Hispanic women are unknown, since Hispanicwomen report a higher level of some cancer risk factors.In addition, border Hispanics are less likely to have hadRate* per 100,000§Source: National mortality files, NCHS/CDC.* Rates are age-adjusted to the US 2000 standard population.§ 95% confidence interval.Figure 4:Cervical cancer death rates by ethnicity, USA andborder counties, 2000 and 20057
<strong>Health</strong>y <strong>Border</strong> <strong>2010</strong> Midterm Review–U.S. <strong>Border</strong> AreaWhile cervical cancer is not one of the leading cancercauses for incidence or mortality nationally 9 , it is importantfor two reasons. First, it is a source of health disparitybecause the cervical cancer death rate is higher amongborder Hispanic women than non-Hispanic whitewomen, as shown in Figure 4. Second, the Papanicolaou(Pap) test is a well-known screening test that can reducecervical cancer mortality through identification in theearliest and most treatable stages 10 .Rate* per 100,000 population20002005504540353025201510§50454035302520151026.92655Nationally, the incidence of cervical cancer has declinedfor several decades, due to improvements in screeningand treatment. The border death rate for cervical cancerfell by 27 percent, a statistically significant decrease inthe first half of the decade, from 3.7 to 2.7 deaths per100,000 population, nearly attaining the <strong>2010</strong> target of2.6 (Figure 5).0USA<strong>Border</strong>CountiesAZ BdrCountiesCA BdrCountiesNM BdrCountiesSource: National mortality data, NCHS/CDC.* Rates are age-adjusted to the US 2000 standard population.§ 95% confidence interval.TX BdrCountiesFigure 6:Diabetes death rates, USA and border counties, 2000 and200502000 20Rate* per 100,000Source: National mortality files, NCHS/CDC.* Rates are age-adjusted to the US 2000 standard population.<strong>Health</strong>y<strong>Border</strong>Goal30%health concern in the United States. Its incidence hasincreased markedly in recent years and is expected tocontinue growing, as indicated by high rates of impairedfasting glucose levels, increased rates of obesity, and thetrend towards more sedentary lifestyles. Morbidity andmortality rates are also higher in patients with diabetesthan in patients without diabetes 11 . In the U.S. border area,diabetes is an even more critical health issue because, forexample, the prevalence of Type II diabetes is two to threetimes higher in Mexican Americans, and the mortality rateis higher for diabetic Mexican Americans than nondiabeticMexican Americans 12 .Figure 5:Cervical cancer death rate, border counties 2000-2005Focus Area 3: DiabetesObjective 4: Reduce deaths due to diabetes by10 percent.Diabetes mellitus (diabetes) is an important and growingThe <strong>2010</strong> target for this objective is a 10 percent reductionin the diabetes death rate, from 26.9 diabetes-relateddeaths per 100,000 to 24.2. Figure 6 presents age-adjusteddiabetes death rates for the United States and the borderareas of the four border states. Death rates for theborder areas of New <strong>Mexico</strong> and Texas are significantlyhigher than the border areas of Arizona and California,as well as the United States. However, the diabetes deathrate declined statistically significantly in Texas between2000 and 2005, while the rate increased significantly in8
<strong>Health</strong>y <strong>Border</strong> <strong>2010</strong> Midterm Review–U.S. <strong>Border</strong> AreaRate per 100,000 populationFigure 9:HIV+ incidence rates, border counties of Arizona, New<strong>Mexico</strong>, and Texas, 2000-2004<strong>Health</strong>y<strong>Border</strong>Goal50%Source: Arizona, New <strong>Mexico</strong>, and Texas State <strong>Health</strong> Departments.borderwide health survey had included a question onhousehold sewage connection, but the cancellation of thissurvey eliminated the remaining source of any data forthis objective. Given the lack of baseline data or trackingdata, this objective should be dropped from <strong>Health</strong>y<strong>Border</strong> <strong>2010</strong>.Objective 7: Reduce number of hospital admissionsfor acute pesticide poisoning by 25 percent.This objective also was assigned developmental statusbecause it lacked a data source in 2000. A reviewof hospital discharge data for the U.S. border areaidentified very few discharges with pesticide poisoningas the principal diagnosis. Most individuals sufferingfrom acute pesticide poisoning exposure are treated inhospital emergency rooms and are never admitted to thehospital. Because it was not possible to obtain border areaemergency room admission data for pesticide poisoning,this objective should also be dropped from <strong>Health</strong>y<strong>Border</strong> <strong>2010</strong>.Focus Area 5: HIV/AIDSObjective 8: Reduce the HIV incidence rate by50 percent.The spread of HIV and AIDS has posed a major challengeto public health systems across the United States. Withinthe U.S. border area, the San Diego area has reported thehighest levels of HIV/AIDS 16 . The AIDS death ratein the remainder of the border (excluding San DiegoCounty) during the 1990s was statistically significantlylower than the U.S. national rate 17 , and the developmentof antiretroviral treatment regimens has further reducedthe AIDS incidence rate nationwide and on the border.Nevertheless, the incidence of HIV remains a majorpublic health issue, especially given that no vaccine or cureexists for HIV/AIDS.Thus, the objective chosen by <strong>Health</strong>y <strong>Border</strong> <strong>2010</strong>focused on prevention: reducing by half the incidenceof new HIV cases. Data collection for the forthcoming<strong>Border</strong> <strong>Health</strong> Status Report provided updated HIV/AIDS data for the U.S. border area, resulting in a revisionof the baseline value for the HIV objective. In 2000,only three border states–Arizona, New <strong>Mexico</strong>, andTexas–required HIV case reporting. Statewide HIV casereporting began in California in 2003, although therewere large fluctuations in the reported number of casesreported in the early years of the program.Progress for the three-state (Arizona, New <strong>Mexico</strong>, andTexas) border area can be evaluated because both year2000 baseline and tracking data are available. As shownin Figure 9, the HIV incidence rate declined from 6.7 per100,000 population in 2000 to 4.1 in 2004, a decline of 39percent for the three states. Recently collected HIV andAIDS data yield a 2004 HIV incidence rate of 12.0 for theentire (four-state) border area, nearly three times the ratefor the border area of Arizona, New <strong>Mexico</strong>, and Texas.10
<strong>Health</strong>y <strong>Border</strong> <strong>2010</strong> Midterm Review–U.S. <strong>Border</strong> AreaPercentnon-border areas (77.2 % versus 74.0 %). Tracking datafor this objective will be provided when additional years ofNIS data are available.§Source: National Immunization Survey, annual data.* Includes 4+ doses of diphtheria, tetanus and pertussis or diphtheria andtetanus; 3+ doses of polio vaccine; 1 dose of measles, mumps, Germanmeasles vaccine; and 3+ doses of Haemophilus influenzae.§ 95% confidence interval.Figure 10:Immunization* coverage rates for children 19-35 months,border region, 1998-2002Focus Area 6: Immunization andInfectious DiseasesObjective 9: Raise immunization coverage ratefor children 19-35 months to 90 percent.The National Immunization Survey (NIS) producesannual immunization coverage rates for all 50 statesand selected urban areas. Researchers can also produceseparate statistically reliable rates for the border frommultiple years of NIS data. Figure 10 providesimmunization coverage rates for children 19-35 monthsof age in the four border states from 1998-2002. Thecoverage rate includes the following immunizations: 4or more doses of diphtheria, tetanus, and pertussis ordiphtheria and tetanus; 3 or more doses of polio vaccine;1 dose of measles, mumps, German measles vaccine; and3 or more doses of Haemophilus influenzae (flu). Thecoverage rate for the border counties was higher than theObjectives 10-12: Reduce the incidence rate ofhepatitis A, hepatitis B, and tuberculosis by 50percent.County health offices and other health providers on theborder have sought to reduce hepatitis A and B incidencevia a variety of local immunization campaigns. The resultshave been dramatic, in particular for hepatitis A. The<strong>Border</strong> <strong>Health</strong> Status Report project has also producedupdated baseline rates for the hepatitis A and B objectives,while data from 1998 are included in Figures 11-12 todisplay the rapid declines in incidence rates for bothdiseases that began prior to 2000. For hepatitis A, the2003 incidence rate of 4.6 cases per 100,000 populationalready surpassed the year <strong>2010</strong> target of 5.5 per 100,000population. Meanwhile, the 2003 hepatitis B incidencerate of 1.6 was more than halfway to the <strong>2010</strong> target of1.1.Rate per 100,000 populationSource: State health departments of Arizona, California, New <strong>Mexico</strong>,and Texas.Figure 11:Hepatitis A incidence rates, border counties 1998-2003<strong>Health</strong>y<strong>Border</strong>Goal50%11
<strong>Health</strong>y <strong>Border</strong> <strong>2010</strong> Midterm Review–U.S. <strong>Border</strong> AreaRate per 100,000 population<strong>Health</strong>y<strong>Border</strong>Goal50%In response, a variety of efforts has also been developedto address the spread of TB. U.S. state and local TBprograms provide treatment for all TB cases and workto ensure continuity of care. For example, U.S. andMexican programs like CureTB in San Diego and TBNet in Texas (funded by CDC, USAID, and others) offerphone numbers for patient referrals and patient therapyinformation.Source: State health departments of Arizona, California, New <strong>Mexico</strong>,and Texas.Figure 12:Hepatitis B incidence rates, border counties 1998-2003Rate per 100,000 populationThe baseline value for the TB objective was also revisedbased on data collected for the <strong>Border</strong> <strong>Health</strong> StatusReport. As shown in Figure 13, the incidence of TBdeclined in the late 1990s but rose slightly from 2000 to2003. U.S. border area TB treatment programs will needto reduce the TB incidence by 52 percent from 2006 to<strong>2010</strong> to meet the <strong>2010</strong> target rate of 4.95 per 100,000population.<strong>Health</strong>y<strong>Border</strong>Goal50%Focus Area 7: Injury PreventionObjective 13: Reduce motor vehicle crash death rateby 25 percent.<strong>Border</strong> residents are highly mobile, traveling long distancesSource: State <strong>Health</strong> Departments of Arizona, California, New <strong>Mexico</strong>,and Texas.Figure 13:Tuberculosis incidence rates, border counties 1998-2003.Tuberculosis (TB) is another issue of major interest inthe U.S. border area because TB rates in U.S. bordercommunities are higher than the rates for the respectiveborder states overall. TB is often brought into the UnitedStates from foreign countries like México in three ways:a) persons with active TB disease move northward acrossthe border; b) persons with latent TB infection experienceactive disease after arrival in the United States; or c) U.S.residents touring México, including immigrants, acquireTB disease after returning to the United States (CDC,2001) 18 .Rate* per 100,000 population§Source: National mortality files, NCHS/CDC.* Rates are age-adjusted to the US 2000 standard population.§ 95% confidence interval.Figure 14:Motor vehicle crash death rates, USA and border counties,2000 and 200512
<strong>Health</strong>y <strong>Border</strong> <strong>2010</strong> Midterm Review–U.S. <strong>Border</strong> AreaRate per 100,000 population<strong>Health</strong>y<strong>Border</strong>Goal30%congenital anomalies. As shown in Figure 19, the infantmortality rate due to birth defects fell by nearly onequarterbetween 2000 and 2005, from 1.50 to 1.17 per1000 live births.Objective 17: Increase proportion of mothers gettingprenatal care in first trimester to 85 percent.Source: National mortality files, NCHS/CDC.Figure 16:Childhood (0-4 years) death rate due to accidents, bordercounties, 2000-2005Objective 16: Reduce infant mortality fromcongenital abnormalities by 30 percent.In recent years, congenital anomalies, or birth defects,have become a major area of interest among U.S. borderresidents, especially with regards to neural tube defects 20 .Because of the very small number of infant deathson the border due to neural tube defects, the objectiveselected for <strong>Health</strong>y <strong>Border</strong> <strong>2010</strong> focused on all types ofPer 1000 live birthsSource: National mortality and natality files, NCHS/CDC.§ 95 % confidence intervals.Figure 17:Infant mortality rates by ethnicity, USA and border counties,2000 and 2005§Initiation of prenatal care during the first trimester iscrucial for timely risk assessment and health promotion,especially for women who may be at high medicalor social risk 21 . However, access to prenatal care isparticularly challenging in the U.S. border area, because thelarge proportion of Hispanic births is combined with thelow health insurance rates and poor access to care amongthe Hispanic population. Table 2 presents the proportionof mothers who initiated prenatal care during the firsttrimester in the largest border counties in 2004. The lowrates in the border counties of Arizona and New <strong>Mexico</strong>are particularly notable.The rate of timely prenatal care initiation for the borderas a whole has gradually improved over the decade,however. The proportion of women initiating care in thefirst trimester has risen from 73.2 percent in 2000 to 77.7percent in 2004, which is about 38 percent of the progressrequired to meet the end-of-decade goal of 85 percent(Figure 20).Objective 18: Reduce pregnancy rate in adolescents(15-17 years old) by 33 percent.Adolescent (15-17 years) pregnancy and childbirth in theU.S. border area are issues of concern for various socialand health reasons. Following delivery, many adolescentmothers are at higher risk of earning less money andcompleting less schooling 22 . In addition, the adolescentpregnancy rate among Hispanics is the highest of allracial/ethnic groups nationally 23 .Data problems will require the modification of this14
<strong>Health</strong>y <strong>Border</strong> <strong>2010</strong> Midterm Review–U.S. <strong>Border</strong> AreaPer 1000 live birthsprogress called for under the <strong>2010</strong> goal of 29.0 (Figure21).<strong>Health</strong>y<strong>Border</strong>Goal15%Timely Initiation of Prenatal Care,U.S.-México border 2004Source: National mortality and natality files, NCHS/CDC.Figure 18:Infant mortality rate, border counties, 2000-2005objective’s wording. Given the focus on pregnancy, dataneeded to be obtained for all pregnancies, includingabortions. Access to abortion data by county andby age of mother, however, was not possible due toconfidentiality issues. As a result, the objective should berevised to focus on reducing the birth rate among women15-17 years of age. Since 2000 this objective has shownslow but steady progress: the adolescent birth rate hasdeclined from 43.3 births per 1000 women 15-17 yearsof age to 40.1 at mid-decade, about one-quarter of theRate per 1000 live birthsSource: National mortality and natality files, NCHS/CDC.<strong>Health</strong>y<strong>Border</strong>Goal30%Figure 19:Infant mortality rate due to congenital anomalies, bordercounties, 2000-2005AZ borderCA borderNM borderTXborderCochisePimaSanta CruzYumaImperialSan DiegoDona AnaGrantCameronEl PasoHidalgoMaverickStarrVal VerdeWebb69.7%69.8%64.6%58.2%76.0%87.6%64.9%73.0%65.9%67.0%81.9%75.4%79.6%88.4%70.4%Source: National natality files, NCHS/CDC.Table 2:Initiation of prenatal care, border counties, 2004Focus Area 9: Mental <strong>Health</strong>Objective 19: Reduce suicide mortality rate by 15percent.Suicide is one of the leading causes of death in U.S. borderstates, making it an issue of major interest. For example,in 2005, suicide was the ninth leading cause of death inthe four U.S. border states, with a rate of 10.6 per 100,000population. The suicide death rate was significantly higherin Arizona (16.2) and New <strong>Mexico</strong> (17.8). The suicidedeath rate in the border states was lower than the nationalrate (10.9), although this difference was not statisticallysignificant. It is also important to note that while thepercentages of adults who could not afford mental healthcare is lower than the national average, Hispanic adults are15
<strong>Health</strong>y <strong>Border</strong> <strong>2010</strong> Midterm Review–U.S. <strong>Border</strong> AreaPercent<strong>Health</strong>y<strong>Border</strong>Goal38%(Figure 23). Additionally, for certain parts of the border,the suicide death rate is high for 15-24 year olds: theborder counties suicide death rate was slightly less than thenational figure (8.8 versus 10.0 per 100,000); meanwhile,the suicide death rates for the Arizona and New <strong>Mexico</strong>border areas were higher than the national average (14.3and 13.3, respectively).Focus Area 10: Oral <strong>Health</strong>Source: National natality files, NCHS/CDC.Figure 20:Percent initiation of prenatal care in the first trimester, bordercounties, 2000-2004Births per 1000 women 15-17 years of age<strong>Health</strong>y<strong>Border</strong>Goal33%Objective 20: Increase proportion of populationusing oral health services to 75 percent per year.Oral health is an area of health care that is oftenoverlooked when considering health care needs. Aswith other issues of access to health care, the U.S. borderarea’s population and especially border Hispanics sufferfrom statistically significantly lower use of oral healthcare. As shown in Figure 24, about 64 percent of theU.S. adult population visited a dentist in the past 12months, as compared to 61 percent on the border andonly 44 percent for border Hispanics. Tracking data forthis objective will be available later in the decade. If noprospect of data exists, this objective should be revisited.Source: National natality files, NCHS/CDC.Figure 21:Early teenage (15-17 years) birth rate, border counties, 2000-2005significantly less able to access mental health care (Figure22).The year <strong>2010</strong> objective for mental health is based onsuicide deaths at all ages, with the target of 9.4 deaths per100,000 population in the combined border counties.Unfortunately, there has been no progress toward thetarget during the first half of the decade and, in fact,the rate has increased, from 11.0 in 2000 to 11.2 in 2005Focus Area 11: Respiratory DiseasesObjective 21: Reduce asthma hospitalization rate by40 percent.The U.S. prevalence of asthma has risen in the past twodecades, with a disproportionate impact especially onchildren and a statistically significantly higher rate in theU.S. border area. In response, public health programshave focused on the need for treatment and control toprevent the progression of cases to severe asthma and toavoid unnecessary and costly hospital stays. Additionally,more medications and guidelines for the control of thischronic disease have been developed, along with asthma16
<strong>Health</strong>y <strong>Border</strong> <strong>2010</strong> Midterm Review–U.S. <strong>Border</strong> AreaPercentPercent*§§Source: National <strong>Health</strong> Interview Survey, 2000-03; NCHS/CDC.* Age-adjusted to the US 2000 standard population.§ 95% confidence interval.Figure 22:Percent of adults who could not afford mental health care,USA and border counties, 2000-2003self-management education programs 24, 25 .<strong>Health</strong>y <strong>Border</strong> <strong>2010</strong> selected the asthma hospitaldischarge rate as the indicator for this objective. The datasource for this objective is the hospital discharge data filesfrom three of the four border states: Arizona, California,and Texas. Baseline data are available for this objective(Figure 25) and tracking data will be available later in thedecade. If no data are forthcoming, this objective will berevisited.Source: National <strong>Health</strong> Interview Survey, 2000-2003, NCHS/CDC.* Age-adjusted to the US 2000 standard population.§ 95% confidence intervals.Figure 24:Percent with visit to dentist in the past 12 months, USA andborder counties, 2000-2003Rate* per 10,000 population§Rate per 100,000 population<strong>Health</strong>y<strong>Border</strong>Goal15%* Rates are age-adjusted to the US 2000 standard population.Source: USA – National Hospital Discharge Survey, NCHS/CDC;States: Arizona, California, and Texas hospital discharge data systems.§ 95% confidence intervals.Figure 25:Hospital discharge rates due to asthma, USA and bordercounties, 2000* Rates are age-adjusted to the US 2000 standard population.Source: National mortality files, NCHS/CDC.Figure 23:Death rate due to suicide, border counties, 2000-200517
<strong>Health</strong>y <strong>Border</strong> <strong>2010</strong> Midterm Review–U.S. <strong>Border</strong> AreaSummary of <strong>Health</strong>y <strong>Border</strong> ProgressOverall, progress has been made towards achieving theobjectives of <strong>Health</strong>y <strong>Border</strong> <strong>2010</strong> from 2000 to 2005.Nineteen of the 21 objectives have baseline data, while14 have tracking data as well. The data source and/orwording of two objectives should be modified to ensurethat the objectives will be measurable. Objectives 6 and 7should also be dropped because there is no prospect ofacquiring baseline and tracking data before <strong>2010</strong>. Baselinedata were revised for Objectives 1, 5, 9, 20, and 21. Forthe 14 objectives with tracking data, Figure 26 summarizesprogress of <strong>Health</strong>y <strong>Border</strong> <strong>2010</strong> during the 2000-2005period.Diabetes risk factors continue to increase, which willmake the <strong>2010</strong> target for this objective even more difficultto reach. Increases in screening and diabetes treatmentprograms, along with activities to address diabetes riskfactors, are needed. Finally, while good progress wasreported in the HIV incidence rate for the border areasof Arizona, New <strong>Mexico</strong>, and Texas, it remains uncertainif progress will be achieved on this objective once theCalifornia data are included. Continued vigilance will berequired to achieve progress on this objective. Table 3summarizes basic information for each of the <strong>Health</strong>y<strong>Border</strong> objectives in 2005.Percent change since 2000A number of the <strong>Health</strong>y <strong>Border</strong> <strong>2010</strong> objectives haveachieved substantial progress by mid-decade. Thehepatitis A objective has already exceeded the <strong>2010</strong> targetby 2005, while three other objectives (breast cancer,cervical cancer, and childhood injury) have achieved 90percent or more of the progress called for by <strong>2010</strong>. Threeadditional objectives–birth defects, hepatitis B incidence,and HIV incidence–are more than halfway to their <strong>2010</strong>targets.Four objectives are notable for their insufficient progressor even movement away from the <strong>2010</strong> targets during thefirst half of the decade. Tuberculosis incidence on theborder has risen despite the efforts that have gone into TBdetection and treatment. Public health departments in theborder area will have to redouble their efforts to identifyand treat TB cases and track them to ensure they completetheir treatment regimen. Meanwhile, the significantnegative trend in motor vehicle crash deaths meansgreater law enforcement efforts, along with roadway safetyimprovements, will be required in the border counties.Additionally, the lack of progress in reducing suicidemortality implies that suicide prevention programs andother counseling efforts will have to be increased. Lastly,the very small reduction in diabetes mortality is troubling.Figure 26:Summary of progress for <strong>Health</strong>y <strong>Border</strong> objectives withtracking dataNext Steps for <strong>Health</strong>y <strong>Border</strong> <strong>2010</strong>The BHC is currently considering the next steps for thedevelopment of a <strong>Health</strong>y <strong>Border</strong> 2020 initiative thatwill include a final analysis of the <strong>Health</strong>y <strong>Border</strong> <strong>2010</strong>objectives at the end of the decade. The BHC encouragesall border health stakeholders to provide feedback to theBHC on this midterm review and to provide additionalinput on suggestions and recommendations on thedevelopment of <strong>Health</strong>y <strong>Border</strong> 2020.18
<strong>Health</strong>y <strong>Border</strong> <strong>2010</strong> Midterm Review–U.S. <strong>Border</strong> AreaTable 3: Status of <strong>Health</strong>y <strong>Border</strong> Objectives at Mid-Decade19
References:1U.S.-México <strong>Border</strong> <strong>Health</strong> <strong>Commission</strong>. <strong>Health</strong>y <strong>Border</strong> <strong>2010</strong>: An Agenda for Improving <strong>Health</strong> on the United States-México <strong>Border</strong>. 2003. http://www.borderhealth.org/files/res_63.pdf.2Ibid.3Forrest, C. and Starfield, B. “Entry into Primary Care and Continuity: The Effects of Access.” American Journal of Public <strong>Health</strong>. 88.9 (September1998): 1330-1336.4Andrulis, D. “Access to Care Is the Centerpiece in the Elimination of Socioeconomic Disparities in <strong>Health</strong>.” Annals of Internal Medicine. 129.5(September 1998): 412-416.5U.S. Department of <strong>Health</strong> and Human Services, <strong>Health</strong> Resource Services Administration, Maternal and Child <strong>Health</strong> Bureau. Women’s <strong>Health</strong>USA 2007. Rockville, Maryland: Department of <strong>Health</strong> and Human Services, 2006.6O’Brien, K., Cokkinides, V., Jemal, A., Cardinez, C., Murray, T., Samuels, A., Ward, E. and Thun, M. “Cancer Statistics for Hispanics, 2003.” CA: ACancer Journal for Clinicians. 53.4 (2003): 208-226.7Coughlin, S., Uhler, R., Richards, T. and Wilson, K. “Breast and Cervical Cancer Screening Practices Among Hispanic and Non-Hispanic WomenResiding Near the United States-México <strong>Border</strong>, 1999-2000.” Family & Community <strong>Health</strong>. 26.2 (April-Jun 2003): 130-139.8Fernández, L. and Morales, A. “Language and Use of Cancer Screening Services Among <strong>Border</strong> and Non-<strong>Border</strong> Hispanic Texas Women.”Ethnicity & <strong>Health</strong>. 12.3 (June 2007): 245-263.9U.S. Department of <strong>Health</strong> and Human Services, Women’s <strong>Health</strong> USA 2007.10“Evidence of Benefit.” 10 April 2008. U.S. National Institutes of <strong>Health</strong>, National Cancer Institute. 10 December 2008. http://www.cancer.gov/cancertopics/pdq/screening/cervical/<strong>Health</strong>Professional/page4.11Skyler, J. and Oddo, C. “Diabetes Trends in the USA.” Diabetes/Metabolism Research and Review. 18.3 (September-October 2002): S21-6.12Stern, M. and Mitchell, B. “Diabetes in Hispanic Americans.” Diabetes in America. 1995.13Jiang, H., Stryer, D., Friedman, B. and Andrews, R. “Multiple Hospitalizations for Patients with Diabetes.” Diabetes Care. 26.5 (May 2003): 1421-1427.14Centers for Disease Control and Prevention. “Geographic Disparities in Diabetes-Related Amputations–Texas-México <strong>Border</strong>, 2003.” Journal ofthe American Medical Association. 297.10 (March 14, 2007): 1051-1052.15Ibid.16U.S.-México <strong>Border</strong> <strong>Health</strong> Association. Sister Communities <strong>Health</strong> Profiles: United States-México <strong>Border</strong>, 1989-91. El Paso, TX; 1994.17Ibid.18Lobato, M. and Cegielski, P. “Preventing and Controlling Tuberculosis along the U.S.-México <strong>Border</strong>.” Mortality and Morbidity Weekly Reports.(January 19, 2001).19Scribner, R. “Editorial: Paradox as Paradigm–The <strong>Health</strong> Outcomes of Mexican Americans.” American Journal of Public <strong>Health</strong>. 86.3 (March1996): 303-304.20Hendricks, K., Simpson, J. and Larsen, R. “Neural Tube Defects along the Texas-México <strong>Border</strong> 1993-1995.” American Journal of Epidemiology.149: 1119-1127.21Braveman, P., Marchi, K., Egerter, S., Pearl, M. and Neuhaus, J. “Barriers to Timely Prenatal Care Among Women With Insurance: The Importanceof Prepregnancy Factors.” Obstetrics & Gynecology. 95 (2000): 874-880.22Hoffman, S. “Teenage Childbearing Is Not So Bad After All…Or Is It? A Review of the New Literature.” Family Planning Perspectives. 30.5(September/October 1998): 236-243.23Ventura, S., Curtin, S. and Mathews, T. “Variations in Teenage Birth Rates, 1991-1998: National and State Trends.” National Vital Statistis Report.48.6 (April 24, 2000): 1-16,24Moorman, J., Rudd, R., Johnson, C., King, M., Bailey, C., Scalia, M. and Akinbami, L. “National Surveillance for Asthma–United States, 1980-2004.”Morbidity and Mortality Weekly Reports. 56.SS08 (October 19, 2007): 1-14, 18-54.25National Asthma Education and Prevention Program. Expert Panel Report 3 (EPR-3): Guidelines for the Diagnosis and Management ofAsthma–Summary Report 2007. Journal of Allergy and Clinical Immunology. 120.5 Suppl. (2007): S94-138.Credits:A special thanks to F. Sam Notzon, Ph.D., Director, International Statistics Program, National Center for <strong>Health</strong> Statistics, for his invaluable statisticalconsultation provided to this project.Photos: U.S.-México <strong>Border</strong> Diabetes Project, U.S.-México <strong>Border</strong> Office, Pan American <strong>Health</strong> Organization; New <strong>Mexico</strong> Office of <strong>Border</strong><strong>Health</strong>; México Section, BHC; U.S. Customs and <strong>Border</strong> Protection, Department of Homeland Security.20
In the United States211 N. Florence, Suite 101El Paso, TX 79901Tel. (915) 532-1006Fax: (915) 532-1697Toll Free: (866) 785-9867www.borderhealth.orgIn MéxicoAvenida Durango No. 247,4o pisoCol. Roma, Delegación CuauhtémocC.P. 06700 México, D.F.Tel. and Fax: (01152-55) 3611-0765 al 67www.saludfronteriza.org.mx22