PERFORMANCE WITH PURPOSE - PepsiCo
PERFORMANCE WITH PURPOSE - PepsiCo
PERFORMANCE WITH PURPOSE - PepsiCo
- No tags were found...

Create successful ePaper yourself
Turn your PDF publications into a flip-book with our unique Google optimized e-Paper software.
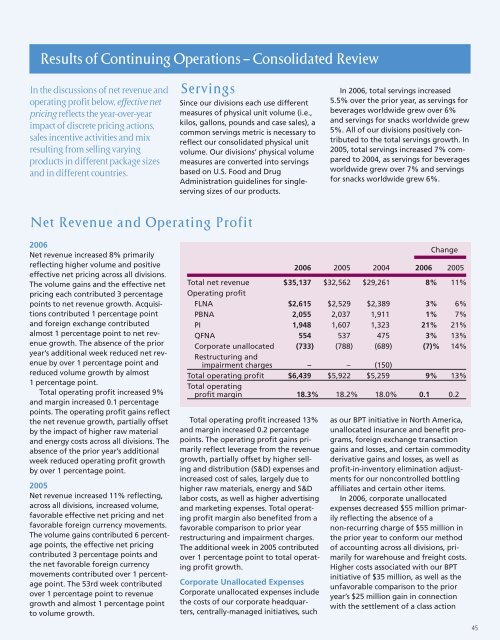
267419_L01_P27_81.v4.qxd 3/6/07 7:13 AM Page 45Results of Continuing Operations — Consolidated ReviewIn the discussions of net revenue andoperating profit below, effective netpricing reflects the year–over–yearimpact of discrete pricing actions,sales incentive activities and mixresulting from selling varyingproducts in different package sizesand in different countries.ServingsSince our divisions each use differentmeasures of physical unit volume (i.e.,kilos, gallons, pounds and case sales), acommon servings metric is necessary toreflect our consolidated physical unitvolume. Our divisions’ physical volumemeasures are converted into servingsbased on U.S. Food and DrugAdministration guidelines for singleservingsizes of our products.In 2006, total servings increased5.5% over the prior year, as servings forbeverages worldwide grew over 6%and servings for snacks worldwide grew5%. All of our divisions positively contributedto the total servings growth. In2005, total servings increased 7% comparedto 2004, as servings for beveragesworldwide grew over 7% and servingsfor snacks worldwide grew 6%.Net Revenue and Operating Profit2006Net revenue increased 8% primarilyreflecting higher volume and positiveeffective net pricing across all divisions.The volume gains and the effective netpricing each contributed 3 percentagepoints to net revenue growth. Acquisitionscontributed 1 percentage pointand foreign exchange contributedalmost 1 percentage point to net revenuegrowth. The absence of the prioryear’s additional week reduced net revenueby over 1 percentage point andreduced volume growth by almost1 percentage point.Total operating profit increased 9%and margin increased 0.1 percentagepoints. The operating profit gains reflectthe net revenue growth, partially offsetby the impact of higher raw materialand energy costs across all divisions. Theabsence of the prior year’s additionalweek reduced operating profit growthby over 1 percentage point.2005Net revenue increased 11% reflecting,across all divisions, increased volume,favorable effective net pricing and netfavorable foreign currency movements.The volume gains contributed 6 percentagepoints, the effective net pricingcontributed 3 percentage points andthe net favorable foreign currencymovements contributed over 1 percentagepoint. The 53rd week contributedover 1 percentage point to revenuegrowth and almost 1 percentage pointto volume growth.Total operating profit increased 13%and margin increased 0.2 percentagepoints. The operating profit gains primarilyreflect leverage from the revenuegrowth, partially offset by higher sellingand distribution (S&D) expenses andincreased cost of sales, largely due tohigher raw materials, energy and S&Dlabor costs, as well as higher advertisingand marketing expenses. Total operatingprofit margin also benefited from afavorable comparison to prior yearrestructuring and impairment charges.The additional week in 2005 contributedover 1 percentage point to total operatingprofit growth.Corporate Unallocated ExpensesCorporate unallocated expenses includethe costs of our corporate headquarters,centrally-managed initiatives, suchChange2006 2005 2004 2006 2005Total net revenue $35,137 $32,562 $29,261 8% 11%Operating profitFLNA $2,615 $2,529 $2,389 3% 6%PBNA 2,055 2,037 1,911 1% 7%PI 1,948 1,607 1,323 21% 21%QFNA 554 537 475 3% 13%Corporate unallocated (733) (788) (689) (7)% 14%Restructuring andimpairment charges – – (150)Total operating profit $6,439 $5,922 $5,259 9% 13%Total operatingprofit margin 18.3% 18.2% 18.0% 0.1 0.2as our BPT initiative in North America,unallocated insurance and benefit programs,foreign exchange transactiongains and losses, and certain commodityderivative gains and losses, as well asprofit-in-inventory elimination adjustmentsfor our noncontrolled bottlingaffiliates and certain other items.In 2006, corporate unallocatedexpenses decreased $55 million primarilyreflecting the absence of anon-recurring charge of $55 million inthe prior year to conform our methodof accounting across all divisions, primarilyfor warehouse and freight costs.Higher costs associated with our BPTinitiative of $35 million, as well as theunfavorable comparison to the prioryear’s $25 million gain in connectionwith the settlement of a class action45