HTI HIGH TECH INDUSTRIES AG
HTI HIGH TECH INDUSTRIES AG
HTI HIGH TECH INDUSTRIES AG
- No tags were found...
Create successful ePaper yourself
Turn your PDF publications into a flip-book with our unique Google optimized e-Paper software.
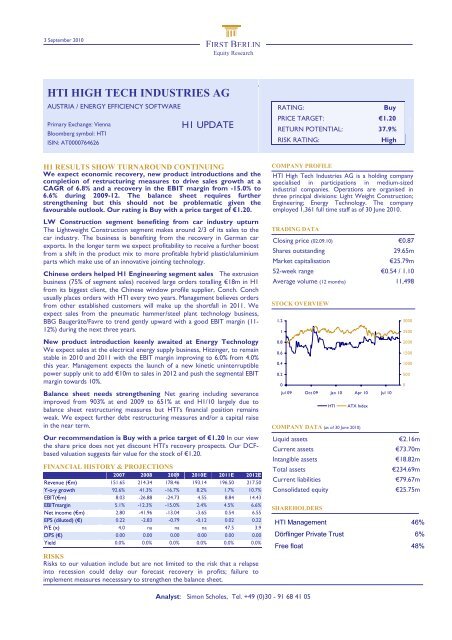
3 September 2010FIRST BERLIN<strong>HTI</strong> High Tech Industries <strong>AG</strong>Equity Research<strong>HTI</strong> <strong>HIGH</strong> <strong>TECH</strong> <strong>INDUSTRIES</strong> <strong>AG</strong>AUSTRIA / ENERGY EFFICIENCY SOFTWAREPrimary Exchange: ViennaBloomberg symbol: <strong>HTI</strong>ISIN: AT0000764626H1 UPDATE<strong>HTI</strong>3 September 2010RATING:BuyPRICE TARGET: €1.20RETURN POTENTIAL: 37.9%RISK RATING:HighH1 RESULTS SHOW TURNAROUND CONTINUINGWe expect economic recovery, new product introductions and thecompletion of restructuring measures to drive sales growth at aC<strong>AG</strong>R of 6.8% and a recovery in the EBIT margin from -15.0% to6.6% during 2009-12. The balance sheet requires furtherstrengthening but this should not be problematic given thefavourable outlook. Our rating is Buy with a price target of €1.20.LW Construction segment benefiting from car industry upturnThe Lightweight Construction segment makes around 2/3 of its sales to thecar industry. The business is benefiting from the recovery in German carexports. In the longer term we expect profitability to receive a further boostfrom a shift in the product mix to more profitable hybrid plastic/aluminiumparts which make use of an innovative jointing technology.Chinese orders helped H1 Engineering segment sales The extrusionbusiness (75% of segment sales) received large orders totalling €18m in H1from its biggest client, the Chinese window profile supplier, Conch. Conchusually places orders with <strong>HTI</strong> every two years. Management believes ordersfrom other established customers will make up the shortfall in 2011. Weexpect sales from the pneumatic hammer/steel plant technology business,BBG Baugeräte/Favre to trend gently upward with a good EBIT margin (11-12%) during the next three years.New product introduction keenly awaited at Energy TechnologyWe expect sales at the electrical energy supply business, Hitzinger, to remainstable in 2010 and 2011 with the EBIT margin improving to 6.0% from 4.0%this year. Management expects the launch of a new kinetic uninterruptiblepower supply unit to add €10m to sales in 2012 and push the segmental EBITmargin towards 10%.Balance sheet needs strengthening Net gearing including severanceimproved from 903% at end 2009 to 651% at end H1/10 largely due tobalance sheet restructuring measures but <strong>HTI</strong>’s financial position remainsweak. We expect further debt restructuring measures and/or a capital raisein the near term.Our recommendation is Buy with a price target of €1.20 In our viewthe share price does not yet discount <strong>HTI</strong>’s recovery prospects. Our DCFbasedvaluation suggests fair value for the stock of €1.20.FINANCIAL HISTORY & PROJECTIONS2007 2008 2009 2010E 2011E 2012ERevenue (€m) 151.65 214.34 178.46 193.14 196.50 217.50Y-o-y growth 92.6% 41.3% -16.7% 8.2% 1.7% 10.7%EBIT(€m) 8.03 -26.88 -24.73 4.55 8.84 14.43EBITmargin 5.1% -12.3% -15.0% 2.4% 4.5% 6.6%Net income (€m) 2.80 -41.96 -13.04 -3.65 0.54 6.55EPS (diluted) (€) 0.22 -2.83 -0.79 -0.12 0.02 0.22P/E (x) 4.0 na na na 47.5 3.9DPS (€) 0.00 0.00 0.00 0.00 0.00 0.00Yield 0.0% 0.0% 0.0% 0.0% 0.0% 0.0%RISKSRisks to our valuation include but are not limited to the risk that a relapseinto recession could delay our forecast recovery in profits; failure toimplement measures necesssary to strengthen the balance sheet.COMPANY PROFILE<strong>HTI</strong> High Tech Industries <strong>AG</strong> is a holding companyspecialised in participations in medium-sizedindustrial companies. Operations are organised inthree principal divisions: Light Weight Construction;Engineering; Energy Technology. The companyemployed 1,361 full time staff as of 30 June 2010.TRADING DATAClosing price (02.09.10) €0.87Shares outstanding 29.65mMarket capitalisation€25.79m52-week range €0.54 / 1.10Average volume (12 months) 11,498STOCK OVERVIEW1.210.80.60.40.20Jul 09 Oct 09 Jan 10 Apr 10 Jul 10<strong>HTI</strong>ATX IndexCOMPANY DATA (as of 30 June 2010)Liquid assetsCurrent assetsIntangible assetsTotal assetsCurrent liabilitiesConsolidated equitySHAREHOLDERS300025002000150010005000€2.16m€73.70m€18.82m€234.69m€79.67m€25.75m<strong>HTI</strong> Management 46%Dörflinger Private Trust 6%Free float 48%Analyst: Simon Scholes, Tel. +49 (0)30 - 91 68 41 05
3 September 2010 <strong>HTI</strong> High Tech Industries <strong>AG</strong>H1 2010 RESULTS SHOW TURNAROUND CONTINUINGEBIT returned to the black in H1/10 The turnaround at <strong>HTI</strong> apparent since H2/09 continued in H1/10.H1/10 results (see table 1 below) showed a 9.3% rise in sales to €98.2m (H1/09 €89.8m). At the segmentallevel, sales at Lightweight Construction and Engineering rose by 9.3% and 27.6% respectively while EnergyTechnology’s sales fell back by 5.4%.H1/10 EBIT rebounded to €3.2m from €-15.5m in H1/09. Theturnaround was attributable to a higher revenue base, plant closures and personnel reductions. At endH1/10, <strong>HTI</strong> had 1,361 full time employees compared with 1,543 at end H1/09. However the net result inH1/10 was a small loss of €0.9m while the comparable figure for H1/09 was €3.9m. Reported profitabilityworsened at the net level because H1/09 numbers benefited from an extraordinary gain of €34.3m inconnection with the restructuring of <strong>HTI</strong> debts.Table 1: H1 Results by Divsionin €'000 H1/09A H1/10ASales 89,841 98,172change (%) n.a 9.3%by segment:Light Weight Construction 45,043 49,221change (%) n.a 9.3%Engineering 21,957 28,023change (%) n.a 27.6%Energy Technology 22,125 20,934change (%) n.a -5.4%EBIT -15,479 3,247margin (%) -17.2% 3.3%Light Weight Construction -9,493 51margin (%) -21.1% 0.1%Engineering -5,190 2,996margin (%) -23.6% 10.7%Energy Technology 678 921margin (%) 3.1% 4.4%Other -1,473 -721Source: <strong>HTI</strong>; First Berlin Equity Research estimatesLightweight Construction benefiting from reviving car industry The Lightweight Constructionsegment makes c. 66% of its sales to the automotive industry and benefited from the strong recovery inGerman manufacturers’ exports. Segmental sales rose to €49.2m in H1/10 (H1/09: €45.0m). During H1/10the segment won several new contracts for both plastic and aluminium components from car manufacturerssuch as Audi, BMW, Skoda and VW. Lightweight construction was also able to book several new ordersfrom the truck industry including a large contract from a leading supplier of electronic braking systems.During H1/10 sales spilt roughly 50/50 between the plastics and metals businesses. We gather that sales atthe plastics business fell slightly following the closure of the Türkheim and Strasslach plants in H2/09. Salesgrowth in H1/10 was thus attributable solely to <strong>HTI</strong>’s metals business, Gruber & Kaja. Segmental EBITimproved to €0.1m from €-9.4m in H1/09 despite €1m in restructuring charges. Both the metals and plasticsbusinesses were loss-making in H1/09. From talking to management, we gather that in H1/10 the metalsbusiness made a small profit while the deficit in the plastics business narrowed substantially.Extrusion business drove H1 sales growth in Engineering Sales at the Engineering segment rose by27.6% to €28.0m in H1/10 (H1/09: €22.0m), driven primarily by strong sales growth in the extrusionbusiness which in January received a €16m order from Conch, China’s largest manufacturer of windowprofiles. The extrusion business won a smaller €2m follow-up order from Conch in April. The Engineeringsegment’s other business, BBG Baugeräte, designs, manufactures and markets low-vibration and noisereducedpneumatic hammers in ten different weight categories. BBG Baugeräte also manufactures pneumaticand hydraulic tap hole rotary hammer drills for blast furnaces and non-ferrous metal furnaces and producesmachines for repairing tapholes in electric furnaces and steel converters. Business at BBG Baugerätedevelops most strongly during the latter part of a business cycle. Sales were accordingly flat during H1/10.Segmental EBIT jumped from €-9.3m in H1/09 to €3.0m in H1/10. Profitability was boosted by strongerrevenues, the impact of restructuring measures and also by a €2m gain resulting from the foundation ofTMT-BBG Research and Development GmbH with the German/Luxembourgeois taphole technologycompany, TMT.2
3 September 2010 <strong>HTI</strong> High Tech Industries <strong>AG</strong>Operating margin improvement at Hitzinger The Energy Technology segment houses Hitzinger <strong>AG</strong>,which specialises in equipment for electrical energy supply. This is another late cycle business and so it is notsurprising that sales fell slightly in H1/10 by 5.4% to €20.9m. (H1/09:€22.1m). Nevertheless Hitzinger wasable to book several interesting new orders in H1/10, especially for generators and uninterrupted powersupplies. These included four uninterrupted power supplies for Greenpoint Stadium in Cape Town and twofurther units for the new Nelson Mandela Stadium in Port Elizabeth. Two uninterrupted power supplieswere delivered to Philipp Morris in Singapore and numerous emergency power supplies were delivered tothe earthquake region in Haiti and also to Austria. Despite the decline in sales, management succeeded inraising the segment’s operating margin from 3.1% to 4.4%.FINANCIAL POSITION IMPROVES BUT REMAINS WEAK<strong>HTI</strong>’s net working capital position expanded by €6.8m in H1/10 as sales grew and was primarily responsiblefor a free cash outflow of €5.1m. Despite this cash outflow, the company was able to reduce its net gearingincluding pensions from 903% at end 2009 to 651% at end H1/10 by converting €8m of debt into asubordinated instrument. Although net gearing fell during H1/10, <strong>HTI</strong>’s financial position can only be termedweak and we expect further debt restructuring measures and/or a capital raise in the near term.OUTLOOKFY 2010 forecasts for Lightweight Construction are conservative Following on from sales of€49.2m in H1/10, we forecast sales of €39.9m for H2/10 – thereby taking into account the possibility of aslowdown in business over the summer months. We are also looking for a small loss of €0.4m at the EBITlevel for the full year after H1/10’s EBIT of €0.1m.Management is cautious on sales growth for the segment in 2011. We have pencilled in 2011 sales of €90mi.e. almost unchanged on 2010. However we expect the EBIT margin to widen somewhat from -0.4% in 2010to 3.9% following the completion of restructuring work at the plastics business. In 2012 we expect segmentalsales to move ahead by €4m due to new product introductions at Gruber & Kaja and the segmental EBITmargin to improve to 4.5%.Earlier this year <strong>HTI</strong> was able to replace a protrusion in one of Audi’s metal parts with plastic. Productsmaking use of jointing technologies enjoy higher margins. Such products currently account for only a smallpart of segmental sales but management plans that within 5-7 years they should account for 50% of divisionalsales. The move towards hybrid parts is the main element in management’s plan to improve the segmentalEBIT margin to 5-8% by the middle of this decade.Engineering: Conch orders follow biennial cycle We expect 2010 sales in the Engineering segment tosplit approximately 75:25 between the extrusion business and BBG Baugeräte. H2/10 should be slightlyabove the H1 level helped by the completion of the Conch contracts. However profitability in H2/10 is likelyto be well down on the H1/10 level due to the absence of the €2m gain from the foundation of TMT-BBGResearch and Development GmbH.In recent years the extrusion business has received large orders from Conch every two years. Non-Conchsales by the extrusion business reached a historically low level in 2009 and look likely to be unchanged in2010. For 2011 we expect sales to other regions in which the extrusion business has established customerssuch as East Europe, Germany, India, Ireland and Turkey to make up for the shortfall caused by the absenceof Chinese business. 2011 sales should benefit from the introduction in late October 2010 of a newextrusion line at the industry’s largest trade fair in Cologne. The new line will combine the expertise ofTheysohn and Technoplast, the two extrusion companies <strong>HTI</strong> bought in 2008. Management claims that <strong>HTI</strong>is now the world’s only “one-stop-shop” for extrusion line equipment. Margins in the extrusion businessshould be helped in 2011 and 2012 by the completion of restructuring work. During 2010-2012 we look forgentle growth in BBG sales at a constant EBIT margin (11-12%).New product to boost Hitzinger sales from 2012 Hitzinger’s seasonality means that H2 sales arenormally stronger than the H1 figure. We do not expect 2010 to be an exception to this pattern and lookfor H2/10 sales of €25.4m after €20.9m in €H1/10. <strong>HTI</strong> has been able to increase margins steadily atHitzinger since acquiring the company in 2007 by hiring new management and improving purchasing. For2011 we expect an improvement in the EBIT margin to 6.0% from 4.6% in 2010. Hitzinger plans the launchof a new kinetic uninterruptible power supply unit in 2012. Management expects this product to boostcompany sales by €10m and help raise the segmental EBIT margin to 10.0%. A move to lower cost premisesalso plays a role in our forecast margin increase.3
3 September 2010 <strong>HTI</strong> High Tech Industries <strong>AG</strong>Table 2: Forecast by Divsionin €'000 2009A 2010E 2011E 2012ESales 178,463 193,135 196,500 217,500change (%) -16.7% 8.2% 1.7% 10.7%by segment:Light Weight Construction 95,942 89,140 90,000 94,000change (%) n.a -7.1% 1.0% 4.4%Engineering 36,074 57,652 59,000 66,000change (%) n.a 59.8% 2.3% 11.9%Energy Technology 45,729 46,343 47,500 57,500change (%) n.a 1.3% 2.5% 21.1%Other 718 0 0 0EBIT -24,733 4,550 8,845 14,430margin (%) -15.0% 2.4% 4.5% 6.6%Light Weight Construction -17,761 -369 3,540 4,260margin (%) -18.5% -0.4% 3.9% 4.5%Engineering -6,631 4,667 4,390 6,375margin (%) -18.4% 8.1% 7.4% 9.7%Energy Technology 2,176 2,151 2,850 5,750margin (%) 4.8% 4.6% 6.0% 10.0%Other -2,518 -1,899 -1,935 -1,955Source: <strong>HTI</strong>; First Berlin Equity Research estimatesVALUATIONWe see fair value at €1.20; recommendation is Buy We have chosen to value <strong>HTI</strong> using DCFmethodology as we feel that this better captures the likely trajectory of the group’s earning developmentthan peer group valuation.We show part of our DCF valuation model below (in the full model the explicit period extends to 2020).Our DCF model is based on a cost of equity of 14.8%. We expect the company’s long-term capitalstructure to be one-half equity, one-half debt. Using this ratio, we arrive at a WACC of 9.1%. Discountingforecast cash flows produces a valuation for <strong>HTI</strong> of €1.20 per share.DCF model€m H2 10E 2011E 2012E 2013E 2014E 2015E 2016ENet sales 94,963 196,500 217,500 228,560 240,331 252,868 266,229NOPLAT 1,303 8,845 14,430 17,766 21,276 23,636 26,252+ depreciation & amortis. (excl. GW) 6,105 12,183 13,485 14,171 16,102 16,942 17,837= net operating cash flow 7,408 21,028 27,915 31,937 37,379 40,579 44,089- total investments (Capex and WC) -14,330 -283 -14,807 -17,756 -22,233 -23,471 -19,471Capital expenditure -3,983 -8,516 -16,620 -16,641 -21,046 -22,208 -20,787working capital -10,347 8,233 1,813 -1,115 -1,187 -1,264 1,315+/- others (incl. adj. on net int., provisions, etc) 0 0 0 0 0 0 0= Free cash flow (FCF) -10,981 20,745 13,108 14,181 15,146 17,107 24,618PV of FCF's -10,669 18,467 10,692 10,598 10,371 10,734 14,153€mPVs of FCFs explicit period (2010-20) 102,563PVs of FCFs in terminal period 103,675Enterprise Value (EV) 206,238(Net cash)/net debt 167,543Minorities 3,000Shareholder value 35,695Sensitivity analysisFair value per shareValue per share (€) 1.20Terminal margin (%)WACC 9.14% 6.0% 7.0% 8.0% 9.0% 10.0% 11.0% 12.0%Cost of equity 14.8% 5.1% 5.81 7.30 8.79 10.27 11.76 13.25 14.73Pre-tax cost of debt 5.0% 6.1% 3.31 4.33 5.36 6.38 7.40 8.42 9.44Normal tax rate 30.0% 7.1% 1.75 2.49 3.24 3.99 4.74 5.48 6.23After-tax cost of debt 3.5% 8.1% 0.67 1.24 1.80 2.37 2.94 3.51 4.08Share of equity 50.0% 9.1% -0.13 0.32 0.76 1.20 1.65 2.09 2.54Share of debt 50.0% 10.1% -0.75 -0.39 -0.04 0.32 0.67 1.03 1.38Terminal growth 2.0% 11.1% -1.24 -0.95 -0.66 -0.38 -0.09 0.20 0.49Terminal margin 9.0% 12.1% -1.65 -1.41 -1.17 -0.94 -0.70 -0.46 -0.23WACCSource: First Berlin Equity Research estimates4
3 September 2010 <strong>HTI</strong> High Tech Industries <strong>AG</strong>INCOME STATEMENT ANALYSISAll figures in €'000 2007 2008 2009 2010E 2011E 2012ERevenues 151,645 214,335 178,463 193,135 196,500 217,500Change in inventories & capitalised prod 6,154 4,409 -13,516 0 0 0Total output 157,799 218,744 164,947 193,135 196,500 217,500Cost of materials -79,208 -124,387 -85,420 -96,568 -98,250 -106,575Gross profit 78,591 94,357 79,527 96,568 98,250 110,925Total personnel costs -42,926 -73,214 -65,108 -61,803 -61,898 -66,338Net other operating costs -17,929 -33,058 -24,872 -18,240 -15,325 -16,672Dep. & amort. -9,705 -14,965 -14,280 -11,974 -12,183 -13,485EBIT 8,031 -26,880 -24,733 4,550 8,845 14,430Net interest -5,159 -9,569 -9,115 -7,000 -7,997 -7,540Associates 84 46 -66 1 0 0Other financial items -152 2,663 766 -100 0 0Profit from ordinary operations 2,804 -33,740 -33,148 -2,549 847 6,890Extraordinary items 0 -20,892 61,491 -600 0 0Pretax profit 2,804 -54,720 -5,692 -3,149 847 6,890Income taxes -2 12,819 -7,014 -200 0 0Minority interests 0 62 333 299 304 337Net income / loss 2,802 -41,963 -13,039 -3,648 543 6,554EPS (€) 0.22 -2.83 -0.79 -0.12 0.02 0.22EBITDA 17,736 -11,915 -10,453 16,524 21,028 27,915RatiosGross margin 49.8% 43.1% 48.2% 50.0% 50.0% 51.0%EBIT margin 5.1% -12.3% -15.0% 2.4% 4.5% 6.6%EBITDA margin 11.2% -5.4% -6.3% 8.6% 10.7% 12.8%Net income margin 1.8% -19.2% -7.9% -1.9% 0.3% 3.0%Tax rate 0.1% 23.4% -123.2% -6.4% 0.0% 0.0%Expenses as % of outputPersonnel -27.2% -33.5% -39.5% -32.0% -31.5% -30.5%Net other operating income/expenses -11.4% -15.1% -15.1% -9.4% -7.8% -7.7%Dep. & amort. -6.2% -6.8% -8.7% -6.2% -6.2% -6.2%Y-o-y growthTotal revenues 92.6% 41.3% -16.7% 8.2% 1.7% 10.7%EBIT 279.0% n.a. -8.0% n.a. 94.4% 63.1%Net income / loss n.a. n.a. n.a. n.a. n.a. 1106.5%Source: <strong>HTI</strong>; First Berlin Equity Research estimates5
3 September 2010 <strong>HTI</strong> High Tech Industries <strong>AG</strong>BALANCE SHEET ANALYSISAll figures in €'000 2007 2008 2009 2010E 2011E 2012EAssetsCurrent assets, total 80,466 115,264 72,331 76,623 75,063 85,260Cash and cash equivalents 18,948 9,650 5,829 2,897 5,895 8,700Trade accounts and notes receivables 23,709 33,226 23,591 27,039 27,510 30,450Inventories 30,976 54,030 27,253 27,039 27,510 32,625Other current assets 6,833 18,358 15,658 19,648 14,148 13,485Non-current assets, total 112,732 185,233 161,710 158,604 154,944 158,117Property, plant and equipment 85,655 98,907 99,312 96,415 102,127 111,832Goodwill 5,120 33,021 31,672 31,672 31,672 31,672Other intangible assets 12,417 18,101 18,947 18,133 18,133 18,133Financial assets 3,550 3,563 1,904 2,011 2,011 2,011Deferred tax assets 7,676 21,256 10,215 10,042 10,042 10,042Other non-current assets -1,686 10,385 -340 331 -9,042 -15,573Total assets 193,198 300,497 234,041 235,227 230,007 243,377Shareholders' equity & debtCurrent liabilities, total 69,729 166,476 79,437 79,832 82,181 91,305Interest bearing debt 31,117 86,399 27,039 28,174 26,071 25,336Trade accounts payable 21,508 35,178 18,747 18,348 19,650 26,100Tax provisions 957 468 312 386 393 435Other current liabilities 16,147 44,431 33,339 32,924 36,066 39,433Non-current liabilities, total 77,226 125,752 136,135 132,457 124,057 121,517Interest bearing debt 51,853 84,592 109,111 113,690 105,206 102,240Long term provisions (social capital) 5,584 9,751 8,655 0 0 0Deferred tax liabilities 2,528 5,774 957 966 983 1,088Other non-current liabilities 17,261 25,635 17,412 17,802 17,869 18,190Consolidated equity 46,243 8,269 18,469 22,938 23,769 30,554Shareholders' equity 46,243 5,942 16,265 20,435 20,962 27,411Minorities 0 2,327 2,204 2,503 2,807 3,144Total consolidated equity and debt 193,198 300,497 234,041 235,227 230,007 243,377RatiosCurrent ratio 1.15 0.69 0.91 0.96 0.91 0.93Quick ratio 0.71 0.37 0.57 0.62 0.58 0.58Equity ratio (as%) 23.9% 2.8% 7.9% 9.8% 10.3% 12.6%Debt to equity ratio (gearing as %) 184.5% 2414.0% 849.0% 725.1% 646.1% 484.4%Equity per share 3.30 0.38 0.79 0.69 0.71 0.92Net debt 85,319 199,617 156,801 166,323 153,576 148,007Interest coverage ratio -1.33 2.55 2.46 0.59 1.00 1.74Capital employed (CE) 131,562 207,886 175,270 189,261 177,345 178,562Return on capital employed (ROCE) 5.4% -11.1% 0.0% 0.0% 3.4% 5.7%Return on Equity (ROE) 7.2% -154.0% -97.5% -17.6% 2.3% 24.1%Source: <strong>HTI</strong>; First Berlin Equity Research estimates6
3 September 2010 <strong>HTI</strong> High Tech Industries <strong>AG</strong>CASHFLOW ANALYSISAll figures in €'000 2005 2006 2007 2008 2009 2010E 2011E 2012EPretax result 7,591 -1,165 2,804 -54,720 -12,706 -3,149 847 6,890Depreciation and amortisation 8,141 6,675 9,705 22,506 15,378 11,974 12,183 13,485Other -747 1,592 -856 -5,146 -23,653 0 0 0Operating cash flow 14,985 7,102 11,653 -37,360 -20,981 8,825 13,030 20,375Investment in working capital -9,938 -7,190 -7,047 20,966 14,285 -17,097 8,233 1,813Net operating cash flow 5,047 -88 4,606 -16,394 -6,696 -8,272 21,263 22,189Cashflow from investing -5,243 -12,355 -35,070 -46,121 -2,773 -7,403 -8,516 -16,620Free cash flow -196 -12,443 -30,464 -62,515 -9,469 -15,675 12,747 5,569Dividend paid 0 0 0 0 0 0 0 0New share capital 7,357 7,163 12,494 5,929 4,289 0 0 0Other 800 33 -353 739 -1,113 6,153 0 0Debt financing -8,499 5,796 29,528 46,549 2,472 6,590 -9,749 -2,764Cash flow from financing -342 12,992 41,669 53,217 5,648 12,743 -9,749 -2,764Change in cash 1,253 549 11,205 -9,298 -3,821 -2,932 2,998 2,805Cash, start of the year 7,194 7,743 18,948 9,650 5,829 2,897 5,895Cash, end of the year 7,194 7,743 18,948 9,650 5,829 2,897 5,895 8,700Free cash flow per share in € -0.99 -1.30 -2.35 -4.21 -0.57 -0.53 0.43 0.19Y-o-y growthOperating cash flow -0.30 -53% 64% n.a. n.a. -142% 48% 56%Net operating cash flow n.a. n.a. n.a. n.a. n.a. 24% -357% 4%Free cash flow n.a. n.a. n.a. n.a. n.a. n.a. n.a. -56%Source: <strong>HTI</strong>; First Berlin Equity Research estimates7
3 September 2010 <strong>HTI</strong> High Tech Industries <strong>AG</strong>FIRST BERLIN RATING & PRICE TARGET HISTORYReportNo.Date ofpublicationPrevious dayclosing priceRatingPricetargetInterimhigh% changeto highInitialReport30 September2009€0.60 Buy €1.25 - -2...2 ↓ ↓ ↓ ↓ ↓ ↓220 November€0.72 Buy €1.00 €1.00 38.9%20093 Today €0.87 Buy €1.20 - -DisclaimerSimon ScholesFirst BerlinEquity Research GmbHMohrenstrasse 3410117 BerlinTel. +49 (0)30 - 91 68 41 05Fax +49 (0)30 - 80 93 96 87info@firstberlin.comwww.firstberlin.comFIRST BERLIN POLICYIn an effort to assure the independence of First Berlin research neither analysts nor the company itself trade or own securities in subjectcompanies. In addition, analysts’ compensation is not directly linked to specific financial transactions, trading revenue or assetmanagement fees. Analysts are compensated on a broad range of benchmarks. Furthermore, First Berlin receives no compensation fromsubject companies in relation to the costs of producing this report.ANALYST CERTIFICATIONI, Simon Scholes, certify that the views expressed in this report accurately reflect my personal and professional views about the subjectcompany; and I certify that my compensation is not directly linked to any specific financial transaction including trading revenue or assetmanagement fees; neither is it directly or indirectly related to the specific recommendation or views contained in this research. Inaddition, I possess no shares in the subject company.INVESTMENT RATING SYSTEMFirst Berlin’s investment rating system is five tiered and includes an investment recommendation and a risk rating. Ourrecommendations, which are a function of our expectation of total return (forecast price appreciation and dividend yield) in the yearspecified, are as follows:STRONG BUY: Expected return greater than 50% and a high level of confidence in management’s financial guidanceBUY: Expected return greater than 25%ADD: Expected return between 0% and 25%REDUCE: Expected negative return between 0% and -15%SELL: Expected negative return greater than -15%Our risk ratings are Low, Medium, High and Speculative and are determined by ten factors: corporate governance, quality of earnings,management strength, balance sheet and financing risk, competitive position, standard of financial disclosure, regulatory and politicaluncertainty, company size, free float and other company specific risks. These risk factors are incorporated into our valuation models andare therefore reflected in our price targets. Our models are available upon request to First Berlin clients.Up until 16 May 2008, First Berlin’s investment rating system was three tiered and was a function of our expectation of return (forecastprice appreciation and dividend yield) over the specified year. Our investment ratings were as follows: BUY: expected return greaterthan 15%; HOLD: expected return between 0% and 15%; and SELL: expected negative return.ADDITIONAL DISCLOSURESThis report is not constructed as an offer to sell or the solicitation of an offer to buy any security in any jurisdiction where such an offerwould be illegal. We are not soliciting any action based upon this material. This material is for the general information of clients of FirstBerlin. It does not take into account the particular investment objectives, financial situation or needs of individual clients. Before acting onany advice or recommendation in this material, a client should consider whether it is suitable for their particular circumstances and, ifnecessary, seek professional advice. The material is based upon information that we consider reliable, but we do not represent that it isaccurate or complete, and it should be relied upon as such. Opinions expressed are our current opinions as of the date appearing on thismaterial only; such opinions are subject to change without notice.Copyright © 2009 First Berlin Equity Research GmbH. All rights reserved. No part of this material may be copied, photocopied orduplicated in any form by any means or redistributed without First Berlin’s prior written consent. The research is not for distribution inthe USA or Canada. When quoting please cite First Berlin as the source. Additional information is available upon request.8


