Employee Absence - CIPD
Employee Absence - CIPD
Employee Absence - CIPD
- No tags were found...

Create successful ePaper yourself
Turn your PDF publications into a flip-book with our unique Google optimized e-Paper software.
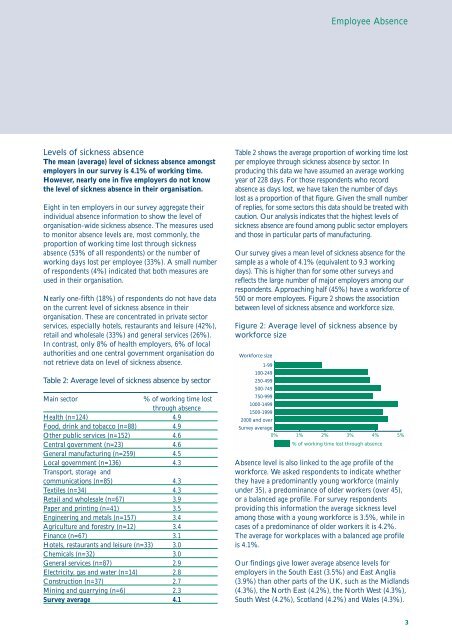
<strong>Employee</strong> <strong>Absence</strong>Levels of sickness absenceThe mean (average) level of sickness absence amongstemployers in our survey is 4.1% of working time.However, nearly one in five employers do not knowthe level of sickness absence in their organisation.Eight in ten employers in our survey aggregate theirindividual absence information to show the level oforganisation-wide sickness absence. The measures usedto monitor absence levels are, most commonly, theproportion of working time lost through sicknessabsence (53% of all respondents) or the number ofworking days lost per employee (33%). A small numberof respondents (4%) indicated that both measures areused in their organisation.Nearly one-fifth (18%) of respondents do not have dataon the current level of sickness absence in theirorganisation. These are concentrated in private sectorservices, especially hotels, restaurants and leisure (42%),retail and wholesale (33%) and general services (26%).In contrast, only 8% of health employers, 6% of localauthorities and one central government organisation donot retrieve data on level of sickness absence.Table 2: Average level of sickness absence by sectorMain sector% of working time lostthrough absenceHealth (n=124) 4.9Food, drink and tobacco (n=88) 4.9Other public services (n=152) 4.6Central government (n=23) 4.6General manufacturing (n=259) 4.5Local government (n=136) 4.3Transport, storage andcommunications (n=85) 4.3Textiles (n=34) 4.3Retail and wholesale (n=67) 3.9Paper and printing (n=41) 3.5Engineering and metals (n=157) 3.4Agriculture and forestry (n=12) 3.4Finance (n=67) 3.1Hotels, restaurants and leisure (n=33) 3.0Chemicals (n=32) 3.0General services (n=87) 2.9Electricity, gas and water (n=14) 2.8Construction (n=37) 2.7Mining and quarrying (n=6) 2.3Survey average 4.1Table 2 shows the average proportion of working time lostper employee through sickness absence by sector. Inproducing this data we have assumed an average workingyear of 228 days. For those respondents who recordabsence as days lost, we have taken the number of dayslost as a proportion of that figure. Given the small numberof replies, for some sectors this data should be treated withcaution. Our analysis indicates that the highest levels ofsickness absence are found among public sector employersand those in particular parts of manufacturing.Our survey gives a mean level of sickness absence for thesample as a whole of 4.1% (equivalent to 9.3 workingdays). This is higher than for some other surveys andreflects the large number of major employers among ourrespondents. Approaching half (45%) have a workforce of500 or more employees. Figure 2 shows the associationbetween level of sickness absence and workforce size.Figure 2: Average level of sickness absence byworkforce sizeWorkforce size1-99100-249250-499500-749750-9991000-14991500-19992000 and overSurvey average0% 1% 2% 3% 4% 5%% of working time lost through absence<strong>Absence</strong> level is also linked to the age profile of theworkforce. We asked respondents to indicate whetherthey have a predominantly young workforce (mainlyunder 35), a predominance of older workers (over 45),or a balanced age profile. For survey respondentsproviding this information the average sickness levelamong those with a young workforce is 3.5%, while incases of a predominance of older workers it is 4.2%.The average for workplaces with a balanced age profileis 4.1%.Our findings give lower average absence levels foremployers in the South East (3.5%) and East Anglia(3.9%) than other parts of the UK, such as the Midlands(4.3%), the North East (4.2%), the North West (4.3%),South West (4.2%), Scotland (4.2%) and Wales (4.3%).3