A-Franco-German-Tale
A-Franco-German-Tale
A-Franco-German-Tale
- No tags were found...

Create successful ePaper yourself
Turn your PDF publications into a flip-book with our unique Google optimized e-Paper software.
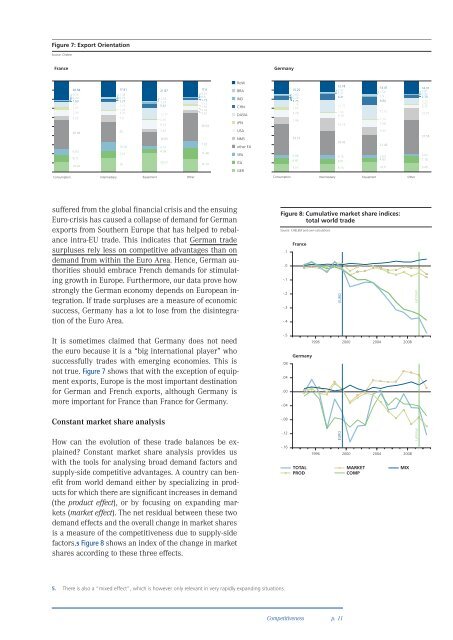
Figure 7: Export OrientationSource: ChelemFrance<strong>German</strong>y20.580.590.291.695.52.657.334.5530.986.838.1110.9417.911.420.742.778.221.484.317.92210.047.211621.871.231.575.4112.370.869.133.6214.834.154.3920.5717.60.630.51.735.141.854.293.6230.547.8311.4814.79RoWBRAINDCHNDASIAJPNUSANMSother EUSPAITAGER15.250.660.294.757.742.628.787.0634.193.686.878.1512.181.371.216.4112.751.086.1414.1426.424.156.018.1414.471.561.58.8415.161.347.589.9321.462.634.6310.914.310.810.922.796.320.923.7512.9137.583.027.189.49ConsumptionIntermediaryEquipmentOtherConsumptionIntermediaryEquipmentOthersuffered from the global financial crisis and the ensuingEuro-crisis has caused a collapse of demand for <strong>German</strong>exports from Southern Europe that has helped to rebalanceintra-EU trade. This indicates that <strong>German</strong> tradesurpluses rely less on competitive advantages than ondemand from within the Euro Area. Hence, <strong>German</strong> authoritiesshould embrace French demands for stimulatinggrowth in Europe. Furthermore, our data prove howstrongly the <strong>German</strong> economy depends on European integration.If trade surpluses are a measure of economicsuccess, <strong>German</strong>y has a lot to lose from the disintegrationof the Euro Area.Figure 8: Cumulative market share indices:total world tradeSource: CHELEM and own calculations.1.0-.1-.2-.3-.4FranceEUROLehmanIt is sometimes claimed that <strong>German</strong>y does not needthe euro because it is a “big international player” whosuccessfully trades with emerging economies. This isnot true. Figure 7 shows that with the exception of equipmentexports, Europe is the most important destinationfor <strong>German</strong> and French exports, although <strong>German</strong>y ismore important for France than France for <strong>German</strong>y.Constant market share analysis-.5.08.04.00-.04-.08<strong>German</strong>y1996 2000 2004 2008How can the evolution of these trade balances be explained?Constant market share analysis provides uswith the tools for analysing broad demand factors andsupply-side competitive advantages. A country can benefitfrom world demand either by specializing in productsfor which there are significant increases in demand(the product effect), or by focusing on expanding markets(market effect). The net residual between these twodemand effects and the overall change in market sharesis a measure of the competitiveness due to supply-sidefactors.5 Figure 8 shows an index of the change in marketshares according to these three effects.-.12-.16TOTALPRODEURO1996 2000 2004 2008MARKETCOMPMIXLehman5. There is also a “mixed effect”, which is however only relevant in very rapidly expanding situations.Competitivenessp. 11