Health risk assessment of heavy metals via dietary intake of ...
Health risk assessment of heavy metals via dietary intake of ...
Health risk assessment of heavy metals via dietary intake of ...

Create successful ePaper yourself
Turn your PDF publications into a flip-book with our unique Google optimized e-Paper software.
612 A. Singh et al. / Food and Chemical Toxicology 48 (2010) 611–619<br />
2. Materials and methods<br />
2.1. Study sites<br />
The study was conducted around Dinapur sewage treatment plant (DSTP) situated<br />
at a suburban area in the north east <strong>of</strong> Varanasi (25°18’ N latitude 83°01’ E longitude<br />
and 76.19 m above the sea level) city in eastern Gangetic plains <strong>of</strong> India<br />
during March 2006 to February 2007. Large-scale vegetable production is conducted<br />
in this area, largely to supply markets in the city. Dinapur sewage treatment<br />
plant <strong>of</strong> 80 million liters per day (MLD) capacity was installed in 1986. Effluents<br />
from various small scale industries situated in the city are also discharged along<br />
with sewage for treatment at DSTP. These industries include fabric painting, batteries,<br />
dye, plastic recycling and metal surface treatment. A large area around DSTP has<br />
no access to clean water resources, so farmers use treated and untreated wastewater<br />
for irrigation. Two major sites were demarcated in Dinapur having different irrigation<br />
practices. At the wastewater irrigated (WWI) site, treated wastewater from<br />
DSTP has been used for irrigating the fields for about 20 years. Some times due to<br />
power failure, the sewage treatment plant does not work and untreated wastewater<br />
is used for irrigation. Clean water from bore wells has been used for irrigating the<br />
agricultural fields at the clean water irrigated site (CWI) for a similar period <strong>of</strong> time.<br />
2.2. Soil and water sampling<br />
Soil and water samples were collected at fortnightly interval from March 2006<br />
to February 2007. Soil samples were collected in triplicate by digging out a monolith<br />
<strong>of</strong> 10 10 15 cm 3 size, from 10 sub sites <strong>of</strong> both clean (CWI) and wastewater<br />
irrigated sites (WWI). Soil samples were air dried, crushed and passed through<br />
2 mm mesh size sieve and stored at ambient temperature before analysis. Both<br />
clean and wastewater samples (100 ml) used for irrigation were collected in triplicate<br />
in a pre acid washed polypropylene bottle and 1 ml <strong>of</strong> concentrated HNO3 was<br />
added in the water sample to avoid the microbial activity. These samples were<br />
brought back to the laboratory and kept in a refrigerator before digestion.<br />
2.3. Plant sampling<br />
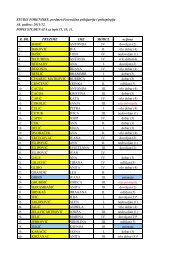
All the major vegetables and cereal crops grown in the experimental area, either<br />
for home consumption or sale, were collected. The details <strong>of</strong> different plants sampled<br />
during the experiment are given in Table 1.Anarea<strong>of</strong>5 5m 2 was randomly marked<br />
at 10 subsites in triplicate and the edible portion <strong>of</strong> test vegetables were collected<br />
from both CWI and WWI sites. Samples were brought back to the laboratory and<br />
washed with clean tap water to remove the soil particles adhered to the surface <strong>of</strong><br />
the vegetables. After removing the extra water from the surface <strong>of</strong> vegetables with<br />
blotting paper, samples were cut into pieces, packed into separate bags, and kept in<br />
an oven until a constant weight was achieved. For cereal crops, plots <strong>of</strong> 5 5m 2 sizes<br />
were marked in triplicate at 10 subsites at both CWI and WWI sites, and ears were<br />
harvested upon maturity. Grains were separated and kept in an oven for drying, until<br />
constant weight was achieved. The dried samples were grinded and passed through a<br />
sieve <strong>of</strong> 2 mm size and then kept at room temperature for further analysis.<br />
2.4. Milk sampling<br />
Fresh milk (250 ml) was collected from 10 different buffalos in pre acid washed<br />
polypropylene bottles, at both CWI and WWI sites, and stored at 4 °C prior to digestion<br />
for <strong>heavy</strong> metal analysis.<br />
2.5. Digestion <strong>of</strong> samples<br />
2.5.1. Soil and plant<br />
Soil and plant samples (1 g) were digested after adding 15 ml <strong>of</strong> tri-acid mixture<br />
(HNO 3,H 2SO 4, and HClO 4 in 5:1:1 ratio) at 80 °C until a transparent solution was<br />
obtained (Allen et al., 1986). After cooling, the digested sample was filtered using<br />
Whatman No. 42 filter paper and the filtrate was finally maintained to 50 ml with<br />
distilled water.<br />
2.5.2. Irrigation water<br />
The irrigation water sample (50 ml) was digested with 10 ml <strong>of</strong> concentrated<br />
HNO 3 at 80 °C until the solution became transparent (APHA, 2005). The solution<br />
was filtered through Whatman No. 42 filter paper and the total volume was maintained<br />
to 50 ml with distilled water.<br />
2.5.3. Milk<br />
For digestion <strong>of</strong> milk, the method given by Crounse (1983) was followed. Milk<br />
sample (50 ml) was taken in a beaker and heated on hot plate to reduce the water<br />
content (without boiling). When the mass became syrupy, it was cooled and 10 ml<br />
<strong>of</strong> HNO3 (70% V/V) was added. The mixture was warmed until the evolution <strong>of</strong><br />
brown fumes <strong>of</strong> NO 2 ceased and a colourless solution was obtained. About 2.5 ml<br />
<strong>of</strong> HClO 4 was added and again heated for complete digestion. The extract after filtration<br />
was diluted with distilled water to 25 ml.<br />
2.6. Analysis <strong>of</strong> <strong>heavy</strong> <strong>metals</strong><br />
Concentrations <strong>of</strong> Cd, Cu, Pb, Zn, Ni and Cr in the filtrate <strong>of</strong> digested soil, water,<br />
plant and milk samples were estimated by using an atomic absorption spectrophotometer<br />
(Model 2380, Perkin Elmer, Inc., Norwalk, CT, USA). The instrument was fitted<br />
with specific lamp <strong>of</strong> particular metal. The instrument was calibrated using<br />
manually prepared standard solution <strong>of</strong> respective <strong>heavy</strong> <strong>metals</strong> as well as drift<br />
blanks. Standard stock solution <strong>of</strong> 1000 ppm for all the <strong>metals</strong> were obtained from<br />
Sisco Research Laboratories Pvt. Ltd., India. These solution were diluted for desired<br />
concentrations to calibrate the instrument. Acetylene gas was used as the fuel and<br />
air as the support. An oxidising flame was used in all cases.<br />
2.7. Quality control analysis<br />
Precision and accuracy <strong>of</strong> analysis was assured through repeated analysis <strong>of</strong><br />
samples against National Institute <strong>of</strong> standard and technology, Standard Reference<br />
Material (SRM 1570) for all the <strong>heavy</strong> <strong>metals</strong>. The results were found within ±2% <strong>of</strong><br />
the certified value. Quality control measures were taken to asses contamination and<br />
reliability <strong>of</strong> data. Blank and drift standards (Sisco Research Laboratories Pvt. Ltd.,<br />
India) were run after five determination to calibrate the instrument. The coefficients<br />
<strong>of</strong> variation <strong>of</strong> replicate analysis were determined for different determinations<br />
for precision <strong>of</strong> analysis and variations below 10% were considered correct.<br />
2.8. Data analyses<br />
Concentration <strong>of</strong> metal in edible part at WWI site=concentration <strong>of</strong> metal in soil at WWI<br />
EF ¼<br />
Concentration <strong>of</strong> metal in edible part at CWI site=concentration <strong>of</strong> metal in soil at CWI site :<br />
2.8.1. Enrichment factor (EF)<br />
To examine the translocation <strong>of</strong> <strong>heavy</strong> <strong>metals</strong> from the soil to the edible portion<br />
<strong>of</strong> test plants, and to show the difference in metal concentrations in the plants between<br />
the sites, the enrichment factor (EF) was calculated by using the formula given<br />
by Buat-Menard and Chesselet (1979):<br />
2.8.2. Metal pollution index (MPI)<br />
To examine the overall <strong>heavy</strong> metal concentrations in all crops analysed in the<br />
wastewater irrigated site, metal pollution index (MPI) was computed. This index<br />
was obtained by calculating the geometrical mean <strong>of</strong> concentrations <strong>of</strong> all the <strong>metals</strong><br />
in the vegetables, cereals and milk (Usero et al., 1997).<br />
MPIðlgg 1 Þ¼ðCf1 Cf2 CfnÞ 1=n<br />
where Cf n = concentration <strong>of</strong> metal n in the sample.<br />
2.8.3. <strong>Health</strong> <strong>risk</strong> index (HRI)<br />
The health <strong>risk</strong> index was calculated as the ratio <strong>of</strong> estimated exposure <strong>of</strong> test<br />
crops and oral reference dose (Cui et al., 2004). Oral reference doses were<br />
4 10 2 , 0.3 and 1 10 3 mg kg 1 day 1 for Cu, Zn and Cd, respectively (USEPA,<br />
2002) and 0.004, 0.02 and 1.5 mg kg 1 day 1 for Pb, Ni and Cr, respectively (USEPA,<br />
1997). Estimated exposure is obtained by dividing daily <strong>intake</strong> <strong>of</strong> <strong>heavy</strong> <strong>metals</strong> by<br />
their safe limits. An index more than 1 is considered as not safe for human health<br />
(USEPA, 2002).<br />
Daily <strong>intake</strong> was calculated by the following equation:<br />
Daily <strong>intake</strong> <strong>of</strong> metal ðDIMÞ ¼ Cmetal Dfood <strong>intake</strong><br />
B average weight<br />
where Cmetal, Dfood <strong>intake</strong> and Baverage weight represent the <strong>heavy</strong> metal concentrations<br />
in plants (lgg 1 ), daily <strong>intake</strong> <strong>of</strong> vegetables and average body weight, respectively.<br />
The average daily vegetable <strong>intake</strong> rate was calculated by conducting a survey where<br />
100 people having average body weight <strong>of</strong> 60 kg were asked for their daily <strong>intake</strong> <strong>of</strong><br />
particular vegetable from the experimental area in each month <strong>of</strong> sampling (Ge,<br />
1992; Wang et al., 2005).