Health risk assessment of heavy metals via dietary intake of ...
Health risk assessment of heavy metals via dietary intake of ...
Health risk assessment of heavy metals via dietary intake of ...

You also want an ePaper? Increase the reach of your titles
YUMPU automatically turns print PDFs into web optimized ePapers that Google loves.
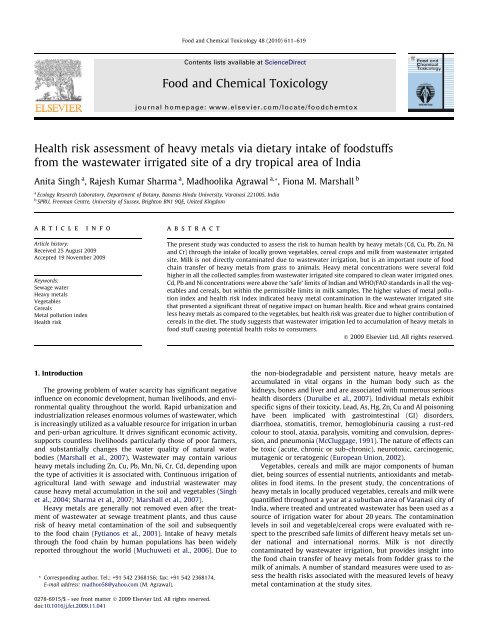
<strong>Health</strong> <strong>risk</strong> <strong>assessment</strong> <strong>of</strong> <strong>heavy</strong> <strong>metals</strong> <strong>via</strong> <strong>dietary</strong> <strong>intake</strong> <strong>of</strong> foodstuffs<br />
from the wastewater irrigated site <strong>of</strong> a dry tropical area <strong>of</strong> India<br />
Anita Singh a , Rajesh Kumar Sharma a , Madhoolika Agrawal a, *, Fiona M. Marshall b<br />
a Ecology Research Laboratory, Department <strong>of</strong> Botany, Banaras Hindu University, Varanasi 221005, India<br />
b SPRU, Freeman Centre, University <strong>of</strong> Sussex, Brighton BN1 9QE, United Kingdom<br />
article info<br />
Article history:<br />
Received 25 August 2009<br />
Accepted 19 November 2009<br />
Keywords:<br />
Sewage water<br />
Heavy <strong>metals</strong><br />
Vegetables<br />
Cereals<br />
Metal pollution index<br />
<strong>Health</strong> <strong>risk</strong><br />
1. Introduction<br />
abstract<br />
The growing problem <strong>of</strong> water scarcity has significant negative<br />
influence on economic development, human livelihoods, and environmental<br />
quality throughout the world. Rapid urbanization and<br />
industrialization releases enormous volumes <strong>of</strong> wastewater, which<br />
is increasingly utilized as a valuable resource for irrigation in urban<br />
and peri-urban agriculture. It drives significant economic activity,<br />
supports countless livelihoods particularly those <strong>of</strong> poor farmers,<br />
and substantially changes the water quality <strong>of</strong> natural water<br />
bodies (Marshall et al., 2007). Wastewater may contain various<br />
<strong>heavy</strong> <strong>metals</strong> including Zn, Cu, Pb, Mn, Ni, Cr, Cd, depending upon<br />
the type <strong>of</strong> activities it is associated with. Continuous irrigation <strong>of</strong><br />
agricultural land with sewage and industrial wastewater may<br />
cause <strong>heavy</strong> metal accumulation in the soil and vegetables (Singh<br />
et al., 2004; Sharma et al., 2007; Marshall et al., 2007).<br />
Heavy <strong>metals</strong> are generally not removed even after the treatment<br />
<strong>of</strong> wastewater at sewage treatment plants, and thus cause<br />
<strong>risk</strong> <strong>of</strong> <strong>heavy</strong> metal contamination <strong>of</strong> the soil and subsequently<br />
to the food chain (Fytianos et al., 2001). Intake <strong>of</strong> <strong>heavy</strong> <strong>metals</strong><br />
through the food chain by human populations has been widely<br />
reported throughout the world (Muchuweti et al., 2006). Due to<br />
* Corresponding author. Tel.: +91 542 2368156; fax: +91 542 2368174.<br />
E-mail address: madhoo58@yahoo.com (M. Agrawal).<br />
0278-6915/$ - see front matter Ó 2009 Elsevier Ltd. All rights reserved.<br />
doi:10.1016/j.fct.2009.11.041<br />
Food and Chemical Toxicology 48 (2010) 611–619<br />
Contents lists available at ScienceDirect<br />
Food and Chemical Toxicology<br />
journal homepage: www.elsevier.com/locate/foodchemtox<br />
The present study was conducted to assess the <strong>risk</strong> to human health by <strong>heavy</strong> <strong>metals</strong> (Cd, Cu, Pb, Zn, Ni<br />
and Cr) through the <strong>intake</strong> <strong>of</strong> locally grown vegetables, cereal crops and milk from wastewater irrigated<br />
site. Milk is not directly contaminated due to wastewater irrigation, but is an important route <strong>of</strong> food<br />
chain transfer <strong>of</strong> <strong>heavy</strong> <strong>metals</strong> from grass to animals. Heavy metal concentrations were several fold<br />
higher in all the collected samples from wastewater irrigated site compared to clean water irrigated ones.<br />
Cd, Pb and Ni concentrations were above the ‘safe’ limits <strong>of</strong> Indian and WHO/FAO standards in all the vegetables<br />
and cereals, but within the permissible limits in milk samples. The higher values <strong>of</strong> metal pollution<br />
index and health <strong>risk</strong> index indicated <strong>heavy</strong> metal contamination in the wastewater irrigated site<br />
that presented a significant threat <strong>of</strong> negative impact on human health. Rice and wheat grains contained<br />
less <strong>heavy</strong> <strong>metals</strong> as compared to the vegetables, but health <strong>risk</strong> was greater due to higher contribution <strong>of</strong><br />
cereals in the diet. The study suggests that wastewater irrigation led to accumulation <strong>of</strong> <strong>heavy</strong> <strong>metals</strong> in<br />
food stuff causing potential health <strong>risk</strong>s to consumers.<br />
Ó 2009 Elsevier Ltd. All rights reserved.<br />
the non-biodegradable and persistent nature, <strong>heavy</strong> <strong>metals</strong> are<br />
accumulated in vital organs in the human body such as the<br />
kidneys, bones and liver and are associated with numerous serious<br />
health disorders (Duruibe et al., 2007). Individual <strong>metals</strong> exhibit<br />
specific signs <strong>of</strong> their toxicity. Lead, As, Hg, Zn, Cu and Al poisoning<br />
have been implicated with gastrointestinal (GI) disorders,<br />
diarrhoea, stomatitis, tremor, hemoglobinuria causing a rust-red<br />
colour to stool, ataxia, paralysis, vomiting and convulsion, depression,<br />
and pneumonia (McCluggage, 1991). The nature <strong>of</strong> effects can<br />
be toxic (acute, chronic or sub-chronic), neurotoxic, carcinogenic,<br />
mutagenic or teratogenic (European Union, 2002).<br />
Vegetables, cereals and milk are major components <strong>of</strong> human<br />
diet, being sources <strong>of</strong> essential nutrients, antioxidants and metabolites<br />
in food items. In the present study, the concentrations <strong>of</strong><br />
<strong>heavy</strong> <strong>metals</strong> in locally produced vegetables, cereals and milk were<br />
quantified throughout a year at a suburban area <strong>of</strong> Varanasi city <strong>of</strong><br />
India, where treated and untreated wastewater has been used as a<br />
source <strong>of</strong> irrigation water for about 20 years. The contamination<br />
levels in soil and vegetable/cereal crops were evaluated with respect<br />
to the prescribed safe limits <strong>of</strong> different <strong>heavy</strong> <strong>metals</strong> set under<br />
national and international norms. Milk is not directly<br />
contaminated by wastewater irrigation, but provides insight into<br />
the food chain transfer <strong>of</strong> <strong>heavy</strong> <strong>metals</strong> from fodder grass to the<br />
milk <strong>of</strong> animals. A number <strong>of</strong> standard measures were used to assess<br />
the health <strong>risk</strong>s associated with the measured levels <strong>of</strong> <strong>heavy</strong><br />
metal contamination at the study sites.
612 A. Singh et al. / Food and Chemical Toxicology 48 (2010) 611–619<br />
2. Materials and methods<br />
2.1. Study sites<br />
The study was conducted around Dinapur sewage treatment plant (DSTP) situated<br />
at a suburban area in the north east <strong>of</strong> Varanasi (25°18’ N latitude 83°01’ E longitude<br />
and 76.19 m above the sea level) city in eastern Gangetic plains <strong>of</strong> India<br />
during March 2006 to February 2007. Large-scale vegetable production is conducted<br />
in this area, largely to supply markets in the city. Dinapur sewage treatment<br />
plant <strong>of</strong> 80 million liters per day (MLD) capacity was installed in 1986. Effluents<br />
from various small scale industries situated in the city are also discharged along<br />
with sewage for treatment at DSTP. These industries include fabric painting, batteries,<br />
dye, plastic recycling and metal surface treatment. A large area around DSTP has<br />
no access to clean water resources, so farmers use treated and untreated wastewater<br />
for irrigation. Two major sites were demarcated in Dinapur having different irrigation<br />
practices. At the wastewater irrigated (WWI) site, treated wastewater from<br />
DSTP has been used for irrigating the fields for about 20 years. Some times due to<br />
power failure, the sewage treatment plant does not work and untreated wastewater<br />
is used for irrigation. Clean water from bore wells has been used for irrigating the<br />
agricultural fields at the clean water irrigated site (CWI) for a similar period <strong>of</strong> time.<br />
2.2. Soil and water sampling<br />
Soil and water samples were collected at fortnightly interval from March 2006<br />
to February 2007. Soil samples were collected in triplicate by digging out a monolith<br />
<strong>of</strong> 10 10 15 cm 3 size, from 10 sub sites <strong>of</strong> both clean (CWI) and wastewater<br />
irrigated sites (WWI). Soil samples were air dried, crushed and passed through<br />
2 mm mesh size sieve and stored at ambient temperature before analysis. Both<br />
clean and wastewater samples (100 ml) used for irrigation were collected in triplicate<br />
in a pre acid washed polypropylene bottle and 1 ml <strong>of</strong> concentrated HNO3 was<br />
added in the water sample to avoid the microbial activity. These samples were<br />
brought back to the laboratory and kept in a refrigerator before digestion.<br />
2.3. Plant sampling<br />
All the major vegetables and cereal crops grown in the experimental area, either<br />
for home consumption or sale, were collected. The details <strong>of</strong> different plants sampled<br />
during the experiment are given in Table 1.Anarea<strong>of</strong>5 5m 2 was randomly marked<br />
at 10 subsites in triplicate and the edible portion <strong>of</strong> test vegetables were collected<br />
from both CWI and WWI sites. Samples were brought back to the laboratory and<br />
washed with clean tap water to remove the soil particles adhered to the surface <strong>of</strong><br />
the vegetables. After removing the extra water from the surface <strong>of</strong> vegetables with<br />
blotting paper, samples were cut into pieces, packed into separate bags, and kept in<br />
an oven until a constant weight was achieved. For cereal crops, plots <strong>of</strong> 5 5m 2 sizes<br />
were marked in triplicate at 10 subsites at both CWI and WWI sites, and ears were<br />
harvested upon maturity. Grains were separated and kept in an oven for drying, until<br />
constant weight was achieved. The dried samples were grinded and passed through a<br />
sieve <strong>of</strong> 2 mm size and then kept at room temperature for further analysis.<br />
2.4. Milk sampling<br />
Fresh milk (250 ml) was collected from 10 different buffalos in pre acid washed<br />
polypropylene bottles, at both CWI and WWI sites, and stored at 4 °C prior to digestion<br />
for <strong>heavy</strong> metal analysis.<br />
2.5. Digestion <strong>of</strong> samples<br />
2.5.1. Soil and plant<br />
Soil and plant samples (1 g) were digested after adding 15 ml <strong>of</strong> tri-acid mixture<br />
(HNO 3,H 2SO 4, and HClO 4 in 5:1:1 ratio) at 80 °C until a transparent solution was<br />
obtained (Allen et al., 1986). After cooling, the digested sample was filtered using<br />
Whatman No. 42 filter paper and the filtrate was finally maintained to 50 ml with<br />
distilled water.<br />
2.5.2. Irrigation water<br />
The irrigation water sample (50 ml) was digested with 10 ml <strong>of</strong> concentrated<br />
HNO 3 at 80 °C until the solution became transparent (APHA, 2005). The solution<br />
was filtered through Whatman No. 42 filter paper and the total volume was maintained<br />
to 50 ml with distilled water.<br />
2.5.3. Milk<br />
For digestion <strong>of</strong> milk, the method given by Crounse (1983) was followed. Milk<br />
sample (50 ml) was taken in a beaker and heated on hot plate to reduce the water<br />
content (without boiling). When the mass became syrupy, it was cooled and 10 ml<br />
<strong>of</strong> HNO3 (70% V/V) was added. The mixture was warmed until the evolution <strong>of</strong><br />
brown fumes <strong>of</strong> NO 2 ceased and a colourless solution was obtained. About 2.5 ml<br />
<strong>of</strong> HClO 4 was added and again heated for complete digestion. The extract after filtration<br />
was diluted with distilled water to 25 ml.<br />
2.6. Analysis <strong>of</strong> <strong>heavy</strong> <strong>metals</strong><br />
Concentrations <strong>of</strong> Cd, Cu, Pb, Zn, Ni and Cr in the filtrate <strong>of</strong> digested soil, water,<br />
plant and milk samples were estimated by using an atomic absorption spectrophotometer<br />
(Model 2380, Perkin Elmer, Inc., Norwalk, CT, USA). The instrument was fitted<br />
with specific lamp <strong>of</strong> particular metal. The instrument was calibrated using<br />
manually prepared standard solution <strong>of</strong> respective <strong>heavy</strong> <strong>metals</strong> as well as drift<br />
blanks. Standard stock solution <strong>of</strong> 1000 ppm for all the <strong>metals</strong> were obtained from<br />
Sisco Research Laboratories Pvt. Ltd., India. These solution were diluted for desired<br />
concentrations to calibrate the instrument. Acetylene gas was used as the fuel and<br />
air as the support. An oxidising flame was used in all cases.<br />
2.7. Quality control analysis<br />
Precision and accuracy <strong>of</strong> analysis was assured through repeated analysis <strong>of</strong><br />
samples against National Institute <strong>of</strong> standard and technology, Standard Reference<br />
Material (SRM 1570) for all the <strong>heavy</strong> <strong>metals</strong>. The results were found within ±2% <strong>of</strong><br />
the certified value. Quality control measures were taken to asses contamination and<br />
reliability <strong>of</strong> data. Blank and drift standards (Sisco Research Laboratories Pvt. Ltd.,<br />
India) were run after five determination to calibrate the instrument. The coefficients<br />
<strong>of</strong> variation <strong>of</strong> replicate analysis were determined for different determinations<br />
for precision <strong>of</strong> analysis and variations below 10% were considered correct.<br />
2.8. Data analyses<br />
Concentration <strong>of</strong> metal in edible part at WWI site=concentration <strong>of</strong> metal in soil at WWI<br />
EF ¼<br />
Concentration <strong>of</strong> metal in edible part at CWI site=concentration <strong>of</strong> metal in soil at CWI site :<br />
2.8.1. Enrichment factor (EF)<br />
To examine the translocation <strong>of</strong> <strong>heavy</strong> <strong>metals</strong> from the soil to the edible portion<br />
<strong>of</strong> test plants, and to show the difference in metal concentrations in the plants between<br />
the sites, the enrichment factor (EF) was calculated by using the formula given<br />
by Buat-Menard and Chesselet (1979):<br />
2.8.2. Metal pollution index (MPI)<br />
To examine the overall <strong>heavy</strong> metal concentrations in all crops analysed in the<br />
wastewater irrigated site, metal pollution index (MPI) was computed. This index<br />
was obtained by calculating the geometrical mean <strong>of</strong> concentrations <strong>of</strong> all the <strong>metals</strong><br />
in the vegetables, cereals and milk (Usero et al., 1997).<br />
MPIðlgg 1 Þ¼ðCf1 Cf2 CfnÞ 1=n<br />
where Cf n = concentration <strong>of</strong> metal n in the sample.<br />
2.8.3. <strong>Health</strong> <strong>risk</strong> index (HRI)<br />
The health <strong>risk</strong> index was calculated as the ratio <strong>of</strong> estimated exposure <strong>of</strong> test<br />
crops and oral reference dose (Cui et al., 2004). Oral reference doses were<br />
4 10 2 , 0.3 and 1 10 3 mg kg 1 day 1 for Cu, Zn and Cd, respectively (USEPA,<br />
2002) and 0.004, 0.02 and 1.5 mg kg 1 day 1 for Pb, Ni and Cr, respectively (USEPA,<br />
1997). Estimated exposure is obtained by dividing daily <strong>intake</strong> <strong>of</strong> <strong>heavy</strong> <strong>metals</strong> by<br />
their safe limits. An index more than 1 is considered as not safe for human health<br />
(USEPA, 2002).<br />
Daily <strong>intake</strong> was calculated by the following equation:<br />
Daily <strong>intake</strong> <strong>of</strong> metal ðDIMÞ ¼ Cmetal Dfood <strong>intake</strong><br />
B average weight<br />
where Cmetal, Dfood <strong>intake</strong> and Baverage weight represent the <strong>heavy</strong> metal concentrations<br />
in plants (lgg 1 ), daily <strong>intake</strong> <strong>of</strong> vegetables and average body weight, respectively.<br />
The average daily vegetable <strong>intake</strong> rate was calculated by conducting a survey where<br />
100 people having average body weight <strong>of</strong> 60 kg were asked for their daily <strong>intake</strong> <strong>of</strong><br />
particular vegetable from the experimental area in each month <strong>of</strong> sampling (Ge,<br />
1992; Wang et al., 2005).
Table 1<br />
Plant samples collected from the experimental sites.<br />
2.9. Statistical analysis<br />
The significance <strong>of</strong> differences between the concentrations <strong>of</strong> <strong>heavy</strong> <strong>metals</strong> in<br />
soil at wastewater (WWI) and clean water irrigated (CWI) sites were shown by<br />
using Student’s t-test. The data <strong>of</strong> <strong>heavy</strong> metal concentrations in the plants at different<br />
sites were subjected to two way analysis <strong>of</strong> variance (ANOVA) test for assessing<br />
the significance <strong>of</strong> differences in <strong>heavy</strong> metal concentrations due to different<br />
irrigation practices. All the statistical tests were performed using SPSS s<strong>of</strong>tware<br />
(SPSS Ins., version 11).<br />
3. Results and discussion<br />
3.1. Levels <strong>of</strong> <strong>heavy</strong> <strong>metals</strong> in water samples<br />
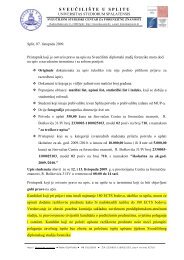
The concentrations (lgml 1 ) <strong>of</strong> <strong>heavy</strong> <strong>metals</strong> in the irrigation<br />
water at WWI site ranged between 0.00–0.02 for Cd, 0.02–0.07<br />
for Cu, 0.07–0.13 for Pb, 0.05–0.18 for Zn, 0.02–0.08 for Ni and<br />
0.03–0.08 for Cr during March 2006 to February 2007, whereas<br />
at CWI site, <strong>heavy</strong> metal concentrations in irrigation water were<br />
very low or below the detectable limits (Fig. 1). Among all the <strong>heavy</strong><br />
<strong>metals</strong>, Cd concentration exceeded the permissible limit set by<br />
FAO (1985). Heavy <strong>metals</strong> in the sewage water are associated with<br />
small scale industries such as colouring, electroplating, metal surface<br />
treatments, fabric printing, battery and paints, releasing Cd,<br />
Cu, Pb, Zn, Ni and other <strong>heavy</strong> <strong>metals</strong> into water channels, which<br />
are accessed for irrigation. As compared to the present concentration<br />
<strong>of</strong> <strong>heavy</strong> <strong>metals</strong> in the wastewater, Singh et al. (2004) have<br />
reported lower ranges <strong>of</strong> Cd (0.00–0.006 lgml 1 ), Cr (0.00–<br />
0.049 lgml 1 ) and Pb (0.012–0.088 lgml 1 ), but higher ranges<br />
<strong>of</strong> Cu (0.00–0.203 lgml 1 ), Ni (0.01–0.22 lgml 1 ) and Zn<br />
(0.023–0.18 lgml 1 ) were reported in the water samples <strong>of</strong> Dinapur<br />
area <strong>of</strong> Varanasi receiving treated and untreated sewage water<br />
for irrigating the agricultural fields. Sharma et al. (2007) reported<br />
similar ranges <strong>of</strong> Cd, Ni and Zn in irrigation water <strong>of</strong> DSTP, but<br />
Cu, Pb and Cr were tw<strong>of</strong>old higher during the present study. The<br />
comparison <strong>of</strong> the concentrations <strong>of</strong> <strong>heavy</strong> <strong>metals</strong> in treated<br />
wastewater <strong>of</strong> Dinapur STP from STP <strong>of</strong> Titagarh, West Bengal, India<br />
showed that Cd (0.01 lgml 1 ) and Cr (0.04 lgml 1 ) were similar,<br />
but Zn (1.17 lgml 1 ), Ni (0.39 lgml 1 ), Pb (3.54 lgml 1 ) and<br />
Cu (0.98 lgml 1 ) were lower during the present study (Gupta<br />
et al., 2008). Among the <strong>heavy</strong> <strong>metals</strong>, the mean concentration<br />
was maximum for Zn (0.151 mg l 1 ) and minimum for Cd<br />
(0.02 mg l 1 ) in the irrigation water from DSTP (Fig. 1). The lower<br />
concentrations <strong>of</strong> <strong>heavy</strong> <strong>metals</strong> in the irrigation water may be<br />
due to dilution <strong>of</strong> <strong>heavy</strong> <strong>metals</strong> in the water medium, but the continuous<br />
application <strong>of</strong> these treated and untreated wastewater for<br />
irrigation resulted into accumulation <strong>of</strong> <strong>heavy</strong> <strong>metals</strong> into the soil.<br />
A. Singh et al. / Food and Chemical Toxicology 48 (2010) 611–619 613<br />
Edible part <strong>of</strong> vegetable/cereal crops Common name Botanical name Family<br />
Leaf Palak Beta vulgaris L. Chenopodiaceae<br />
Leaf Amaranthus Amaranthus caudatus L. Amaranthaceae<br />
Leaf Cabbage Brasssica oleracea L. var capitata L. Brassicaceae<br />
Inflorescence Cauliflower Brassica oleracea L. var. Botrytis L. Brassicaceae<br />
Fruit Lady’s finger Abelmoschus esculentus L. Malvaceae<br />
Fruit Brinjal Solanum melongena L. Solanaceae<br />
Fruit Tomato Lycopersicon esculentum L. Solanaceae<br />
Fruit Bottle gourd Lagenaria siceraria Mol. Cucurbitaceae<br />
Fruit Sponge gourd Luffa cylindrica L. Cucurbitaceae<br />
Fruit Bitter gourd Momordica charantia L. Cucurbitaceae<br />
Fruit Pumpkin Cucurbita maxima Duch. Cucurbitaceae<br />
Fruit Pointed gourd Tricosanthes dioica Roxb. Cucurbitaceae<br />
Root Radish Raphanus sativus L. Brassicaceae<br />
Grain Wheat Triticum aestivum L. Poaceae<br />
Grain Rice Oryza sativa L. Poaceae<br />
3.2. Levels <strong>of</strong> <strong>heavy</strong> <strong>metals</strong> in the soil<br />
Elevated levels <strong>of</strong> <strong>heavy</strong> <strong>metals</strong> in irrigation water led to significantly<br />
higher concentrations <strong>of</strong> <strong>heavy</strong> <strong>metals</strong> in the soil at WWI<br />
site as compared to those obtained from clean water irrigated site<br />
(Table 2). The <strong>heavy</strong> metal concentrations were, however, below<br />
the safe limits <strong>of</strong> Indian (Awashthi, 2000) and EU standard (European<br />
Union, 2002) at WWI site (Table 2). The lower concentrations<br />
<strong>of</strong> <strong>heavy</strong> <strong>metals</strong> than the safe limits at WWI site may be due to the<br />
continuous removal <strong>of</strong> <strong>heavy</strong> <strong>metals</strong> by the vegetables and cereals<br />
grown in this area and also due to leaching <strong>of</strong> <strong>heavy</strong> <strong>metals</strong> into the<br />
deeper layer <strong>of</strong> the soil. The increments in <strong>heavy</strong> metal concentrations<br />
in the soil were 109% for Cd, 151% for Cu, 162% for Pb, 32% for<br />
Zn, 161% for Ni and 112% for Cr at WWI site as compared to CWI<br />
site in the present study (Table 2). Singh et al. (2004) have also reported<br />
increments <strong>of</strong> 40.29% for Cu, 2.05% for Pb, 41.42% for Zn and<br />
15.7% for Cr in soil <strong>of</strong> Dinapur area irrigated by treated wastewater<br />
as compared to the site irrigated by clean water. In the present<br />
study, Zn (58.1 lgg 1 ), Pb (21.4 lgg 1 ), Ni (23.6 lgg 1 ) and Cu<br />
(21.1 lgg 1 ) concentrations were higher and Cr (19.1 lgg 1 ) concentration<br />
was lower than the mean concentrations <strong>of</strong> 2.80, 20.35,<br />
15.57, 43.56, 13.37 and 30.67 lgg 1 for Cd, Cu, Pb, Zn, Ni and Cr,<br />
respectively, reported by Sharma et al. (2007) in the soil <strong>of</strong> wastewater<br />
irrigated area <strong>of</strong> Dinapur. Zn concentration in soil was highest<br />
and Cd was lowest at both CWI and WWI sites. Highest<br />
concentration <strong>of</strong> Zn was also reported by Singh and Kumar<br />
(2006) in the soil <strong>of</strong> Najafgarh, Delhi where the main sources <strong>of</strong><br />
contamination were sewage water irrigation and by Singh et al.<br />
(2004) and Sharma et al. (2007) from Dinapur area.<br />
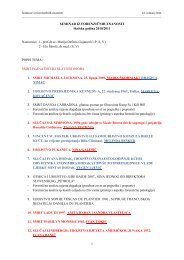
3.3. Levels <strong>of</strong> <strong>heavy</strong> <strong>metals</strong> in the plants<br />
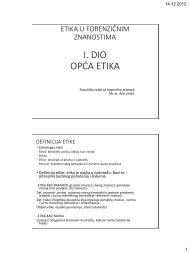
Heavy metal concentrations showed variations among different<br />
vegetables/cereals collected from CWI and WWI irrigated sites<br />
(Figs. 2 and 3). Results <strong>of</strong> two way ANOVA test showed that variations<br />
in the <strong>heavy</strong> metal concentrations were significant due to<br />
site, plant and site plant interaction (Table 3). The variations in<br />
<strong>heavy</strong> metal concentrations in vegetables/cereals <strong>of</strong> the same site<br />
may be ascribed to the differences in their morphology and physiology<br />
for <strong>heavy</strong> metal uptake, exclusion, accumulation and retention<br />
(Carlton-Smith and Davis, 1983; Kumar et al., 2009). Several<br />
fold higher concentrations <strong>of</strong> all the <strong>heavy</strong> <strong>metals</strong> were observed<br />
in all the vegetables and cereal at WWI site as compared to CWI<br />
site. The use <strong>of</strong> contaminated irrigation water at WWI site increased<br />
the uptake and accumulation <strong>of</strong> the <strong>heavy</strong> <strong>metals</strong> in the<br />
plants. This is consistent with reports <strong>of</strong> higher concentrations <strong>of</strong><br />
<strong>heavy</strong> <strong>metals</strong> in vegetables from sewage water irrigated areas as
614 A. Singh et al. / Food and Chemical Toxicology 48 (2010) 611–619<br />
Fig. 1. Monthly variations in <strong>heavy</strong> metal concentrations <strong>of</strong> water at WWI and CWI sites.<br />
Table 2<br />
The range and mean concentrations (lg g 1 ) <strong>of</strong> <strong>heavy</strong> <strong>metals</strong> in soil <strong>of</strong> wastewater (WWI) and clean water irrigated (CWI) sites.<br />
Heavy <strong>metals</strong> CWI WWI Safe limits<br />
Range Mean Range Mean Indian (Awashthi, 2000) International (European Union, 2002)<br />
Cd 0.81–2.62 1.49 1.92–4.53 3.12 **<br />
Cu 6.30–11.56 8.39 18.36–25.50 21.13 ***<br />
Pb 7.73–8.60 8.15 14.26–24.10 21.39 ***<br />
Zn 38.96–50.18 44.19 53.43–64.56 58.13 ***<br />
Ni 7.16–11.91 9.06 19.93–28.18 23.64 ***<br />
Cr 7.35–11.17 9.07 17.92–21.18 19.21 ***<br />
Student’s t-test was done for mean value <strong>of</strong> <strong>heavy</strong> metal concentrations between CWI and WWI site.<br />
**<br />
Level <strong>of</strong> significance: p 6 0.01.<br />
***<br />
Level <strong>of</strong> significance: p 6 0.001.<br />
compared to the tubewell water irrigated areas <strong>of</strong> Ludhiana city <strong>of</strong><br />
Punjab (Kawatra and Bakhetia, 2008).<br />
Among leafy vegetables (palak, amaranthus and cabbage) at<br />
WW1 site, Ni (20.19 lgg 1 ) concentration was highest in palak<br />
3–6 3.0<br />
135–270 140<br />
250–500 300<br />
300–600 300<br />
75–150 75<br />
– 150<br />
(Fig. 3). Sharma et al. (2007) have reported much lower concentration<br />
<strong>of</strong> Ni in palak grown in the area irrigated with treated sewage<br />
water. This difference may be ascribed to samples collected during<br />
two specific periods in the year i.e. winter (December to January)
and summer (April to May) season by Sharma et al. (2007),<br />
whereas in the present study sampling was conducted fortnightly<br />
for a year. For other vegetables, Zn concentration was highest in lady’s<br />
finger (68.54 lgg 1 ). The observed value <strong>of</strong> Zn during the<br />
present study was lower than the value (130.14 lgg 1 ) recorded<br />
by Sharma et al. (2006) in lady’s finger collected from the agricultural<br />
field <strong>of</strong> Dinapur area irrigated with treated wastewater.<br />
Among all the vegetables the concentration <strong>of</strong> Cu was maximum<br />
(17.95 lgg 1 ) in tomato. Liu et al. (2006) found 12-fold higher<br />
Cu concentration (201.75 lgg 1 ) in tomato collected from the<br />
wastewater irrigated area <strong>of</strong> Zhengzhou city, China than clean<br />
water irrigated area. In radish, the mean concentrations <strong>of</strong> Cd<br />
(2.19 lgg 1 ), Pb (12.20 lgg 1 ), Cr (3.69 lgg 1 ) and Cu<br />
(13.75 lgg 1 ) were higher than the values (0.082 lgg 1 for Cd,<br />
0.47 lgg 1 for Pb, 0.38 lgg 1 for Cr, 8.65 lgg 1 for Cu) obtained<br />
from a suburban area <strong>of</strong> Zhengzhou city, Henan Province, China<br />
(Liu et al., 2006), but were lower than the concentrations<br />
(17.79 lgg 1 for Cd, 57. 63 lgg 1 for Pb, 78.02 lgg 1 for Cr and<br />
28.08 lgg 1 for Cu) reported in radish collected from treated<br />
wastewater irrigated suburban area <strong>of</strong> Titagarh (Gupta et al.,<br />
2008). Cauliflower also had lower concentrations <strong>of</strong> all the <strong>heavy</strong><br />
<strong>metals</strong> during the present study as compared to the values by Gupta<br />
et al. (2008). When the concentrations <strong>of</strong> Cu and Zn in radish,<br />
A. Singh et al. / Food and Chemical Toxicology 48 (2010) 611–619 615<br />
Fig. 2. Mean concentration <strong>of</strong> <strong>heavy</strong> <strong>metals</strong> in plant samples collected from CWI sites.<br />
brinjal and cauliflower grown at wastewater irrigated sites <strong>of</strong><br />
Rajasthan, India (Arora et al., 2008) were compared, Zn was similar<br />
and Cu was higher in all the three vegetables during the present<br />
study.<br />
Mean concentrations <strong>of</strong> all the <strong>heavy</strong> <strong>metals</strong> were lower in the<br />
cereals (wheat and rice) as compared with the vegetable crops<br />
(Fig. 3). Sinha et al. (2006) have also found lower concentrations<br />
<strong>of</strong> the <strong>heavy</strong> <strong>metals</strong> in cereal crops as compared to leafy and non<br />
leafy vegetables grown in wastewater irrigated areas. Among all<br />
the <strong>heavy</strong> <strong>metals</strong>, Zn showed maximum and Cd showed minimum<br />
concentration in all the vegetables and cereals. Sharma et al.<br />
(2009) have also found highest concentration <strong>of</strong> Zn as compared<br />
to Cu, Cd and Pb in the vegetables collected from market as well<br />
as production sites <strong>of</strong> Varanasi city, India. The variations in the metal<br />
concentrations <strong>of</strong> vegetables may also be ascribed to the variability<br />
in the absorption <strong>of</strong> <strong>metals</strong> in plants and their further<br />
translocation within the plants (Vousta et al., 1996). Computation<br />
<strong>of</strong> correlation coefficients showed that Cu and Cd concentrations in<br />
palak and rice were positively and significantly correlated with<br />
their respective concentrations in the soil (Table 4). In amaranthus,<br />
palak and bitter gourd, only Cd showed positive relationship. In<br />
case <strong>of</strong> radish, cauliflower, tomato and sponge gourd, the correlations<br />
were significant for Cr. Positive correlations suggest that
616 A. Singh et al. / Food and Chemical Toxicology 48 (2010) 611–619<br />
Table 3<br />
Results <strong>of</strong> two way ANOVA test for <strong>heavy</strong> metal concentrations in plants.<br />
Metals Site Plants Site plant<br />
Cd 417.89 ***<br />
Cu 191.63 ***<br />
Pb 604.43 ***<br />
Zn 588.58 ***<br />
Ni 934.22 ***<br />
Cr 94.80 ***<br />
*** Level <strong>of</strong> significance: p < 0.001.<br />
the <strong>metals</strong> in plants were translocated efficiently from the soil<br />
through root system. Significant negative correlations were found<br />
for Pb in palak, Cd in bottle gourd and radish and Zn in palak, tomato,<br />
pumpkin and pointed gourd. Sinha et al. (2006) have also<br />
found positive and negative correlations between <strong>heavy</strong> metal concentrations<br />
<strong>of</strong> plants and soil, which may be due to multiple interactions<br />
among <strong>heavy</strong> <strong>metals</strong> for uptake in the plants (An et al.,<br />
2004).<br />
When the present concentrations <strong>of</strong> <strong>metals</strong> were compared<br />
with permissible limits <strong>of</strong> Indian Standard (Awashthi, 2000) and<br />
safe limits given by WHO/FAO (WHO/ FAO, 2007), then it was<br />
found that at WWI site Cd, Pb and Ni concentrations were higher<br />
Fig. 3. Mean concentration <strong>of</strong> <strong>heavy</strong> <strong>metals</strong> in plant samples collected from WWI sites.<br />
7.17 ***<br />
16.09 ***<br />
10.01 ***<br />
73.54 ***<br />
2.70 ***<br />
3.86 ***<br />
7.44 ***<br />
5.92 ***<br />
10.36 ***<br />
46.91 ***<br />
2.52 ***<br />
4.36 ***<br />
in all the vegetables and cereal crops, whereas Zn concentration<br />
was higher than both the safe limits in lady’s fingers and cabbage.<br />
The present concentrations <strong>of</strong> Cd and Pb were higher in all the vegetables<br />
and cereal crops when compared with safe limits given by<br />
EU commission regulation (European Union, 2006). Cadmium and<br />
Pb are nonessential <strong>metals</strong> causing adverse health effects even at<br />
very low concentrations (Ikeda et al., 2000). Zhuang et al. (2009)<br />
have also found higher than the maximum permissible levels <strong>of</strong><br />
Cd and Pb concentrations in vegetables collected from six sampling<br />
sites around Dabaoshan mine located at Shaoguan city, Guangdong,<br />
southern China.<br />
3.4. Heavy metal concentrations in milk<br />
Concentrations <strong>of</strong> all the <strong>heavy</strong> <strong>metals</strong> were higher in milk samples<br />
collected from wastewater irrigated site as compared to the<br />
samples from clean water irrigated site (Figs. 2 and 3). Heavy metal<br />
concentration was highest for Zn followed by Cu > Pb > Cr > -<br />
Ni > Cd. Concentrations <strong>of</strong> all the <strong>heavy</strong> <strong>metals</strong> were below the safe<br />
limits (WHO/FAO, 2007).<br />
Milk has property <strong>of</strong> retention <strong>of</strong> <strong>metals</strong> due to formation <strong>of</strong><br />
bioactive (lipophilic) complex (Leeuwen and Pinheiro, 2001;<br />
Buechler et al., 2002). Milk samples collected from wastewater irrigated<br />
site showed about three times higher concentrations <strong>of</strong> Cd
Table 4<br />
Correlation coefficients (r 2 ) between <strong>heavy</strong> metal concentrations in the edible parts <strong>of</strong> the plants and metal concentrations in the soil.<br />
Vegetables/cereals Cd Cu Pb Zn Ni Cr<br />
Palak 0.86 **<br />
Amaranthus 0.86 **<br />
Cabbage 0.04 NS<br />
Cauliflower 0.28 NS<br />
Lady’s fingers 0.38 NS<br />
Brinjal 0.29 NS<br />
Tomato 0.39 NS<br />
Bottle gourd 0.81 **<br />
Sponge gourd 0.001 NS<br />
Bitter gourd 0.79 **<br />
Pumpkin 0.08 NS<br />
Pointed gourd 0.48 NS<br />
Radish 0.69 **<br />
Wheat 0.12 NS<br />
Rice 0.81 **<br />
NS = not significant.<br />
* Level <strong>of</strong> significance: p < 0.05.<br />
** Level <strong>of</strong> significance: p < 0.01.<br />
and Ni, five times <strong>of</strong> Cu, Pb, Zn and seven times <strong>of</strong> Cr as compared<br />
to the respective <strong>heavy</strong> metal concentrations in the milk samples<br />
collected from clean water irrigated site. In the present study, milk<br />
was found to be the least responsible for causing health <strong>risk</strong> due to<br />
<strong>heavy</strong> metal <strong>intake</strong> as the concentrations <strong>of</strong> all the <strong>heavy</strong> <strong>metals</strong><br />
were very low as compared to the vegetables/cereals. Zheng<br />
et al. (2007) have also found lower concentrations <strong>of</strong> Cd and Cu<br />
in milk samples as compared to other common foodstuff collected<br />
from the industrial area <strong>of</strong> Huludao city, China where Hg, Pb, Cd, Zn<br />
and Cu are added into the environment in large quantities through<br />
atmospheric deposition, solid waste disposal, sludge application<br />
and wastewater irrigation. The mean concentrations Cd, Pb, Zn<br />
and Cu reported in milk samples <strong>of</strong> Huludao city, China were<br />
respectively, 0.002, 0.011, 28.98 and 0.307 lgml 1 (Zheng et al.,<br />
2007), whereas during the present study the concentrations <strong>of</strong><br />
respective <strong>metals</strong> were 0.003, 0.044, 0.290 and 0.0.055 lgml 1 .<br />
Marti-Cid et al. (2009) have also found lower concentration <strong>of</strong><br />
Mn in milk sample as compared to the cereal and vegetable crops<br />
collected from localities <strong>of</strong> Tarragona Country (Catalonia, Spain),<br />
near a hazardous waste incinerator.<br />
3.5. Enrichment factor<br />
0.69 **<br />
0.56 NS<br />
0.85 NS<br />
0.06 NS<br />
0.15 NS<br />
0.39 *<br />
0.75 *<br />
0.33 NS<br />
0.47 NS<br />
0.49 NS<br />
0.43 NS<br />
0.22 NS<br />
0.26 NS<br />
0.29 NS<br />
0.76 **<br />
Higher values <strong>of</strong> enrichment factor (EF) suggest poor retention<br />
<strong>of</strong> <strong>metals</strong> in soil and/or more translocation in plants. Within the<br />
Table 5<br />
Enrichment factor <strong>of</strong> <strong>heavy</strong> <strong>metals</strong> in collected foodstuffs from the experimental site.<br />
Foodstuffs Cd Cu Pb Zn Ni Cr<br />
Palak 2.63 0.94 23.08 1.63 18.47 3.47<br />
Amaranthus 2.74 0.72 24.39 1.03 20.69 8.75<br />
Cabbage 10.88 0.59 51.92 3.08 17.22 5.47<br />
Cauliflower 2.30 1.71 28.33 1.42 18.71 1.66<br />
Lady’s fingers 8.04 0.42 31.38 6.14 10.45 14.35<br />
Brinjal 3.92 0.84 30.63 1.37 20.60 8.96<br />
Tomato 3.77 1.12 21.61 1.34 9.68 5.25<br />
Bottle gourd 1.41 0.29 11.48 0.67 3.50 2.00<br />
Sponge gourd 4.22 0.61 16.34 1.08 16.23 2.78<br />
Bitter gourd nf nf nf nf nf nf<br />
Pumpkin 3.43 0.77 52.12 1.43 18.17 4.67<br />
Pointed gourd 0.37 0.18 3.79 0.30 4.10 0.27<br />
Radish 2.17 1.15 14.02 1.36 15.28 4.32<br />
Wheat 4.57 1.54 34.98 2.42 15.26 0.58<br />
Rice 6.87 1.23 31.59 1.52 7.98 31.51<br />
nf = Not found at clean water irrigated site during sampling period.<br />
A. Singh et al. / Food and Chemical Toxicology 48 (2010) 611–619 617<br />
0.56 **<br />
0.70 *<br />
0.10 NS<br />
0.38 NS<br />
0.95 **<br />
0.22 NS<br />
0.44 NS<br />
0.26 NS<br />
0.27 NS<br />
0.001 NS<br />
0.57 NS<br />
0.79 *<br />
0.15 NS<br />
0.37 NS<br />
0.31 NS<br />
0.86 **<br />
0.44 NS<br />
0.59 NS<br />
0.28 NS<br />
0.45 NS<br />
0.59 NS<br />
0.76 **<br />
0.08 NS<br />
0.33 NS<br />
0.08 NS<br />
0.68 *<br />
0.69 *<br />
0.43 NS<br />
0.03 NS<br />
0.27 NS<br />
0.08 NS<br />
0.16 NS<br />
0.99 **<br />
0.33 NS<br />
0.01 NS<br />
0.11 NS<br />
0.62 *<br />
0.92 **<br />
0.44 NS<br />
0.85 **<br />
0.24 NS<br />
0.86 **<br />
0.13 NS<br />
0.23 NS<br />
0.79 **<br />
plants, cabbage (leafy vegetable) showed highest EF value (10.88)<br />
for Cd and amaranthus for Ni (Table 5). Fytianos et al. (2001) have<br />
reported higher enrichment factor for Cd through leafy vegetables.<br />
Sridhara Chary et al. (2008) also reported highest enrichment factor<br />
for <strong>heavy</strong> <strong>metals</strong> through leafy vegetables. Enrichment factor <strong>of</strong><br />
other <strong>metals</strong> like Pb, Zn and Cr was highest in pumpkin, lady’s fingers<br />
and rice, respectively (Table 5). Enrichment factor <strong>of</strong> <strong>heavy</strong><br />
<strong>metals</strong> depends upon bioavailability <strong>of</strong> <strong>metals</strong>, which in turn depends<br />
upon its concentration in the soil, their chemical forms, difference<br />
in uptake capability and growth rate <strong>of</strong> different plant<br />
species (Tinker, 1981). The higher uptake <strong>of</strong> <strong>heavy</strong> <strong>metals</strong> in leafy<br />
vegetables may be due to higher transpiration rate to maintain the<br />
growth and moisture content <strong>of</strong> these plants (Tani and Barrington,<br />
2005).<br />
3.6. Metal pollution index and health <strong>risk</strong> <strong>assessment</strong><br />
0.34 NS<br />
0.43 NS<br />
0.62 NS<br />
0.98 **<br />
0.41 NS<br />
0.07 NS<br />
0.91 **<br />
0.66 *<br />
0.69 **<br />
0.65 *<br />
0.53 NS<br />
0.50<br />
0.89 **<br />
0.06 NS<br />
0.72 *<br />
Metal pollution index (MPI) is suggested to be a reliable and<br />
precise method for metal pollution monitoring <strong>of</strong> wastewater irrigated<br />
areas (Usero et al., 1997). Among different vegetables, cabbage<br />
showed highest value <strong>of</strong> MPI followed by palak. As<br />
compared to the vegetables, wheat and rice showed lower metal<br />
pollution index (Fig. 4). Higher MPI <strong>of</strong> cabbage, palak, brinjal and<br />
lady’s finger suggests that these vegetables may cause more human<br />
health <strong>risk</strong> due to higher accumulation <strong>of</strong> <strong>heavy</strong> <strong>metals</strong> in<br />
the edible portion.<br />
To assess the health <strong>risk</strong> associated with <strong>heavy</strong> metal contamination<br />
<strong>of</strong> plants grown locally, estimated exposure and <strong>risk</strong> index<br />
were calculated. The results showed that Cd, Pb and Ni contamination<br />
in plants had greatest potential to pose health <strong>risk</strong> to the consumers<br />
(Table 6). <strong>Health</strong> <strong>risk</strong> index was more than 1 for Cd in all<br />
the plants except radish, pointed gourd and tomato. For Pb, it<br />
was higher in all the leafy vegetables, lady’s finger, brinjal, bottle<br />
gourd and cereal crops, whereas for Ni, it was higher in cereal crops<br />
and all the leafy vegetables except cabbage. Although cereal crops<br />
(wheat and rice) have lesser concentrations <strong>of</strong> <strong>metals</strong> than vegetables,<br />
but the health <strong>risk</strong> index was higher. This may be due to higher<br />
proportion <strong>of</strong> cereals in diet, which consequently increased the<br />
health <strong>risk</strong> index. In the present study, Cu, Zn and Cr were not<br />
found to cause any <strong>risk</strong> to the local population. Cui et al. (2004)<br />
have also reported that local residents <strong>of</strong> an area near a smelter<br />
in Nanning, China have been exposed to Cd and Pb through consumption<br />
<strong>of</strong> vegetables, but no <strong>risk</strong> was found due to Cu and Zn.
618 A. Singh et al. / Food and Chemical Toxicology 48 (2010) 611–619<br />
4. Conclusions<br />
Irrigation <strong>of</strong> agricultural lands with treated and untreated sewage<br />
wastewater led to the accumulation <strong>of</strong> <strong>heavy</strong> <strong>metals</strong> in the soil,<br />
vegetables, cereals and milk samples. Variations in the <strong>heavy</strong> metal<br />
concentrations between the test vegetables/cereal crops reflect the<br />
differences in uptake capabilities and their further translocation to<br />
the edible portion <strong>of</strong> the plants. Cadmium, Pb and Ni concentrations<br />
were above the national and various international permissible<br />
limits in all the vegetables and cereal crops. The metal<br />
pollution index and health <strong>risk</strong> index <strong>of</strong> <strong>heavy</strong> <strong>metals</strong> also suggest<br />
that Cd, Pb and Ni contamination in most <strong>of</strong> the test plants had potential<br />
for human health <strong>risk</strong> due to consumption <strong>of</strong> plants grown<br />
at waste water irrigated site. Milk is found to be least contaminated<br />
by <strong>heavy</strong> <strong>metals</strong> as its metal pollution index and health <strong>risk</strong><br />
index were lower compared to other foodstuffs. The health <strong>risk</strong> index<br />
<strong>of</strong> cereals was higher than vegetables due to higher proportion<br />
<strong>of</strong> cereals in the diet. Consumption <strong>of</strong> foodstuff with elevated levels<br />
<strong>of</strong> <strong>heavy</strong> <strong>metals</strong> may lead to high level <strong>of</strong> accumulation in the body<br />
causing related health disorders. The study suggests that even<br />
though there are low concentrations <strong>of</strong> <strong>heavy</strong> <strong>metals</strong> in irrigation<br />
water, its long term use caused <strong>heavy</strong> metal contamination leading<br />
to health <strong>risk</strong> <strong>of</strong> consumers. Thus urgent attention is needed to<br />
Fig. 4. Metal pollution index in different foodstuffs from wastewater irrigated site.<br />
Table 6<br />
<strong>Health</strong> <strong>risk</strong> index (HRI) <strong>of</strong> <strong>heavy</strong> <strong>metals</strong> <strong>via</strong> <strong>intake</strong> <strong>of</strong> foodstuffs from wastewater irrigated sites.<br />
HRI<br />
Foodstuffs Cd Cu Pb Zn Ni Cr<br />
Palak 4.62 2.4E 02 2.91 5.1E 03 1.31 2.4E 04<br />
Amaranthus 5.32 1.6E 02 4.10 3.4E 03 1.61 4.2E 04<br />
Cabbage 10.16 9.0E 03 1.68 8.8E 03 0.83 2.0E 04<br />
Cauliflower 3.88 3.1E 03 7.49 7.4E 03 1.80 2.0E 04<br />
Lady’s fingers 5.08 6.0E 03 1.52 5.7E 03 0.43 2.9E 04<br />
Brinjal 1.48 8.0E 03 1.11 1.1E 03 0.47 8.0E 05<br />
Tomato 0.49 5.0E 03 0.43 6.0E 04 0.18 5.0E 05<br />
Bottle gourd 1.07 6.0E 03 0.82 8.0E 04 0.37 2.5E 04<br />
Sponge gourd 2.10 9.0E 03 0.95 1.2E 03 0.54 2.3E 04<br />
Bitter gourd 1.61 3.0E 03 1.09 1.0E 03 0.39 3.0E 04<br />
Pumpkin 1.14 4.0E 03 0.96 1.0E 03 0.36 7.0E 05<br />
Pointed gourd 0.76 4.0E 03 0.31 5.0E 04 0.21 1.3E 04<br />
Radish 0.49 4.0E 03 0.41 7.0E 04 0.21 4.0E 04<br />
Wheat 5.86 5.16E 02 4.37 4.81E 03 2.40 2.97E 04<br />
Rice 9.15 4.39E 02 6.83 8.40E 03 1.32 2.17E 04<br />
Milk 2.0E 05 1.0E 06 4.0E 04 2.0E 06 7.0E 04 1.0E 06<br />
3devise and implement appropriate means <strong>of</strong> monitoring and regulating<br />
industrial and domestic effluent, and providing appropriate<br />
advice and support for the safe and productive use <strong>of</strong> wastewater<br />
for irrigation.<br />
Conflict <strong>of</strong> interest<br />
The authors declare that there are no conflicts <strong>of</strong> interest.<br />
Acknowledgements<br />
A. Singh is thankful to the Center for Advanced Study in Botany,<br />
Banaras Hindu University and R.K. Sharma to CSIR, New Delhi for<br />
providing Senior Research Fellowships. The present research work<br />
is an out-put <strong>of</strong> collaborative research project entitled ‘Contaminated<br />
irrigation water and food safety for the urban and peri-urban<br />
poor: appropriate measure for monitoring and control from field<br />
research in India and Zambia’ led by Fiona Marshall and funded<br />
by Department for International Development (DFID), UK (EnKar<br />
R8160, www.pollutionandfood.net).
References<br />
Allen, S.E., Grimshaw, H.M., Rowland, A.P., 1986. Chemical analysis. In: Moore, P.D.,<br />
Chapman, S.B. (Eds.), Methods in Plant Ecology. Blackwell, Scientific Publication,<br />
Oxford, London, pp. 285–344.<br />
An, Y.J., Kim, Y.M., Jeong, S.W., 2004. Combined effects <strong>of</strong> copper, cadmium and lead<br />
upon Cucumis sativus growth and bioaccumulation. Sci. Total Environ. 326, 85–<br />
93.<br />
APHA (American Public <strong>Health</strong> Association), 2005. Standard methods for the<br />
examination <strong>of</strong> Water and Wastewater, American Public <strong>Health</strong> Association,<br />
Washington, DC.<br />
Arora, M., Bala, K., Rani, S., Rani, A., Kaur, B., Mittal, N., 2008. Heavy metal<br />
accumulation in vegetables irrigated with different water sources. Food Chem.<br />
111 (4), 811–815.<br />
Awashthi, S.K. (Ed.), 2000. Prevention <strong>of</strong> Food Adulteration Act No. 37 <strong>of</strong> 1954.<br />
Central and State Rules as Amended for 1999, Ashoka Law House, New Delhi.<br />
Buat-Menard, P., Chesselet, R., 1979. Variable influence <strong>of</strong> the atmospheric flux on<br />
the trace metal chemistry <strong>of</strong> oceanic suspended matter. Earth Planet Sci. Lett.<br />
42, 398–411.<br />
Buechler, S.J., Devi, G., Raschid-Sally, L., 2002. Livelihoods and wastewater irrigated<br />
agriculture along the Musi River in Hyderabad City, Andhra Pradesh, India. U. A.<br />
Magazine 8, 14–17.<br />
Carlton-Smith, C.H., Davis, R.D., 1983. Comparative uptake <strong>of</strong> <strong>heavy</strong> <strong>metals</strong> by<br />
forage crops grown on sludge-treated soils. In: Proceeding <strong>of</strong> International<br />
Conference on Heavy <strong>metals</strong> in the Environment. CEP Consultants Ltd.,<br />
Edinburg, UK, pp. 3933–3940.<br />
Crounse, R.G., 1983. Geochemistry and man health and disease. Essential elements.<br />
In: Thorntain, I. (Ed.), Applied Environmental Geochemistry. Academic Press,<br />
London, p. 309.<br />
Cui, Y.J., Zhu, Y.G., Zhai, R.H., Chen, D.Y., Huang, Y.Z., Qui, Y., Liang, J.Z., 2004.<br />
Transfer <strong>of</strong> <strong>metals</strong> from near a smelter in Nanning, China. Environ. Int. 30, 785–<br />
791.<br />
Duruibe, J.O., Ogwuegbu, M.D.C., Egwurugwu, J.N., 2007. Heavy metal pollution and<br />
human biotoxic effects. Int. J. Phys. Sci. 2 (5), 112–118.<br />
European Union, 2002. Heavy Metals in Wastes, European Commission on<br />
Environment. .<br />
European Union, 2006. Commission Regulation (EC) No. 1881/2006 <strong>of</strong> 19 December<br />
2006 Setting Maximum Levels for Certain Contaminants in foodstuffs. Off. J. Eur.<br />
Union L. 364, 5–24.<br />
FAO, 1985. Water Quality for Agriculture. Paper No. 29 (Rev. 1) UNESCO,<br />
Publication, Rome, p. 96.<br />
Fytianos, K., Katsianis, G., Triantafyllou, P., Zachariadis, G., 2001. Accumulation <strong>of</strong><br />
<strong>heavy</strong> <strong>metals</strong> in vegetables grown in an industrial area in relation to soil. Bull.<br />
Environ. Contamin. Toxicol. 67, 423–430.<br />
Ge, K.Y., 1992. The Status <strong>of</strong> Nutrient and Meal <strong>of</strong> Chinese in the 1990s. Beijing<br />
People’s Hygiene Press, pp. 415–434.<br />
Gupta, N., Khan, D.K., Santra, S.C., 2008. An <strong>assessment</strong> <strong>of</strong> <strong>heavy</strong> metal<br />
contamination in vegetables grown in wastewater-irrigated areas <strong>of</strong> Titagarh,<br />
West Bengal, India. Bull. Environ. Contamin. Toxicol. 80, 115–118.<br />
Ikeda, M., Zhang, Z.W., Shimbo, S., Watanabe, T., Nakatsuka, H., Moon, C.S., Matsuda-<br />
Inoguchi, N., Higashikawa, K., 2000. Urban population exposure to lead and<br />
cadmium in east and south-east Asia. Sci. Total Environ. 249, 373–384.<br />
Kawatra, B.L., Bakhetia, P., 2008. Consumption <strong>of</strong> <strong>heavy</strong> metal and minerals by adult<br />
women through food in sewage and tube well irrigated area around Ludhiana<br />
city (Punjab, India). J. Human Ecol. 23 (4), 351–354.<br />
Kumar, A., Sharma, I.K., Sharma, A., Varshney, S., Verma, P.S., 2009. Heavy <strong>metals</strong><br />
contamination <strong>of</strong> vegetable foodstuffs in Jaipur (India). Electron. J. Environ. Agri.<br />
Food Chem. 8 (2), 96–101.<br />
Leeuwen, H.P.V., Pinheiro, J.P., 2001. Speciation dynamics and bioavailability <strong>of</strong><br />
<strong>metals</strong>. Exploration <strong>of</strong> the case <strong>of</strong> two uptake routes. Pure Appl. Chem. 73 (1),<br />
39–44.<br />
Liu, W.X., Li, H.H., Li, S.R., Wang, Y.W., 2006. Heavy metal accumulation <strong>of</strong> edible<br />
vegetable cultivated by People’s Republic <strong>of</strong> China. Bull. Environ. Contamin.<br />
Toxicol. 76, 163–170.<br />
Marshall, F.M., Holden, J., Ghose, C., Chisala, B., Kapungwe, E., Volk, J., Agrawal, M.,<br />
Agrawal, R., Sharma, R.K., Singh, R.P., 2007. Contaminated Irrigation Water and<br />
A. Singh et al. / Food and Chemical Toxicology 48 (2010) 611–619 619<br />
Food Safety for the Urban and Peri-urban Poor: Appropriate Measures for<br />
Monitoring and Control from Field Research in India and Zambia, Incpetion<br />
Report DFID Enkar R8160, SPRU, University <strong>of</strong> Sussex.<br />
.<br />
Marti-Cid, R., Perello, G., Domingo, J.L., 2009. Dietary exposure to <strong>metals</strong> by<br />
individuals living near a hazardous waste incinerator in Catalonia, Spain:<br />
temporal trend. Biol. Trace Elem. Res.. doi:10.1007/s12011-099-8368-z.<br />
McCluggage, D., 1991. Heavy Metal Poisoning, NCS Magazine. The Bird Hospital, CO,<br />
USA. .<br />
Muchuweti, M., Birkett, J.W., Chinyanga, E., Zvauya, R., Scrimshaw, M.D., Lister, J.N.,<br />
2006. Heavy metal content <strong>of</strong> vegetables irrigated with mixtures <strong>of</strong> wastewater<br />
and sewage sludge in Zimbabwe: implication for human health. Agri. Ecosys.<br />
Environ. 112, 41–48.<br />
Sharma, R.K., Agrawal, M., Marshall, F.M., 2006. Heavy <strong>metals</strong> contamination in<br />
vegetables grown in wastewater irrigated areas <strong>of</strong> Varanasi, India. Bull. Environ.<br />
Contamin. Toxicol. 77, 311–318.<br />
Sharma, R.K., Agrawal, M., Marshall, F.M., 2007. Heavy <strong>metals</strong> contamination <strong>of</strong> soil<br />
and vegetables in suburban areas <strong>of</strong> Varanasi, India. Ecotoxicol. Environ. Saf. 66,<br />
258–266.<br />
Sharma, R.K., Agrawal, M., Marshall, F.M., 2009. Heavy metal in vegetables collected<br />
from production and market sites <strong>of</strong> tropical urban area <strong>of</strong> India. Food Chem.<br />
Toxicol. 47, 583–591.<br />
Singh, S., Kumar, M., 2006. Heavy metal load <strong>of</strong> soil, water and vegetables in<br />
periurban Delhi. Environ. Monit. Assess. 120, 79–91.<br />
Singh, K.P., Mohon, D., Sinha, S., Dalwani, R., 2004. Impact <strong>assessment</strong> <strong>of</strong> treated/<br />
untreated wastewater toxicants discharge by sewage treatment plants on<br />
health, agricultural, and environmental quality in wastewater disposal area.<br />
Chemosphere 55, 227–255.<br />
Sinha, S., Gupta, A.K., Bhatt, K., Pandey, K., Rai, U.N., Singh, K.P., 2006. Distribution <strong>of</strong><br />
<strong>metals</strong> in the edible plants grown at Jajmau, Kanpur (India) receiving treated<br />
tannery wastewater, relation with physicochemical properties <strong>of</strong> the soil.<br />
Environ. Monit. Assess. 115, 1–22.<br />
Sridhara Chary, N., Kamala, C.T., Samuel Suman, R.D., 2008. Assessing <strong>risk</strong> <strong>of</strong> <strong>heavy</strong><br />
<strong>metals</strong> from consuming food grown on sewage irrigated soils and food chain<br />
transfer. Ecotoxicol. Environ. Saf. 69 (3), 513–524.<br />
Tani, F.H., Barrington, S., 2005. Zinc and copper uptake by plants under two<br />
transpiration ratios Part I. Wheat (Triticum aestivum L.). Environ. Pollut. 138,<br />
538–547.<br />
Tinker, P.B., 1981. Levels, distribution and chemical forms <strong>of</strong> trace elements in food<br />
plants. Philos. Trans. B 294, 41–55.<br />
USEPA (US Environmental Protection Agency), 1997. Exposure Factors Handbook –<br />
General Factors. EPA/600/P-95/002Fa, vol. I. Office <strong>of</strong> Research and<br />
Development. National Center for Environmental Assessment. US<br />
Environmental Protection Agency. Washington, DC. .<br />
USEPA (US Environmental Protection Agency), 2002. Region 9, Preliminary<br />
Remediation Goals. .<br />
Usero, J., Gonzalez-Regalado, E., Gracia, I., 1997. Trace <strong>metals</strong> in the bivalve<br />
mollusks Ruditapes decussates and Ruditapes phillippinarum from the Atlantic<br />
Coast <strong>of</strong> Southern Spain. Environ. Int. 23 (3), 291–298.<br />
Vousta, D., Grimanis, A., Samara, C., 1996. Trace elements in vegetables grown in an<br />
industrial area in relation to soil and air particulate matter. Environ. Pollut. 94,<br />
325–335.<br />
Wang, X., Sato, T., Xing, B., Tao, S., 2005. <strong>Health</strong> <strong>risk</strong>s <strong>of</strong> <strong>heavy</strong> <strong>metals</strong> to the general<br />
public in Tianjin, China <strong>via</strong> consumption <strong>of</strong> vegetables and fish. Sci. Total<br />
Environ. 350, 28–37.<br />
WHO/FAO, 2007. Joint FAO/WHO Food Standard Programme Codex Alimentarius<br />
Commission 13th Session. Report <strong>of</strong> the Thirty Eight Session <strong>of</strong> the Codex<br />
Committee on Food Hygiene, Houston, United States <strong>of</strong> America, ALINORM 07/<br />
30/13.<br />
Zheng, N., Wang, Q., Zhang, X., Zheng, D., Zhang, Z., Znang, S., 2007. Population<br />
health <strong>risk</strong> due to <strong>dietary</strong> <strong>intake</strong> <strong>of</strong> <strong>heavy</strong> <strong>metals</strong> in the industrial area <strong>of</strong><br />
Huludao City, China. Sci. Total Environ. 387, 96–104.<br />
Zhuang, P., Zou, B., Li, N.Y., Li, Z.A., 2009. Heavy metal contamination in soils and<br />
food crops around Dabaoshan mine in Guangdong, China: implication for<br />
human health. Environ. Geochem. <strong>Health</strong>. doi:10.1007/s10653-009-9248-3.