2005 Preliminary Results - Spirax-Sarco Engineering plc
2005 Preliminary Results - Spirax-Sarco Engineering plc
2005 Preliminary Results - Spirax-Sarco Engineering plc
- No tags were found...
You also want an ePaper? Increase the reach of your titles
YUMPU automatically turns print PDFs into web optimized ePapers that Google loves.
Crossrail Property& RegenerationStudyImpacts and influences on theWest of London area13 June 2013Chris Hall, Director GVA
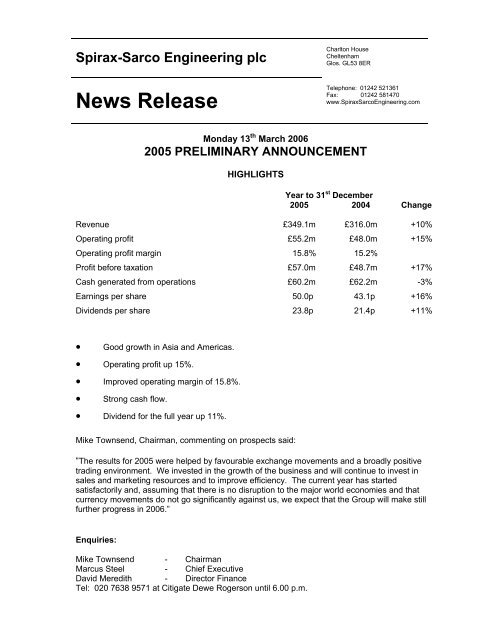
Turnover in the ROW was strongly ahead at £44.8 million (2004: £35.5 million), an increase of26%. This does include the first six months trading of the small Mitech controls companies inSouth Africa following their acquisition in June <strong>2005</strong>. The effect of exchange on the sales wassignificant as the currencies strengthened against sterling, particularly the Brazilian Real. Theunderlying increase in turnover in ROW after allowing for currency movements and theacquisition was still a solid 10%. We achieved good growth in Argentina, South Africa and NewZealand. Sales in Australia were flat.Operating profit in ROW increased by 27% to £6.2 million (2004: £4.9 million) helped byexchange and the Mitech acquisition. The South American trading margins eased slightly, whichheld back the margin to 13.5% for the whole region.INTEREST, TAX AND DIVIDENDSNet finance income was £0.9 million which compares with a figure close to zero in 2004. Thisincreased income results partly from the strong cash flow in the year and partly from an improvednet finance income in respect of defined benefit pension funds.The Group’s share of profits of Associates increased to £0.9 million (2004: £0.7 million). TheGroup pre-tax profit increased by 17% to £57.0 million (2004: £48.7million).The tax charge at 33% was similar to 2004 and earnings per share rose to 50.0p from 43.1p, anincrease of 16%.The Board has decided to recommend a final dividend of 17.0p per share which, together withthe interim dividend of 6.8p per share paid in November, makes a total dividend for the year of23.8p. This compares with a total dividend of 21.4p per share last year, an increase of 11%.The cost of the interim and final dividends is £18.3 million, which is covered 2.1 times byearnings. No scrip alternative to the cash dividend is being offered.BALANCE SHEET AND CASH FLOWWe continue to pay close attention to the management of the balance sheet. Capital employed,comprising property, plant and equipment, inventories, debtors and creditors, increased by 7% to£188 million; at constant exchange rates the increase was 3% including the addition of £1million in respect of the acquisitions of Mitech and EMCO during the year. Underlying workingcapital levels rose by under 5% compared with the 6% organic increase in sales. The value oftangible fixed assets was broadly unchanged at constant exchange rates as additions were inline with the depreciation charge for the year. Under IFRS, the deficit of £45.8 million (beforedeferred tax) in the defined benefit schemes is included as a liability for the first time.Cash flow for the year was strong and net cash balances increased by £17.7 million to £19.0million, underpinned by the good profit and control of capital employed. There was an unusuallylarge inflow of £8.6 million from the issue of shares under the Group’s option scheme andemployee share ownership plan. This was roughly matched by the outflow of £5.9 million foracquisitions and an extra £4 million in cash contributions into the Group’s defined benefit pensionschemes. In 2006, we plan to make additional contributions of around £20 million to the definedbenefit pension schemes, thereby reducing the deficit. In addition, in 2006, we expect to buy inup to 2 million shares to be held by the company to meet the demand for shares in respect ofshare options, the share ownership plan and the performance share plan.”5
SPIRAX-SARCO ENGINEERING <strong>plc</strong>Group Balance Sheet at 31st December <strong>2005</strong>Note <strong>2005</strong>£’0002004£’000ASSETSNon-current assetsProperty, plant and equipment 85,752 83,514Goodwill 15,033 11,862Other intangible assets 8,357 6,988Prepayments 396 345Investment in associates 3,371 2,494Deferred tax 18,536 16,615131,445 121,818Current assetsInventories 64,216 58,229Trade receivables 83,303 76,021Other current assets 8,688 8,388Cash and cash equivalents 9 56,929 48,756213,136 191,394Total assets 344,581 313,212EQUITY AND LIABILITIESCurrent liabilitiesTrade and other payables 46,843 43,429Bank overdrafts 9 3,836 4,842Short term borrowing 9 1,498 -Current portion of long term borrowings 9 25,010 8,183Current tax payable 7,326 6,78884,513 63,242Net current assets 128,623 128,152Non-current liabilitiesLong term borrowings 9 7,540 34,432Deferred tax 7,728 7,273Post retirement benefits 11 45,807 41,335Provisions 747 64461,822 83,684Total liabilities 146,335 146,926Net assets 8 198,246 166,286EquityShare capital 19,238 18,800Share premium account 46,154 38,024Other reserves 7,554 699Retained earnings 124,672 107,957Equity attributable to equity holders of the parent 197,618 165,480Minority interest 628 806Total equity 198,246 166,286Total equity and liabilities 344,581 313,2128
Notes:1. Foreign currency assets and liabilities are translated into sterling at rates of exchangeruling at 31st December. Trading results of overseas subsidiary undertakings have beentranslated into sterling at average rates of exchange ruling during the year.2. Segmental Reporting Primary SegmentThe analysis of revenue by reference to the geographical location of customers is asfollows:-<strong>2005</strong>£’0002004£’000change%changeat constantexchangerates%UK & Republic of Ireland 40,084 39,922 - -Continental Europe 125,343 121,164 +3 +2North America 73,056 64,119 +14 +12Asia 65,841 55,327 +19 +13Rest of the World 44,776 35,459 +26 +16349,100 315,991 +10 +8and by reference to the geographical location of the Group's operations is as follows:-<strong>2005</strong>£’0002004£’000change%changeat constantexchangerates%UK & Republic of Ireland 102,479 97,419 +5 +5Continental Europe 156,050 149,334 +4 +3North America 73,220 64,950 +13 +11Asia 61,263 50,465 +21 +15Rest of the World 45,949 36,482 +26 +15438,961 398,650 +10 +8Intra-group sales (89,861) (82,659) +9 +8Sales to customers 349,100 315,991 +10 +8Secondary segment revenue by business operation:<strong>2005</strong>£’0002004£’000<strong>Spirax</strong> <strong>Sarco</strong> 302,627 273,065Watson-Marlow Bredel 46,473 42,926349,100 315,99111
3. Operating profit, analysed by reference to the geographical location of the Group'soperations, is as follows:-<strong>2005</strong>£’0002004£’000change%* changeat constantexchangerates%UK & Republic of Ireland 10,881 10,533 +3 +5Continental Europe 18,733 17,752 +6 +2North America 7,938 6,601 +20 +25Asia 11,430 8,184 +40 +24Rest of the World 6,188 4,886 +27 +1055,170 47,956 +15 +10Profit from operations figures reflect the allocation of UK incurred central support costs tothe segments to which the expenses relate. This is a change from the July <strong>2005</strong> IFRSrestatement and so 2004 segmental profit figures reflect the changes.Amortisation of intangible assets acquired was £175,000 (2004: £nil) and amortisation ofcapitalised development costs was £834,000 (2004: £632,000).*The percentage change at constant exchange rates in respect of the operating profit alsoincludes an estimate of the transaction effect.4. Net Financing Income<strong>2005</strong>£’0002004£’000Financial expensesBank and other borrowing interest payable (1,704) (1,832)Interest on pension scheme liabilities (9,746) (9,088)(11,450) (10,920)Financial incomeBank interest receivable 1,869 1,518Expected return on pension scheme assets 10,509 9,41512,378 10,933Net financing income 928 13Net pension scheme financing income 763 327Net bank and other interest 165 (314)Net financing income 928 1312
5. Taxation<strong>2005</strong>£’0002004£’000Analysis of charge in periodUK corporation taxCurrent tax on income for the period 12,702 12,164Adjustments in respect of prior periods (268) (148)12,434 12,016Double taxation relief (9,755) (8,851)2,679 3,165Foreign taxCurrent tax on income for the period 15,565 12,752Adjustments in respect of prior periods (47) 4815,518 12,800Total current tax charge 18,197 15,965UK deferred tax 19 70Foreign deferred tax 556 227Tax on profit on ordinary activities 18,772 16,2626. Earnings per share<strong>2005</strong>£’0002004£’000Earnings 38,036 32,314Weighted average shares in issue 76,119,005 74,931,130Dilution 577,169 781,558Diluted weighted average shares in issue 76,696,174 75,712,688Basic earnings per share 50.0p 43.1pDiluted earnings per share 49.6p 42.7pThe dilution is in respect of unexercised share options and the performance share plan.7. Dividends<strong>2005</strong>£’0002004£’000Amounts paid in the yearFinal dividend for the year ended 31st December2004 of 15.1p (2003: 14.1p) per share 11,459 10,552Interim dividend for the year ended 31st December<strong>2005</strong> of 6.8p (2004: 6.3p) per share 5,225 4,73716,684 15,289Amounts arising in respect of the yearInterim dividend for the year ended 31st December<strong>2005</strong> of 6.8p (2004: 6.3p) per share 5,225 4,737Proposed final dividend for the year ended 31stDecember <strong>2005</strong> of 17.0p (2004: 15.1p) per share 13,093 11,45918,318 16,19613
The proposed final dividend is subject to approval by shareholders at the Annual GeneralMeeting and has not been included as a liability in the financial statements.If approved at the annual general meeting on 10th May 2006, the final dividend will bepaid on 22nd May 2006 to shareholders on the register at 21st April 2006. No scripalternative to the cash dividend is being offered.8. The analysis of net assets by reference to the geographical location of the Group’soperations is as follows:-<strong>2005</strong>£’0002004£’000UK & Republic of Ireland 27,836 32,130Continental Europe 58,718 58,893North America 27,194 22,419Asia 35,427 30,190Rest of the World 25,017 17,496174,192 161,128Deferred tax 10,808 9,342Current tax (5,799) (5,483)Net cash 19,045 1,299Net assets 198,246 166,2869. Analysis of changes in net cash1 st Jan<strong>2005</strong>CashFlowExchangemovement31 st Dec<strong>2005</strong>£’000£’000£’000£’000Current portion of long term borrowings (8,183) (25,010)Non-current portion of long termborrowings (34,432) (7,540)Short term borrowings - (1,498)Total borrowings (42,615) (34,048)Comprising:Borrowings (41,768) 7,728 440 (33,600)Finance Leases (847) 372 27 (448)(42,615) 8,100 467 (34,048)Cash and cash equivalents 48,756 7,407 766 56,929Bank overdrafts (4,842) 1,278 (272) (3,836)Net cash and cash equivalents 43,914 8,685 494 53,093Net cash 1,299 16,785 961 19,04514
10. Return on capital employed<strong>2005</strong>£’0002004£’000Capital employedProperty, plant and equipment 85,752 83,514Prepayments 396 345Inventories 64,216 58,229Trade receivables 83,303 76,021Other current assets 8,688 8,388Trade and other payables (46,843) (43,429)Current tax payable (7,326) (6,788)Capital employed 188,186 176,280Average capital employed 182,233 176,303Operating profit 55,170 47,956Acquisition intangibles amortisation 175 -55,345 47,956ROCE 30.4% 27.2%11. Employee benefitsThe Group is accounting for pension cost and share based payments in accordance withInternational Accounting Standard 19 - Employee benefits and International FinancialReporting Standard 2 - Share-based payments.The defined benefit plan expense is recognised in the income statement as follows:-UK Pensions<strong>2005</strong>£’0002004£’000Overseas pensionsand medical<strong>2005</strong> 2004£’000 £’000<strong>2005</strong>£’000Total2004£’000Current service cost (5,700) (6,000) (1,468) (1,372) (7,168) (7,372)Past service cost - - 117 - 117 -Settlement, Curtailment - - - 279 - 279Interest on schemes’ liabilities (8,000) (7,400) (1,746) (1,688) (9,746) (9,088)Expected return on schemes’assets 9,300 8,300 1,209 1,115 10,509 9,415Total expense recognised inincome statement (4,400) (5,100) (1,888) (1,666) (6,288) (6,766)15
A summary of the deficits in the schemes is as follows:-UKpensions£’000Overseaspensions& medical£’000Total£’000Total market value of schemes’assets 152,300 19,048 171,348Present value of the schemes’liabilities (178,600) (38,555) (217,155)Deficit in the schemes (26,300) (19,507) (45,807)Related deferred tax asset 7,890 6,523 14,413Net pension liability <strong>2005</strong> (18,410) (12,984) (31,394)Net pension liability 2004 (17,261) (10,751) (28,012)The charge to the income statement in respect of share-based payments is made up asfollows:-<strong>2005</strong> 2004£’000 £’000Share Option Scheme 374 301Performance Share Plan 139 -Employees Share Ownership Plan 525 502Total expense recognised in income statement 1,038 80312. Basis of preparationThe financial information set out above is derived from the Group’s first financialstatements following the adoption of International Financial Reporting Standards (IFRS).These financial statements have been prepared in accordance with IFRS adopted for usein the EU (‘Adopted IFRS’) in accordance with EU Law (IAS Regulation EC/606/2002).As allowed by IFRS 1 ‘First Time adoption of IFRS’ the group adopted IAS 32 ‘FinancialInstruments: Disclosure and Presentation’ and IAS 39 ‘Financial instruments:Recognition and Measurement’ prospectively from 1st January <strong>2005</strong>. Until 31stDecember 2004, the group accounted for forward exchange contracts in accordance withUK GAAP, and hence the comparative financial statements exclude the impact of thesestandards.On 12th July <strong>2005</strong>, the Group published a comprehensive analysis of the impact ofadopting IFRS from 1st January 2004 - available from the Company’s web site atwww.<strong>Spirax</strong><strong>Sarco</strong><strong>Engineering</strong>.com. This included details of the accounting policiesapplied in restating its financial statements and reconciliations from UK GAAP to IFRS forthe year ended 31st December 2004 and as at 1st January 2004. Some smalladjustments have been made to these statements to reflect reclassifications moreaccurately.The financial information set out above does not constitute the Company’s statutoryaccounts for the years ended 31st December 2004 or <strong>2005</strong>. Statutory accounts for 2004,which were prepared under UK GAAP, have been delivered to the registrar of companies,and those for <strong>2005</strong>, prepared under accounting standards adopted by the EU, will bedelivered in due course. The auditors have reported on those accounts; their reportswere (i) unqualified, (ii) did not include any references to any matters to which theauditors drew attention by way of emphasis without qualifying and (iii) did not containstatements under sections 237(2) or (3) of the Companies Act 1985.16


