PFPI-BiomassIsTheNewCoal-April-2-2014
PFPI-BiomassIsTheNewCoal-April-2-2014
PFPI-BiomassIsTheNewCoal-April-2-2014
- No tags were found...

You also want an ePaper? Increase the reach of your titles
YUMPU automatically turns print PDFs into web optimized ePapers that Google loves.
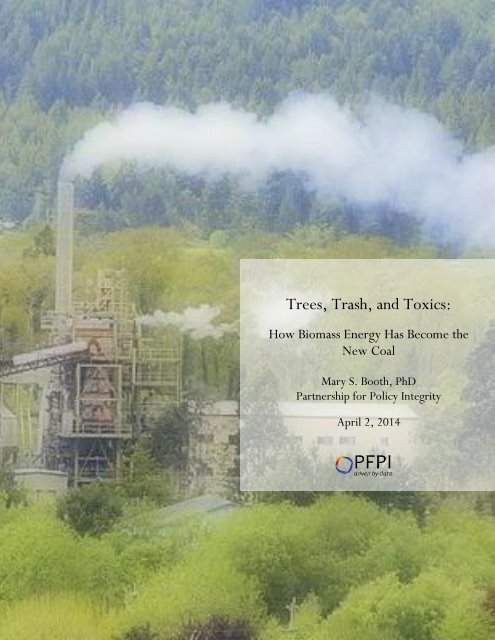
Trees, Trash, and Toxics:How Biomass Energy Has Become theNew CoalMary S. Booth, PhDPartnership for Policy Integrity<strong>April</strong> 2, <strong>2014</strong>
Trees, Trash, and Toxics:How Biomass Energy Has Become the New CoalMary S. Booth, PhDPartnership for Policy Integrity<strong>April</strong> 2, <strong>2014</strong><strong>PFPI</strong> gratefully acknowledges the support of The Heinz Endowments,The Rockefeller Family Fund, The Threshold Foundation, and The Civil Society Institutein supporting this work.2
The fix: EPA should regulate bioenergy CO 2 now. Once in the PSD program, the best availablecontrol technology analysis stage provides an opportunity to discuss how biomass facilities canreduce their net emissions of CO 2.Loophole 3: State regulators help biomass power plants avoid more protectivepermittingOne of the main loopholes allowing biomass plants to avoid PSD permitting is the claim of“synthetic” minor source status for nitrogen oxides and carbon monoxide. Facilities are granted astate-level minor source permit if they claim they will emit less than 250 tons of each pollutant peryear, and thus get to escape PSD provisions that would limit pollution emissions, require use ofbest available control technology, and require air quality modeling to ensure a facility won’t violateEPA’s health standards for air pollution. In our database, the majority of facilities ranging in sizefrom 6 MW to 60 MW opted for synthetic minor status, requiring the facility to emit less than 250tons of CO, NOx, PM, and SO 2 per year to comply.For small facilities, the 250 ton per year cap in a synthetic minor permit means they can emit farmore pollution than necessary, given their size; for large plants, the cap requires they must meetunrealistically low emissions rates in order to emit less than 250 tons per year. In one case, wherecitizen petitioners protested a 24 MW plant in Hawaii that had been granted synthetic minor status,EPA agreed that the facility’s emission limits were unenforceable and that the plant should likely beregulated as a major source. However, even though many other permits have been issued thatappear to be even less enforceable than the Hawaii permit, EPA has opted to not get involved withmost state-issued synthetic minor source permits, and as a result the permits continue to be issuedwith impunity. Currently, the majority of biomass power plants now proposed or underconstruction are still able to avoid even the minimal protections that PSD permitting provides.The fix: If Loophole 1 were fixed, and PSD permitting was triggered at 100 tons of emissions,most biomass plants would have to go through PSD permitting. Likewise, if EPA implemented theU.S. Court of Appeals decision and regulated bioenergy CO 2 under the Clean Air Act, most plantswould need to go through PSD permitting because most emit more than 100,000 tons of CO 2 .Beyond those fixes, EPA should subject every power plant permit to federal oversight – especiallythose from states like Georgia, where regulators routinely issue synthetic minor source permitswith the most minimal of conditions. It is going to take meaningful federal oversight to ensure thatbioenergy permit contain emissions limits that are federally enforceable, as the Clean Air Actrequires.Loophole 4: Most biomass plants have no restrictions on hazardous air emissionsIn the 88 bioenergy permits we examined, we found almost no accountability for emissions ofhazardous air pollutants (HAPs), a group of especially toxic pollutants that includes hydrochloricacid, dioxins, carcinogens like benzene and formaldehyde, and heavy metals like arsenic, lead, andcadmium. Emissions of HAPs from biomass burners are barely regulated. A part of the Clean Air8
Act known informally as the “boiler rule” sets the “Maximum Available Control Technology”(MACT) emissions standards for hydrochloric acid (HCl), as well as PM and CO, which serve asproxies for HAPs that are treated by EPA as being co-emitted with these pollutants. However,MACT standards for emissions of HCl, PM, and CO are only set for “major” sources of HAPs,which are defined as facilities that emit more than 10 tons per year of any one HAP or more than25 tons of all HAPs per year. Minor sources that claim to emit below these thresholds are onlyrequired to meet an extremely lax standard for particulate matter – no emissions standards forHAPs are set directly. Thus, it’s not surprising that most facilities claim to be minor sources forHAPs, no matter what their size.The term “maximum available control technology” is in fact a profound misnomer, as the standardsthat are set for emissions under MACT are often far greater than what can be accomplished usingpollution control technologies that are readily available today, especially for particulate matter.Under the biomass MACT rule, a major source biomass plant using a stoker boiler is allowed toemit more than 27 times the particulate matter of a coal boiler , and EPA rules allow most biomassplants to emit more than 10 times the particulate matter of a commercial and industrial wasteincinerator. The rules for waste incinerators limit emissions of specific HAPs, including someheavy metals, but the rules for biomass plants do not contain any such limits. As more and morecontaminated fuels are being burned as biomass, the lack of limits on emissions of HAPs is bound toincrease emissions of the most toxic compounds from so-called “clean” bioenergy.The fix: The EPA should make the so-called Maximum Available Control Technology standardmeaningful, by setting standards as the Clean Air Act requires – standards that require themaximum degree of reduction of each HAP that is “achievable,” considering cost and otherstatutory factors. At a minimum, without regard to cost, they must reflect the emission level thatthe cleanest sources have achieved – sources that are using emission control technologies that areeffective and available, such as high-efficiency fabric filters that dramatically reduce particulatematter emissions. The biomass MACT should be made at least as protective as the standards forwaste incinerators and coal boilers – especially given that facilities can be classified as biomassboilers even when burning up to 90% coal, and when burning highly contaminated wastes.Loophole 5: The biomass industry lowballs estimates of toxic emissions to avoidregulationIn our database of 88 permits, 59% of facilities claimed they were minor (“area”) sources for HAPs,including the 116 MW Gainesville Renewable Energy plant in Florida. As with criteriapollutants, this non-major or area source designation is granted so easily by state permittingagencies, companies essentially have to volunteer to be regulated as major sources. Companiessupport their claim to be minor sources by using industry-supplied emission factors for HAPs,rather than EPA-sanctioned factors, to calculate their projected emissions during the permittingprocess. These industry-provided factors are in many cases orders of magnitude lower than EPAsanctionedfactors, but the organization that provides the emission factors, the National Council ofAir and Stream Improvement (NCASI) will not divulge the data upon which they are based.9
To test whether the industry emission factors for HAPs are valid, we compared the industryemission factor for hydrochloric acid, a HAP emitted in large quantities by biomass burning, withactual emissions data from 46 operating plants. We found that the industry factor significantlyunderestimates HCl emissions from real plants, suggesting that biomass power plants that useindustry emission factors to claim minor source status for emissions of air toxics should probably inmany cases be regulated as major sources.The fix: The EPA and the states should require that HAPs emissions are estimated at thepermitting stage based on emissions factors that are transparently derived, with a generous marginfor error that assumes emissions are likely to spike at the very times (such as startup and shutdown)when they are least likely to be measured. Most facilities are probably major sources for HAPs, andshould be regulated as such.Loophole 6: Weak testing requirements mean air toxics limits aren’t enforceableWe found that the lack of accountability for plants claiming to be “synthetic” minor sources forHAPs continues once plants are operating, because many permits only require minimal testing forhazardous air pollutants. Because emissions testing and enforceable limits don’t even come intoeffect until several months after a facility starts operating, people living in the vicinity of a plantmay have to undergo months of excessive and unknown pollution emissions while the facility rampsup. According to EPA, a permit that lacks testing requirements for HAPs is unenforceable, andthus invalid, but EPA has failed to exercise oversight over state-issued permits that claim areasource status for HAPs.The fix: A recent decision by EPA on a bioenergy facility in Hawaii makes it clear that if a facilitywants to be regulated as a synthetic minor source (for criteria pollutants or HAPs) it must conducttesting that represents its true emissions, including during startup and shutdown. The permit mustbe written to require such testing, otherwise it is not federally enforceable, and is thus invalid. Forlimits to be truly enforceable, there should be ongoing monitoring with results revealed in realtime, so that states and citizens can know when and if a facility is violating its permit.Loophole 7: EPA rules blur the line between biomass facilities and incineratorsLax regulation of biomass burners compared to waste incinerators is especially significant becausenew EPA rules make it easier to burn contaminated materials in biomass burners. EPA’s “waste”rule allows garbage and other waste materials including plastics, tires and other wastes to be burnedwith minimal emissions controls and with no obligation to report emissions of heavy metals andother air toxics. The EPA admits that the new rules mean that wastes that are just as contaminatedas the dirtiest coals available can be burned as biomass with no special provisions or disclosure.EPA has also announced that it is likely to remove any requirement that construction anddemolition debris, which includes wood treated with copper-chromium-arsenate preservatives, betested for contamination, trusting that industry “sorting” procedures will effectively removecontaminated material before it is burned as fuel. Since biomass plants do not have to meet any10
actual emissions standards for heavy metals, dioxins, or carcinogenic organic HAPs like benzeneand formaldehyde, EPA’s deregulation of contaminated fuels means that many facilities will be ableto burn these materials with no accountability. Indeed, a large proportion of permits in ourdatabase granted permission for biomass plants to burn “waste” wood and other materials as fuel.Under the waste rule, the EPA has also been granting “comfort letters” to companies that processgarbage and industrial wastes into fuel products. Once EPA has signed off on these materials as“non-hazardous,” they can be burned in a variety of boilers, even area source biomass boilers thatare minimally regulated. An example is provided by SpecFUEL fuel cubes made by WasteManagement. Contamination data on these cubes reveal high levels of fluorine, as well asphthalates, a chemical implicated in altering reproductive function that will soon be banned in theEuropean Union. EPA approved SpecFUEL as a non-hazardous fuel product, enabling it to beburned in biomass plants that have no emission limits on air toxics.The fix: The EPA needs to put people first – not the bioenergy industry, which has aninexhaustible appetite for contaminated fuels, particularly those that generate “tipping fees” fortheir disposal. The EPA should ensure that it does not create a loophole for unregulatedincineration and that it protects public health by ensuring that all waste burners – including thosethat label themselves biomass units – meet the protective standards that Congress enacted for wasteburning.Overall, our assessment of the state of air permitting in the biomass power industry found that evenas facilities routinely sell host communities on the idea a biomass plant is “clean” and safe, theyappear to be misrepresenting actual emissions, while avoiding using the best pollution controls andperforming air quality modeling. Our review found that EPA’s rollback of regulation on biomasspower combined with the loopholes inherent in the Clean Air Act leave communities unprotectedfrom this growing and increasingly polluting industry.Every permit we examined, even those that went through PSD, takes advantage of at least some ofthe Clean Air Act and regulatory loopholes we describe. From the 88 permits we included in themain analysis, the report provides detailed information on the following facilities:Sierra Pacific, Anderson, CADTE Stockton, Stockton, CAPlainfield Renewable Energy, Plainfield, CTMontville Power, Uncasville, CTGainesville Renewable Energy, Gainesville, FLGreen Energy Partners, Lithonia, GANorth Star Jefferson, Wadley, GAPiedmont Green Power, Barnesville, GAHu Honua, Pepe’ekeo, HIecoPower, Hazard, KY11
Verso Bucksport, Bucksport, MEBurgess Biopower, Berlin, NHLyonsdale Biomass, Lyons Falls, NYReEnergy Black River, Fort Drum, NYBiogreen Sustainable Energy, La Pine, OREvergreen Community Power/United Corrstack, Reading, PANacogdoches Power, Sacul, TXEDF Allendale, Allendale, SCDominion Energy, Southampton, Altavista, and Hopewell, VANippon Paper, Port Angeles, WAPort Townsend Paper Company, Port Townsend, WA12
Introduction: Biomass power, the renewable energy that pollutesThe biomass energy industry has always been highly polluting, as many communities wherefacilities are located can attest. Inherently high-emitting and poorly regulated, the industry’s trackrecord was revealed by a 2012 Wall Street Journal article reporting that nearly 80% of the facilitiesinvestigated by the paper had been cited by state or federal regulators for violating air pollution orwater pollution standards at some time in the last five years. 1 Despite this history, however,biomass energy receives multiple renewable energy tax credits and subsidies. The availability ofthese incentives, which are worth millions of dollars per year to an individual facility, has driven asurge in biomass power plant proposals around the country (Figure 1), with more than 70 utilityscalewood-burning power facilities built or underway since 2005, and another 75 proposed and invarious stages of development. 2 Some of these are new power plants, and some are old coal-firedpower plants that are being re-fired with biomass, such as Dominion Energy’s three 51 MWcoal plants in Virginia, the Altavista, Hopewell, and Southampton facilities, whichDominion has rescued from mothballs to convert into “renewable energy generating assets.” 3Figure 1. The biomass power industry is growing rapidly11,00010,50010,000Biopower capacity (MW)9,5009,0008,5008,0007,5007,0002006 2008 2010 2012 <strong>2014</strong> 2016Figure 1. Actual and projected growth in the biopower industry from 2008 (built capacity for the 2008 industryfrom Energy Information Administration; 4 built capacity and proposed capacity from 2008 onwards from Forisk,Wood Bioenergy US database, December 2013). Not all proposed facilities will be built.Building a biomass plant and generating electricity by burning wood is costly. According to theEPA, the levelized cost of generating electricity from biomass in 2011 dollars per megawatt-hour is$97 - $130, whereas the cost of onshore wind is $70 - $97 and the cost of natural gas combined1Justin Schenk and Ianthe Dugan. Wood-fired plants generate violations. Wall Street Journal, July 23, 2012.2Forisk, Wood Bioenergy US database, December, 20133 Our report and letter to the Securities and Exchange Commission on bioenergy “greenwashing” by Dominion, SouthernCompany, and Covanta can be found at http://www.pfpi.net/investors-to-sec-please-scrutinize-bioenergy-claims4Energy Information Administration. Existing generating units in the United States by State, Company, and Plant, as ofDecember 31, 2008.13
cycle technologies is $59 - $86, depending on the cost of gas. 5 Recently built and proposedbiomass power plants provide examples of the costliness of biopower – for instance, the SouthernCompany’s 116 MW (gross) Nacogdoches plant in Sacul, Texas, the sister facility to theequally large Gainesville Renewable Energy Center in Florida, raised rates for AustinPower customers, and only operated for a few months before being paid to idle, as the utility wasable to purchase cheaper power from wind and natural gas sources. The Gainesville plant raisedrates for its regional customers, as well. In Kentucky, testimony from state hearings on therenewable power purchase agreement between Kentucky Power and the proposed 58 MW (net)ecoPower biomass plant in Hazard indicates that electricity from the plant would raise theaverage residential electricity bill almost $125 per year in one of the poorest regions of the country,eastern Kentucky. 6Additional costs for renewable poweraren’t necessarily unusual, but in the caseof biomass power, developers andproponents justify extra expense byclaiming that biomass power providesWhile a single biomass plants can emit overa million tons of carbon dioxide a year,facilities aren’t ever required to demonstratethese emissions are offset.“clean” and “low carbon” baseload power, as if bioenergy were comparable to wind and solar. Thatsuch claims are misleading is increasingly apparent. Of late, the myth of bioenergy as “climatefriendly”is increasingly crumbling as new science and modeling demonstrate that wood-firedpower plants increase CO 2 emissions over years to decades, even relative to fossil-fueled powerplants. 7 The sheer amount of wood required by these facilities is an indication of their emissions, asforest wood is converted to CO 2 at about a 1:1 rate. 8 For instance, combined demand at the threeconverted Dominion coal plants will be about 2.4 million tons per year, with commensurateCO 2 emissions, and a single facility like the 116 MW Gainesville Renewable Energy plant inFlorida can emit over a million tons of CO 2 per year. The air permit for the 70 MW (gross)Burgess BioPower plant in Berlin, New Hampshire states it will burn close to a milliontons of trees a year, consuming “whole logs” at a rate of 113 tons per hour, 9 the equivalent of clearcuttingmore than one acre of New Hampshire’s forests every hour. While resequestration of theCO 2 emitted by this and other biomass plants being built around the country will require multipledecades, carbon offsets are never actually required to be obtained or demonstrated by these plants.When policy-makers are given a chance to review the forest and greenhouse gas impacts frombiomass energy, they may conclude that it is not worth the costs. For instance, the Vermont PublicService Board recently denied a certificate of “public good” to the proposed 35 MW North540 CFR Parts 60, 70, 71, et al. Standards of Performance for Greenhouse Gas Emissions From New Stationary Sources:Electric Utility Generating Units; Proposed Rule. Federal Register Vol. 79, No. 5 Wednesday, January 8, <strong>2014</strong>6Commonwealth of Kentucky, before the Public Service Commission: Application of Kentucky Power concerning the renewableenergy purchase agreement with ecoPower Generation-Hazard, LLC. Case No. 2013-00144. Volume I of court transcript.7For a review, see <strong>PFPI</strong> report to the Securities and Exchange Commission on bioenergy “greenwashing,” athttp://www.pfpi.net/wp-content/uploads/2013/11/<strong>PFPI</strong>-report-to-SEC-on-bioenergy-Nov-20-2013.pdf8 Burning one ton of wood at 45% moisture content, considered an industry standard, emits 1.008 tons of CO 2 .9New Hampshire Department of Environmental Services. Final Temporary/NSR/PSD Air permit for Laidlaw Berlin BioPower,July 26, 2010.14
Springfield Sustainable Energy wood burning plant in Vermont, stating that the projectwould interfere with the State’s ability to meet statutory goals for reducing greenhouse gases andthat “the evidentiary record supports a finding that the Project would release as much as 448,714 tons of CO2eper year, and that sequestration of those greenhouse gases would not occur until future years, possibly not fordecades, and would not occur at all in the case of forest-regeneration failures.” 10 In Massachusetts, newrules eliminate state renewable energy subsidies for low-efficiency utility-scale biomass plants,because their excessive and long-lasting net CO 2 emissions interfere with the state’s goals ofreducing CO 2 emissions from the power sector. 11With the recent intense focus on greenhousegas emissions from the bioenergy industry,however, less attention has been paid toemissions of conventional air pollutants andMajor loopholes in the Clean Air Act and itsenforcement let biomass power plants emitmore pollution than coal.impacts on air quality. As for claims of carbon neutrality, which often rely on simply not countingCO 2 emissions from biomass power plants, claims that bioenergy is “clean” are usually notsupportable. In fact, even bioenergy facilities employing modern controls like those used at coalplants are disproportionately polluting, primarily because burning wood is inherently polluting andbiomass plants are very inefficient, extracting relatively little “useful” energy for the pollution theyemit. However, also important to bioenergy pollution impacts is the fact that the preeminent lawfor protecting air quality in the United States, the Clean Air Act, contains major loopholes allowingbiomass power plants to pollute more than fossil-fueled facilities. Compounding this, a pattern oflax enforcement and rollbacks on regulation by EPA and the states has widened these loopholes.We wanted to develop a picture of the modern biomass power industry, how it is shaped byregulation, and how it is shaping regulation. To explore these questions, we collected recentlyissued air permits from biomass power plants, tabulating data on pollution controls, fuel use,permitted emissions, and other factors. We focused on recent permits because we assumed theywould restrict pollution emissions to lower levels than typical for the bioenergy industry as awhole, which has traditionally been very polluting. Our analysis ultimately included 88 permits,which, when analyzed as a group, revealed systematic patterns that would not be apparent ifpermits were analyzed individually. What emerges from our analysis is a picture of an industry thatdespite loudly and continually proclaiming itself clean and green, is in many respects still one of thedirtiest corners of the energy industry, an industry where avoidance of pollution restrictions istolerated, and even encouraged, by state and federal regulators. This report explains our findings.10State of Vermont Public Service Board. Docket No. 7833 Petition of North Springfield Sustainable Energy Project LLC, foritself and as agent for Winstanley Enterprises, LLC, for a certificate of public good, pursuant to 30 V.S.A. Section 248,authorizing the installation and operation of a 25-35 MW wood-fired biomass electric generating facility to be located in theNorth Springfield Industrial Park in Springfield, Vermont, to be known as the "North Springfield Sustainable Energy Project"Order entered: 2/11/<strong>2014</strong>. Available at http://www.pfpi.net/wp-content/uploads/<strong>2014</strong>/02/7833-VT-PSB-on-NSSEP.pdf11 State of Massachusetts 225 CMR 14.00 – Renewable Energy Portfolio Standard, Class I. A summary of the regulations isavailable at http://www.mass.gov/eea/energy-utilities-clean-tech/renewable-energy/biomass/renewable-portfolio-standardbiomass-policy.html.15
The physical reasons why bioenergy pollutes more than coalAny power plant that burns fuel will emit numerous air pollutants, but there are two key factorsthat make biomass power plants emit as much or more pollution than modern coal or gas-firedpower plants. First is the inherent composition of biomass fuels, including their chemical makeupand their energy content. Taking carbon as a main example, biomass power plants emit more CO 2than fossil fueled plants (Table 1) because wood and other types of biomass are carbon-rich, but notparticularly energy-rich, particularly relative to natural gas. This means that burning biomassreleases more CO 2 per unit energy inherent in the fuel (pounds of CO 2 released per million Btuenergy content, lb/MMBtu) than fossil fuels. Just as important, however, is that biomass powerplants are much less efficient than gas and coal-fueled plants, in part because biomass fuels tend tohave relatively high moisture content, 12 and it takes significant energy to boil off excess waterbefore “useful” energy can be generated. Lower efficiency means that more fuel is required togenerate a given amount of electrical energy from a biomass power plant, and burning more fuelreleases more pollution.Table 1. Biomass power plants emit more CO 2 than coal or gas plantsTechnologyFuel CO 2 emissions(lb/MMBtu heat input)FacilityefficiencyMMBtu required toproduce one MWhLb CO 2 emittedper MWhGas combined cycle 117.1 45% 7.54 883Gas steam turbine 117.1 33% 10.40 1,218Coal steam turbine 206 34% 10.15 2,086Biomass steam turbine 213 24% 14.22 3,029Table 1: CO 2 emissions from biomass power plants versus fossil-fuel power plants. 13 The relatively low inherentenergy density of biomass fuels, combined with the low efficiency of bioenergy plants, mean that per megawatthour(MWh), a biomass power plant emits about 145% the CO 2 of a coal plant, and 340% the CO 2 of a combinedcycle natural gas plant.The low efficiency of biopower plants increases their relative conventional pollutant emissions, aswell. 14 To illustrate this, Table 2 gives an example of filterable particulate matter 15 emissions froma 500 MMBtu/hr coal boiler, and a biomass boiler of the same size, both with a permitted12 Typical moisture content for green wood chips, a very common fuel for bioenergy facilities, is around 45%, meaning byweight, the fuel is almost one-half water.13Fuel CO 2 per heat content data are from EIA, Electric Power Annual, 2009: Carbon Dioxide Uncontrolled Emission Factors.Efficiency for fossil fuel facilities calculated using EIA heat rate data (http://www.eia.gov/cneaf/electricity/epa/epat5p4.html);biomass efficiency value is common average value for utility-scale facilities; however, the smaller the facility, the lower theefficiency.14This fact is often obscured because emissions of conventional pollutants are often expressed on a “heat input” basis (pounds ofpollutant per million Btu of heat input to the boiler, lb/MMBtu), rather than on an “output” basis, as is done for CO 2 (pounds ofCO 2 per megawatt-hour, lb/MWh). One important exception is emission rates set for coal plants greater than 25 MW in size,which (as discussed below) are regulated under EPA’s “Electric Generating Unit” (EGU) rules with rates that are set on a poundsper megawatt-hour basis.15Filterable particulate matter is the portion of particulate matter that can be largely (but not completely) controlled by a fabricfilter or an electrostatic precipitator.16
Pounds pollution/MWhemissions level of 0.012 lb/MMBtu, 16 a common value seen in many biomass facility air permits.Both facilities would emit 26 tons of particulate matter per year, calculated on a heat input basis,but because the biomass plant doesn’t produce as much energy as the coal plant, it emits 41.6%more particulate matter on an electrical output basis, expressed as pounds of pollution permegawatt-hour (MWh) of energy.Table 2: Biomass power’s lower efficiency increases particulate matter emissionsFuelBoiler size(MMBtu/hr)EfficiencyMMBtu heatinput/yrPM rate(lb/MMBtu)Table 2: The lower efficiency of biomass power plants increases their emissions per megawatt-hour.The inherently polluting nature of bioenergy affects how air permits are written, and how muchpollution a biomass plant is allowed to emit. Figure 2 shows allowable emissions on an output basis(lb/MWh) from three air permits, a coal plant, a biomass plant, and a natural gas plant.TonsPM/yrMWh/yrlb PM/MWhBiomass 500 24% 4,380,000 0.012 26 307,999 0.17Coal 500 33% 4,380,000 0.012 26 423,498 0.121.80Figure 2: Even with modern emissions controls, biomass power plantsemit more pollution than coal or gas1.601.40COAL: Santee Cooper Pee Dee Generating Station, SCBIOMASS: Gainesville Renewable Energy, FL1.20GAS: Pioneer Valley Energy Center, MA1.000.800.600.400.20-Carbon monoxide Nitrogen oxides Filterable PM10 Sulfur dioxide VOCsFigure 2. Allowable emission rates (in pounds per megawatt-hour) from three recently issued permits. 1716Lb/MMBtu = pounds of pollution emitted per unit boiler capacity in million Btu per hour17South Carolina Bureau of Air Quality. December 16, 2008. PSD, NSPS (40CFR60), NESHAP (40CFR63) ConstructionPermit for Santee Cooper Pee Dee Generating Station (1,320 MW, coal). Florida Department of Environmental Protection.December 28, 2010. Final air construction permit for Gainesville Renewable Energy Center (100 MW, biomass). MassachusettsDepartment of Environmental Protection. June, 2010. Conditional permit to construct issued to Pioneer Valley Energy Center(431 MW, gas).17
All three facilities went through a BestAvailable Control Technology analysis (BACT,described further below), meaning that theiremissions are relatively well-controlledcompared to other facilities of their type.However, emissions from the biomass plantEven when a biomass plant is using bestavailable control technology, emissions ofkey pollutants exceed those of moderncoal and gas plants.exceed those from the fossil fueled plants for all pollutants except sulfur dioxide, for which biomassemissions exceed gas, but not coal. Relative to the coal plant and the gas plant, respectively,allowable emissions at the biomass plant are126% and 5639% for carbon monoxide; 157% and2015% for nitrogen oxides; 197% and 863% for filterable PM 10 ; 38% and 3514% for sulfurdioxide; and 655% and 1535% for volatile organic compounds. 18How the Clean Air Act regulates pollution from power plantsThe Clean Air Act is the main federal law regulating emissions from power plants and otherstationary source facilities. While the Clean Air Act can regulate any pollutant, the main pollutantsit governs are the so-called “criteria” pollutants (particulate matter, carbon monoxide, nitrogenoxides, sulfur dioxide, ozone, and lead); hazardous air pollutants (HAPs), the group of 187+pollutants that are considered especially toxic by EPA; and greenhouse gases, including CO 2 .A key regulatory tool in the Clean Air Act is the New Source Review (NSR) process, whichrequires new or modified stationary sources like power plants to obtain a preconstruction permitthat sets allowable pollution emission rates and other conditions of operation. 19 The restrictivenessof these permits varies, based on how much pollution a facility is anticipated to emit (larger sourcesare regulated more tightly than smaller sources) and the existing air quality in the area (facilitieslocated where air pollution already exceeds EPA’s health standards are more tightly regulated).Preconstruction permits can be issued according to one of three permitting subprograms underNew Source Review:The “Prevention of Significant Deterioration” (PSD) program applies to facilities of a certainsize located in areas that meet the National Ambient Air Quality Standards (NAAQS), thehealth standards that EPA sets for the criteria air pollutants PM, CO, NO x , SO 2 , ozone, andlead. While state air permitting agencies write these permits, they must do so inaccordance with EPA regulations, and EPA and the public may provide comments and inputon certain permits.18A potential but currently suspended permit revision filed in February <strong>2014</strong> seeks to regulate the facility under the major sourceboiler rule. If the plant is re-permitted as a major source for HAPs, allowable filterable PM emissions will decrease under themajor source MACT for bubbling fluidized bed boilers, from of 0.015 lb/MMBtu to 0.0098 lb/MMBtu (Gainesville RenewableEnergy Center. Initial Title V air operation permit application filed with Florida Department of Environmental Protection.February 10, <strong>2014</strong>). This change would reduce permitted emissions from 89 tons to 58 tons of filterable PM per year, butfilterable PM emissions per MWh would still be 128% those from the coal plant.19New source review permits are “preconstruction permits,” and differ from Title V permits, which set out the terms by whichfacilities are expected to operate and meet the emissions limits specified in the NSR permit.18
The “Nonattainment New Source Review” (NNSR) program applies in areas wherepollution exceeds the NAAQS. Permits issued under this program may also receive EPAand public review like the PSD permits above.The “Minor Source” program applies to facilities that are anticipated to not emit enoughpollution to be included under the PSD or NNSR programs. Unlike PSD and NNSRpermits, minor source permits are expected to meet certain minimal Clean Air Actrequirements but are otherwise solely administered by local or state-level air permittingagencies with little if any EPA or public oversight.As we demonstrate below, facilities that go through the PSD and NNSR process tend to have muchlower allowable emissions than minor source facilities that simply get a permit from the state. 20The difference can mean biomass power plants that receive state-issued minor source permits areallowed to emit far more pollution than they would be otherwise if they were held to morerigorous standards. This permitting scheme clearly incentivizes bioenergy facilities to seek “minorsource” status in order to avoid more stringent limits.The commonsense components of a federal air permitWhile permits issued under the PSD or NNSR program may sound like they could be quiterigorous, in fact, the requirements of the programs are merely commonsense, including measuresto reduce pollution as by using effective emission controls and operating the plant properly, airquality simulation modeling to make sure that a facility’s emissions won’t increase air pollutionabove EPA’s health thresholds, and provisions to allow citizen involvement and ensureenvironmental damage is minimized.BACT Analysis. Under the PSD program, major sources undergo a Best Available ControlTechnology (BACT) analysis to determine the most effective emissions controls for eachpollutant. 21 If a new facility exceeds the threshold for one pollutant, then it required to gothrough a BACT analysis for all criteria pollutants that exceed a specified emissionsthreshold. The BACT analysis doesn’t truly require the “best” control technology,however, because a facility can reject technologies as being too expensive. Nonetheless,facilities that go through BACT analyses tend to have lower allowable emissions thanfacilities that don’t. BACT is a moving target, because as permits are written with loweremission rates, achievable via better and improved controls, these rates in turn become thenew BACT standard for subsequent facilities.Under the NNSR program, when a power plant is being built in a location that already hasan acknowledged air quality problem, known as a “non-attainment” region, facilities are20Certain states have strong air permitting requirements that meet and even exceed what would be required under the PSDprocess. For instance, both Massachusetts and Vermont have fairly rigorous state-level air permitting requirements.21 In a BACT analysis, the applicant and state must consider, among other things, clean fuels and environmental impacts of thesource permit issuing authorities must consider “alternatives” to the proposed project in addition to a proposed project’s airquality and other environmental impacts. BACT permitting does allow cost considerations. LAER does not.19
supposed to use the technology that delivers the Lowest Achievable Emission Rate (LAER).Unlike BACT, a LAER analysis is not supposed to consider technology cost. Facilities beingbuilt in non-attainment regions are also required to obtain emission offsets for pollutantsthat exceed the NAAQS.Air Quality Modeling. Under PSD, major source facilities have to undergo air qualitymodeling, in which a computer model is used to simulate dispersion of pollution from afacility, adding the facility’s emissions to background air pollution levels to ascertain howmuch the plant will increase local air pollution. Emissions from nearby facilities are alsoincluded in this analysis. The modeling usually assesses two emission rates for eachpollutant – a “long term” average rate (often calculated over 30 days) to determine whethera facility will cause local air pollution to exceed the annual NAAQS, and a short-termemission rate (the concentration over a one- or three-hour period), to determine whether aplant will cause an exceedance of the short term/hourly NAAQS. 22Regulation of PM 2.5 . The PSD program requires permit applicants to model howemissions of both filterable PM and condensable PM will affect ambient PM 2.5 levels. Incontrast, plants that don’t go though PSD are typically only held to the New SourcePerformance Standard (NSPS) for PM emissions, which simply requires that filterable PM 10emissions not exceed 0.03 lb/MMBtu, or even less stringent standards for existingfacilities. The NSPS standards do not apply during facility startup and shutdown.Public Involvement. An important aspect of the PSD process is that the state agencyissuing the air permit is required to hold public informational meetings about the facility’simpacts, not only on air quality, but on other aspects of the environment as well. Thepermit-issuing authority is required to consider comments submitted during the permitapprovalprocess, which may include arguments that the facility is not needed at all. Incontrast, minor sources that don’t go through the PSD process simply get a state-issuedpermit and there is no requirement for public involvement.EPA Oversight. While EPA will sometimes review and comment on PSD permits, helpingto improve them, the Agency generally ignores state-issued minor source permits, unlessasked to intervene. However, all permits, whether PSD permits or minor source permitsissued by the state, are supposed to comply with federal New Source PerformanceStandards (NSPS), maximum emissions rates set for certain pollutants, and the NationalEmission Standards for Hazardous Air Pollutants (NESHAP), discussed below. All permitsmust be “federally enforceable” to be valid.22Short term standards are generally designed to protect against acute effects of exposure, while longer-term standards aredesigned to protect against health effects that can result from cumulative, long-term exposure to even lower levels of pollution.Some pollutants have both annual and short-term standards, because they can be both acutely and chronically harmful at differentlevels. Health-based (or “primary”) NAAQS tend to be based on health effects identified in both laboratory and epidemiologicalstudies, and are subject to several rounds of review (including by the Clean Air Science Advisory Committee, comprised ofleading scientists in the field).20
Going through a BACT or LAER analysis, along with air quality modeling, does not ensure that afacility will not degrade air quality. In most cases, pollution emissions from federally permittedfacilities are still large, and often, the provisions of an air permitting program do relatively little toreduce emissions. For instance, the 54 MW (gross) DTE Stockton biomass plant inStockton, California, is an old coal plant that has been refurbished to burn biomass. As a coalplant, this facility stopped operation in 2009. It is located in a highly polluted area, designated asbeing in “extreme” non-attainment for ozone (making the major source threshold that triggers PSDpermitting 25 tons, rather than 250 tons) and non-attainment for PM 2.5 . 23 Emissions from the newDTE biomass boiler triggered offset requirements for emissions of NOx, SOx, PM 10 , and VOCs,but rather than being compelled to obtain new offsets, the facility was allowed to treat the cessation(in 2009) of previous allowable emissions from the coal plant as mostly “offsetting” biopoweremissions of 107 tons of NOx, 58 tons of PM 10 , 70 tons of SO 2 , and 25 tons of VOCs – “mostly,”because while the plant’s emissions of SO 2 decreased with the transition to biomass from coal,emissions of PM and VOCs increased. 24 Offsets math notwithstanding, this biomass power plantthus represents what is essentially a new source of pollution in an already polluted region, one that ischeerfully announced by the company in a press release as a “green energy plant.” 25What 88 air permits say about regulation of the biomass power industryDue to the subsidies and tax incentives available for bioenergy, a large number of air permits forbiomass power plants have been issued in recent years. We collected 88 preconstruction and TitleV permits 26 from biomass power plants proposed in recent years and entered key data into acommon database, assembling information on each facility’s boiler technology, fuel use, pollutioncontrol technologies, and allowable emissions. Using this dataset, we were able to examine howmuch pollution facilities are being allowed to emit under PSD/NNSR permits versus state-levelminor source permits, and how the biomass power industry is exploiting loopholes in the Clean AirAct and its enforcement.We used a subset of 46 permits for new facilities to graphically compare how modern bioenergyfacilities propose to control emissions, and how allowable emissions differ at “major” and “minor”source facilities. This subset included the permits we had for “greenfield” facilities that had clearlyeither gone through PSD permitting with a BACT analysis, or which had received minor sourcepermits. The subset excluded facilities where an old coal plant is being retooled to burn biomass,where in some cases, an existing permit was modified but contains relic provisions from when theplant burned coal. As new facilities, the PSD and non-PSD groups can be assumed to have hadequivalent opportunities to optimize facility design and adopt modern pollution controls.23EPA listings for county attainment status are at http://www.epa.gov/airquality/greenbook/ancl3.html24San Joaquin Valley Air Pollution Control District. Authority to Construct Application Review, Biomass-Fired Power Plant –for DTE Stockton, LLC. <strong>April</strong> 28, 2011. The offsets calculations occur in Table 18.25 The company’s March 13, <strong>2014</strong> press release is available at online.wsj.com/article/PR-CO-<strong>2014</strong>0313-912116.html26Some permits are for facilities that have subsequently been cancelled; some are for facilities still pending; some are for facilitiesthat have been built.21
Bioenergy emissions of criteria pollutants and CO 2 : Clean Air ActloopholesBeyond the inherently polluting nature of biomass power, key loopholes in the Clean Air Act allowbiomass plants to be less regulated than coal and gas plants. Some of these loopholes are baked into the Clean Air Act, while others are the result of recent regulatory and policy decisions by EPA.Our overview first examines loopholes affecting emissions of criteria pollutants; in the second partof the report, we discuss loopholes for emissions of hazardous air pollutants (HAPs) and loopholesthat allow contaminated wastes to be reclassified as “non-waste fuel products” that can be burned inbiomass plants.Loophole 1: Biomass plants can emit more pollution before triggering federalpermittingOne of the most significant loopholes for bioenergy in the Clean Air Act is the triggering thresholdfor consideration as a “major source” for criteria pollutants. Whereas new fossil fuel plants areconsidered to be a major source that triggers PSD permitting if they emit more than 100 tons of acriteria pollutant per year, bioenergy plants escape PSD unless they emit at least 250 tons of acriteria pollutant per year. 27 As we demonstratebelow, biomass plants that avoid PSDpermitting are allowed to emit about twice asmuch pollution as plants that go through PSD,and lack other protections afforded by the PSDprogram. Compared to coal plants and naturalUnder the Clean Air Act, biomasspower plants are allowed to emit 250%the pollution of a coal plant before moreprotective permitting is triggered.gas plants that are required to go through PSD if they emit 100 tons of a pollutant, biomass powerplants that avoid PSD are very lightly regulated, even though the types of pollution emitted, andconsequent health effects, are the same. As all but five of the 88 facilities for which we havepermits in our database would emit more than 100 tons of a criteria pollutant, it appears that thissingle loophole, which is a relic of Clean Air Act implementation decisions made in the 1970’s, isresponsible for nearly doubling the amount of pollution that the emerging bioenergy industry isallowed to emit. The Clean Air Act allows the EPA Administrator to add new industries to the listof sources where the 100 ton threshold triggers PSD permitting. Given the current growth in thebioenergy industry and its potential to pollute, adding biomass power plants to that list wouldrepresent sound public policy.Loophole 2: EPA’s free pass for bioenergy CO 2 lets large power plants avoidregulationThe tendency for bioenergy facilities to avoid PSD permitting has been exacerbated and enabled byEPA’s decision to exempt bioenergy CO 2 from regulation under the Clean Air Act. Initially, when27 PSD is also triggered for both new plants and existing plants undergoing “major modifications,” when those modificationswould cause emissions to increase by more than a certain amount. The triggering thresholds for existing facilities are the samefor biomass and fossil-fueled plants.22
EPA began regulating CO 2 under the Tailoring Rule in early 2011, 28 bioenergy facilities wereincluded under the rule along with fossil-fueled plants. At that time, if a wood-burning powerplant was a major source for CO 2 (emitting over 100,000 tons of CO 2 per year), and it was a majorsource for a criteria pollutant (emitting over 250 tons per year) then PSD permitting was triggered,and the facility would go through a BACTanalysis for CO 2 , as well as for otherpollutants. However, in July of 2011,when “Step II” of the Tailoring Rule wasimplemented and facilities could be deemedEPA’s exemption for bioenergy CO 2 underthe Clean Air Act has allowed many facilitiesto avoid requirements for more protectiveemissions controls.major sources for PSD on the basis of their CO 2 emissions alone, 29 EPA bowed to pressure fromthe bioenergy industry and exempted bioenergy facilities from the rule for a period of three years,pending study of how biogenic CO 2 emissions should be regulated. It is important to note thatalthough the EPA exemption of bioenergy CO 2 from counting toward PSD applicability wasgenerally based on the assumption that greenhouse gas emissions would be offset, not one of thepermits we reviewed for this report actually required demonstration that emissions be offset.Biomass power companies are applying for airpermits at an unprecedented rate, thus theexemption of biogenic CO 2 from regulationprevented pollution restrictions from beingplaced on the industry just when it mostneeded oversight. Nearly every plantproposed in recent years is a major source forCO 2 , because almost all are larger than 8 MW,which is the size of plant with a potential toemit (PTE) 30 more than 100,000 tons of CO 2 .Burning one ton of green wood chips emitsabout one ton of CO 2 , thus CO 2 emissionsfrom fuel burned at a typical plant, such as the49 MW plant in Figure 3, are many hundreds Figure 3. The massive woodchip fuel pile at a 49-MWof thousands of tons per year, far exceeding the bioenergy plant in California. (Photo credit: NREL)major source threshold. Thus, had EPA notgranted the exemption, most biomass power plants would be pulled into the PSD permittingprogram on the basis of their CO 2 emissions alone, and would go through a BACT analysis for both28The Tailoring Rule set emission thresholds that trigger a facility being considered a major source for greenhouse gases. Becausegreenhouse gases are emitted in far larger quantities than criteria pollutants, the 250 ton threshold that applies for criteriapollutants was not a practical limit, thus, the triggering thresholds were “tailored” to adapt the regulations for greenhouse gasemissions. See http://www.epa.gov/nsr/ghgpermitting.html29Under the Step II regulations, CO 2 received the same treatment as other pollutants – if a facility was “major for one,” in thiscase CO 2 , it would be “major for all,” triggering a BACT analysis for all pollutants.30“Potential to emit means the maximum capacity of a stationary source to emit a pollutant under its physical and operationaldesign. Any physical or operational limitation on the capacity of the source to emit a pollutant, including air pollution controlequipment and restrictions on hours of operation or on the type or amount of material combusted, stored, or processed, shall betreated as part of its design if the limitation or the effect it would have on emissions is federally enforceable.” 40 C.F.R. § 52.21(b)(4).23
CO 2 and conventional air pollutants, as well as undergoing air quality impacts modeling.Importantly, the group of bioenergy facilities thus affected would include not only the facilities thatreceived preconstruction permits after July 1, 2011, when Step II of the Tailoring Rule came intoeffect, but also those facilities that had previously received a permit but had not yet startedconstruction by July 1. The CO 2 exemption has thus allowed most facilities with permits issued inrecent years to avoid PSD permitting. No coincidence, a flurry of state-level permits were issuedjust before the July 1 2011 deadline when Step II permitting was to take effect, even though EPAhad indicated it would grant the exemption. Of the permits we reviewed that were issued in 2011,14 were issued before July 1, with 8 of those issued in June. A total of 6 were issued after June.Following EPA’s exemption for bioenergyCO 2 , the Center for Biological Diversity withother environmental groups sued the Agency,challenging the action. In July 2013, the U.S.Court of Appeals for the District of ColumbiaA federal court found that EPA’sexemption for biomass CO 2 was unlawful,and that bioenergy emissions shouldcount under Clean Air Act permittingCircuit ruled in favor of the groups, determining that EPA had unlawfully exempted bioenergyfrom regulation under the Clean Air Act. 31 However, rather than issuing a mandate to EPA toreverse the exemption, the court granted a long delay to the industry litigants that had joined withEPA to defend the exemption, extending the deadline for filing a petition for reconsideration orrehearing by all of the Court’s active judges. 32 The three-year exemption in any case lapses in July<strong>2014</strong>, at which point EPA will need to take some action on how biogenic CO 2 will be regulated. Inthe meantime, it is unclear whether the court will issue a mandate that directs EPA to reverse itspolicy and officially declare that facilities that are major sources for CO 2 need to go through PSD,although in any case EPA could take action without waiting for the court’s mandate. When and ifthis happens, some bioenergy facility permits that were issued under the exemption could be reopenedand re-permitted through the PSD process. Meanwhile, there are about 60 bioenergyfacilities currently planned or under construction in the U.S. 33 that are over 8 MW in capacity, theapproximate threshold for a major source for CO 2 emissions. By allowing these facilities to escapePSD permitting, EPA’s exemption for bioenergy CO 2 regulation allows the bioenergy capacity “inthe pipeline” to be far more polluting than it needs to be.Loophole 3: State regulators help biomass power plants avoid more protectivepermittingBioenergy developers usually want to avoid going through the PSD process, because conducting aBACT analysis and air quality impacts modeling, determining effective pollution controls, anddealing with public involvement can increase the risk that a high-emitting facility will face more31Center for Biological Diversity v. EPA, D.C. Cir. No. 11-1101, July 12, 201332The D.C. Circuit Court essentially refrained from acting while a number of industry challenges to the Tailoring Rule itself areproceeding in the U.S. Supreme Court. Those challenges—which will determine whether the PSD program applies togreenhouse gases as a whole, not just biogenic CO 2 —are being heard by the Supreme Court in February, with a decisionexpected in mid-<strong>2014</strong>.33Forisk, Wood Bioenergy US database, December, 201324
scrutiny and questions. State permitting agencies usually help bioenergy developers avoid PSDpermitting, and “PSD avoidance” is a common phrase encountered in bioenergy air permits.A facility’s status as a major or minor source is determined by its potential to emit (PTE). Thisis the number of tons of a pollutant that the facility will emit if it is operated year-round, at fullboiler capacity. It is calculated asEquation 1To avoid PSD permitting, the biomass industry avails itself of another loophole in the Clean Air Actknown as the “synthetic” minor source provision, whereby if facility caps its emissions below 250tons of each criteria pollutant per year, it can avoid the PSD permitting process and itsrequirements for a BACT analysis, air quality modeling, and public involvement. States routinelyallow and even encourage facilities to avoid PSD permitting by issuing air permits that capemissions just below 250 tons – even, sometimes, when the facility’s potential to emit exceeds 250tons. Such permits frequently include credulity-straining provisions that limit a facility’s emissionsto 249 tons of a pollutant, as we discuss below (see Tables 4 and 5).The 250-ton cap for emissions in a syntheticminor permit is supposed to include all annualemissions from the facility, including startup andshutdown emissions from the boiler andemissions from other sources, such as emergency“Synthetic minor” facilities avoid settingemissions rates, conducting air qualitymodeling, or using best available controltechnology.generators. However, it is rare that a synthetic minor permit does a full accounting of all theemissions at a facility, or includes enforceable limits that can truly constrain facility-wide emissionsonce the plant is operating. As we discuss below, such permits unenforceable and thus illegal underthe Clean Air Act, but because the EPA rarely reviews state-issued permits, federal enforcement israre.For a number of the synthetic minor permits we reviewed, the biomass boilers alone have a PTEthat exceeds 250 tons of a criteria pollutant, given the size of the unit and the ability to controlemissions. This would suggest that the 250-ton-per-year caps, which are required by federal law tobe “federally and practically enforceable,” 34 for instance by limiting the number of hours in a yearthat a facility can operate, are in some (or perhaps many) cases unrealistic. In fact, in our review oftens of biomass power plant permits, very few of the synthetic minor sources we found had anylimits on hours of operation, or any other limitations. Instead, state air permitting agencies simplyrequire facilities to install continuous emissions monitors (CEMs) that track how much pollution isproduced, and to report these emissions, as proof that they are emitting less than 250 tons per yearof each pollutant. The presence of a CEMs has been accepted as sufficient assurance that the caps34 The Clean Air Act requires that “limitations, controls and requirements in operating permits are quantifiable andotherwise enforceable as a practical matter” 60 Fed. Reg. 45049 (August 30, 1995).25
are federally and practically enforceable – even when it is likely that the boiler will have difficultymeeting the 250 ton per year cap, and even though a CEMs on a biomass boiler only measuresemissions from that unit, and not the facility-wide emissions that are supposed to be included underthe cap.The frequent use of the synthetic minor source loophole has important implications for howbiomass power plants operate, and thus for air quality. While the total tons of pollution that aplant emits annually is obviously one index of its impact on air quality, just as important is theshort-term rate at which that pollution is emitted – the actual amount per hour. Permits issuedunder PSD set “short-term” (1 - 3 hrs) and “long-term” emissions limits (often, rolling 30-dayaverages that represent annual emissions). The PSD process also requires modeling before a plant isbuilt to predict whether the plant will cause violations of the short-term and annual NAAQS.Permits that simply cap emissions below 250 tons don’t contain these protective measures.The absence of short-term emission limits insynthetic minor source permits is a threat to airquality. Biomass power plants are notorious forproducing large slugs of air pollution over shortThe absence of short-term emissionsrates in a synthetic minor source permitthreatens air qualityperiods, because the fuels they burn, which include wood, agricultural wastes, and wastes from thepaper-making industry, are inconsistent in composition and moisture content, decreasingcombustion efficiency and increasing emissions. How a plant is operated – at steady state, or in a“cycling” mode, ramping up and down periodically – also affects emissions. Most PSD air permitsand a few state-level permits recognize this, setting different emissions standards for startup andshutdown versus steady-state combustion. For instance, the permit for the proposed 67 MW(gross) Greenville Power plant in Greenville, Texas 35 states that the electrostaticprecipitator for controlling PM, the selective catalytic reduction (SCR) system for controllingNOx, and the catalytic oxidation system for controlling CO and VOCs “may not be fully operational ifthe boiler is operating at less than 75% of base load.” 36 The Greenville permit specifies that emissionrates from the Greenville facility during startup and shutdown 37 (Table 3 ) can exceed those duringnormal operations – for instance, filterable PM emissions increase by more than 700%, comparedto steady-state operation. Startup and shutdown events can take 12 - 24 hours, meaning that thetotal amount of pollution emitted over these periods can be significant.However, synthetic minor permits generally don’t contain limits on startup or shutdown emissionsat all – importantly, the only emissions rate requirement that synthetic minor sources do have tomeet, the New Source Performance Standard for new facilities that sets filterable PM standard at0.03 lb/MMBtu, specifically exempts facilities during startup and shutdown.35Maximum allowable emission rates for Permit Number 9322. Texas Commission on Environmental Quality, December 31,2010.36 Construction permit source analysis and technical review for Greenville Energy, LLC. Texas Commission on EnvironmentalQuality.37Ibid.26
Table 3: Emissions increase significantly during startup/shutdownPollutantNormalEmissions (lb/hr)Maintenance, Startupand Shutdown Emissions(MSS)MSS Emissions as % ofNormal EmissionsNO x 54 54 100%CO 54 96.8 179%VOC 6.1 16.1 264%PM 10 22.1 168.8 764%SO 2 7.9 5.6 71%HCl 1.53 7.65 500%H 2 SO 4 0.2 0.4 200%NH 3 10.7 -- --Table 3. Allowable emission for the Greenville bioenergy facility in Texas. Emissions increase significantly duringnon-steady state operation.The fact that synthetic minor sources aren’t required to do air quality modeling means that theeffect of these short-term surges in pollutant emissions on air quality and health can’t be known.Rather than requiring facilities to control emissions during these periods, permitting agenciessimply rely on facilities to do the right thing to control pollution. For instance, in response to acomment expressing concerns about the absence of controls during startup and shutdown at theproposed 25 MW North Star Jefferson wood-tire burner in Wadley, Georgia, theGeorgia Air Protection Branch staff explained, “During startup and shutdown phases, the control devicesare not able to achieve desired control efficiency due to operational limitations of the systems. The annual PSDAvoidance limits for CO, SO 2 , NOx and GHG include emissions during all periods of operation includingstartup, shutdown and malfunction; thus, there is incentive for facility to begin operation of the control devicesas soon as possible to ensure compliance with the emissions limits.” 38Carbon monoxide (CO) emissions in “synthetic minor” versus PSD permitsAside from carbon dioxide (CO 2 ), carbon monoxide (CO) is the pollutant emitted in greatestquantities by biomass burning. High moisture and variable quality of biomass fuels lead toincomplete combustion, increasing CO emissions above levels typical for fossil fuel-fired facilities.Adding more oxygen to the combustion process can help reduce CO emissions, but doing soincreases formation of “thermal” NOx, making it more difficult to remain within NOx emissionlimits.38Alaa-Eldin A. Afifi, Georgia Environmental Protection Division, Air Protection Branch. Permit narrative for North StarJefferson Renewable Energy Facility, page 32. May 2, 2012.27
Table 4: Biomass power plants with synthetic minor status for carbon monoxidePlant State MMBtu MW Boiler CO control Cap rate CO (tons/yr)Pinal Biomass Power, Maricopa AZ 410 30 Stoker none 0.13 240DTE Stockton, Stockton CA 699 Stoker oxid cat 0.08 248U.S. EcoGen Polk, Fort Meade FL 740 57 FBB none 0.08 246ADAGE, Hamilton Cty FL 834 56 FBB none 0.07 245Green Energy Partners, Lithonia GA 186 10 Stoker none 0.30 249North Star Jefferson, Wadley GA 321 22 FBB none 0.18 249Greenleaf EnvironmentalSolutions, Cumming GA 372 25 FBB none 0.15 250Greenway Renewable Power,LaGrange GA 719 50 none 0.08 249Plant Carl, Carnesville GA 400 25 FBB oxid cat 0.14 249Wiregrass, Valdosta GA 626 45 FBB none 0.09 247Lancaster Energy Partners,Thomaston GA 215 15 Stoker none 0.26 249Lancaster Energy Partners,Macon GA 220 16 Stoker none 0.26 249Fitzgerald Renewable Energy,Fitzgerald GA 808 60 none 0.07 249Piedmont Green Power,Barnesville GA 657 55 Stoker none 0.08 227Hu Honua, Pepe'keo HI 407 22 Stoker none 0.14 246Liberty Green, Scottsberg IN 407 32 FBB none 0.13 225ecoPower, Hazard KY 745 FBB none 0.08 240Menominee Biomass Energy,Menominee MI 493 FBB none 0.11 245Sawyer Electric Co., Gwinn MI 560 FBB none 0.10 245Perryville Renewable Energy,Perryville MO 480 33 FBB none 0.11 225ReEnergy Black River, Fort Drum NY 284 19 Stoker none 0.20 250Biogreen Sustainable Energy, LaPine OR 353 25 none 0.16 247Klamath Bioenergy, Klamath OR 459 FBB none 0.11 230EDF Dorchester, Harleyville SC 275 18 Stoker none 0.20 241EDF Allendale, Allendale SC 275 18 Stoker none 0.21 250Loblolly Green Power, Newberry SC 675 53 Stoker oxid cat 0.08 222Orangeburg County Biomass,Orangeburg SC 525 35 FBB none 0.11 250NOVI Energy, South Boston VA 629 50 Stoker none 0.09 236Table 4. Carbon monoxide limits for some synthetic minor source permits issued in recent years. The “cap rate”is the rate at which the unit would have to operate in order to stay below the specified tons of CO per year.“FBB” is fluidized bed boiler.28
This problem is acknowledged in many bioenergy air permits, where it is common to see CO limitsset considerably higher than what is achievable when the boiler is operated under ideal conditions.Despite this, however, a great number of bioenergy facilities, claim synthetic minor status for COin order to avoid having to go through PSD permitting (Table 4).How realistic is it that relatively large facilities can keep their CO emissions at less than 250 tonsper year? The average allowable emission rate for the PSD facilities in our database (i.e., those thathad gone through a BACT analysis) was around 0.2 lb/MMBtu. At that emission rate, a relativelysmall boiler of 285 MMBtu (around18 MW) would have the potential to emit 250 tons of CO peryear, suggesting that most facilities, unless they are taking exceptional measures, are likely to bemajor sources for CO. Of the 88 permits in our database, 53 were capped at 250 tons or below forboth CO and NOx – and the majority of these had boilers larger than 285 MMBtu.In Table 4, the “cap rate” is the emission rate that the boiler would need to achieve in order to staybelow its CO limit (assuming that the boiler is the only source of CO at the facility; in fact, the 250ton cap is supposed to include all emissions at the facility, including emissions from fossil fuelsburned at startup, emergency generators, etc). The cap rate is derived by rearranging equation 1,above:Equation 2Only two of the facilities in Table 4 proposed to use oxidation catalysts 39 to reduce CO emissions,with the rest planning to use “good combustion practices.” According to the boiler maker Babcockand Wilcox, baseline CO emissions for stoker boilers (without an oxidation catalyst) are in therange of 0.1 - 0.3 lb/MMBtu when the boiler is being operated optimally at steady-state (i.e. notduring startup and shutdown). 40 Fluidized bed boilers may have lower CO emissions rates of 0.015- 0.15 lb/MMBtu at steady state 41 (the lowest permit limit found for an operating biomass boiler inEPA’s permit clearinghouse 42 is that for the 50 MW Schiller Station bioenergy facility inPortsmouth, New Hampshire, which has a limit of 0.1 lb/MMBtu for a circulating fluidizedbed boiler).It seems unlikely that all of the facilities in Table 4 would be capable of meeting the cap raterequired to actually stay below 250 tons per year, given that in order to do so, many would have toconsistently operate at rates even lower than 0.1 lb/MMBtu (including during periods of startup and39An oxidation catalyst converts CO to CO 2 and thus reduces CO emissions. The chemical reaction is speeded by a metalcatalyst, but this technology has been rarely proposed for use in biomass boilers, because installing and operating CO catalysts isexpensive and because the catalyst can be fouled and deactivated by substances contained in the ash. .40Bowman, J., et al. Biomass combustion technologies: A comparison of a biomass 50MW modern stoker fired system and abubbling fluidized bed system. Presented at POWER-GEN International, December 8-10, 2009. Las Vegas, NV.41 Ibid.42EPA’s BACT Clearinghouse (http://cfpub.epa.gov/rblc/)contains permit limits for a number of facilities, but it is notcomprehensive and does not contain information on recently issued permits.29
shutdown, when emissions can increase – see Table 3). Facilities could shut down for part of theyear to stay below 250 tons, but only a couple of the permits we reviewed contained limits onhours of operation.EPA agrees: Synthetic minor emission caps in state-issued permits strain credulityOur skepticism about whether facilities can meet their required cap rates is shared by the EPA.The agency rarely gets involved in state-issued air permits, but occasionally does weigh in. A letterfrom EPA Region IX to the Hawaii air permit issuing authority about the 23.8 MW (gross) HuHonua coal to biomass conversion in Pepe’ekeo, Hawaii (which has a CO emission factorof 0.17 lb/MMBtu set in the permit, but which would need to keep average emissions below 0.14lb/MMBtu to stay below 250 tons) stated that the air permit application “does not provide anydocumentation or justification of the CO emission factor,” and that “we have permitted two biomass facilitieswith stoker boilers that are approximately half the size of the proposed Hu Honua plant; yet the projected futureactual CO emission and CO PTE of both facilities are much higher than Hu Honua’s, and well above the 250tpy PSD major source threshold. In sum, we have not seen any instance of a stoker boiler of the permittee’s sizebeing able to achieve the CO emission limits that the Clean Air Branch is proposing for this permit.” 43Hu Honua is a 22 MW plant, relatively small compared to a number of other facilities that are alsoclaiming synthetic minor status for CO, making the implications of EPA’s statements more farreaching.When, even after the EPA letter, the Hawaii authorities issued the final permit for HuHonua with few changes, a citizen grouppetitioned EPA to formally object to the permiton the grounds that it is illegal and unenforceable.In its response, EPA agreed that the Hu Honuapermit limits for both CO and NOx wereIf a facility claims it is going to emit lessthan 250 tons of each pollutant to avoidPSD permitting, it needs to demonstratethis with testing and monitoringunenforceable, stating “To effectively limit Hu Honua’s CO and NOx PTE to less than 250 tpy, the CO andNOx emissions limits included in Section C6 of the Final Permit must apply at all times to all actual emissions,and all actual CO and NOx emissions must be considered in determining compliance with the respectivelimits.” 44 EPA’s response makes it clear that not only must normal emissions be included, butstartup and shutdown emissions and emissions during malfunctions or “upset” conditions must becounted, as well.However, while EPA was involved with the Hu Honua permit, the Agency inexplicably has notreacted to other permits with low implied CO emissions (such as the numerous facilities larger thanHu Honua listed in Table 4), most of which explicitly or implicitly exempt total facility emissionsfrom counting toward the 250 ton total.43Letter from Gerardo C. Rios, Chief, Permits office EPA Region IX, to Wilfred K. Nagamine, Manager, Clean Air Branch,Hawaii Department of Health. June 30, 2011.44 United States Environmental Protection Agency. In the matter of Hu Honua Bioenergy Facility, Pepeekeo, Hawaii. Permit No.0724-01-C. Order responding to petitioner’s request that the Administrator object to issuance of state operating permit. PetitionNo. IX-2011-1. Page 10.30
Carbon monoxide (tons per year)The incongruity of permits that set a 250 ton cap for CO, almost no matter what the facility size, isillustrated graphically in Figure 4. The graph shows allowable CO emissions for new syntheticminor sources versus PSD-permitted sources from our permit database, in tons of CO emitted peryear. Almost all the plants in Figure 4 – even the majority of the PSD-permitted plants that wentthrough a BACT analysis – plan to use “good combustion practices” to control CO; only two of thesynthetic minor sources and four of the PSD-permitted sources plan to use oxidation catalysts(highlighted). Thus, all other things being equal, as boiler capacity (in MMBtu per hour) increases,a facility’s annual potential emissions (tons per year) should increase. This is the case for thepermits issued under the PSD program, where achievable CO emissions rates are considered as partof a BACT analysis. However, the graph makes clear, this relationship does not apply for the groupof synthetic minor sources, all of which claim they will emit 250 tons or less, no matter what theirboiler capacity.Figure 4: Projected emissions of carbon monoxide10009008007006005004003002001000No PSDPSD0 500 1000 1500Boiler capacity (MMBtu/hr)Figure 4. The relationship between permitted CO emissions for some facilities that went through PSD, versussynthetic minor sources that avoid PSD. Shaded markers represent facilities that propose to use oxidation catalyststo reduce CO emissions. Dashed line shows trend for non-PSD facilities; solid line shows trend for PSD facilities.These data suggest that the 250 tons cap is problematic on both sides of the size spectrum. Smallboilers that could limit their emissions below 250 tons, but nonetheless have the 250 ton cap as theironly enforceable CO limit, are allowed to emit more pollution than they need to, while some largefacilities that avoided PSD seem unlikely to be able to stay beneath the 250 ton cap, especially sincetotal facility emissions (and not just boiler emissions) are supposed to be included.Nitrogen oxide (NOx) emissionsTo avoid PSD, a facility must accept a cap not only on CO, but also NOx. Table 5 the NOx limitsfor some of the synthetic minor source permits in our database.31
Table 5: Biomass power plants with synthetic minor status for nitrogen oxidesPlant State MMBtu MW Boiler NO x control Cap rate NO x (tons/yr)Pinal Biomass Power, Maricopa AZ 410 30 Stoker SNCR 0.13 240DTE Stockton, Stockton CA 699 48 Stoker SCR 0.04 108U.S. EcoGen Polk, Fort Meade FL 740 57 FBB SCR 0.08 246ADAGE, Hamilton Cty FL 834 56 FBB SCR 0.06 233Green Energy Partners, Lithonia GA 186 10 Stoker not spec 0.03 25North Star Jefferson, Wadley GA 321 22 FBB SCR 0.18 249Greenleaf EnvironmentalSolutions, Cumming GA 372 25 FBB SCR 0.02 25Greenway Renewable Power,LaGrange GA 719 50 SNCR 0.08 249Plant Carl, Carnesville GA 400 25 FBB SNCR 0.14 249Wiregrass, Valdosta GA 626 45 FBB SCR 0.09 247Lancaster Energy Partners,Thomaston GA 215 15 Stoker SNCR 0.26 249Lancaster Energy Partners,Macon GA 220 16 Stoker SNCR 0.26 249Fitzgerald Renewable Energy,Fitzgerald GA 808 60 SNCR 0.07 249Piedmont Green Power,Barnesville GA 657 55 Stoker SNCR 0.08 228Hu Honua, Pepe'keo HI 407 22 Stoker SNCR 0.12 210Liberty Green, Scottsberg IN 407 32 FBB SNCR 0.14 245ecoPower, Hazard KY 745 FBB SNCR 0.08 240Menominee Biomass Energy,Menominee MI 493 FBB not spec 0.11 245Sawyer Electric Co., Gwinn MI 560 FBB SNCR 0.10 245Perryville Renewable Energy,Perryville MO 480 33 FBB SNCR 0.11 240ReEnergy Black River, Fort Drum NY 284 19 Stoker SCR 0.20 250Biogreen Sustainable Energy, LaPine OR 353 25 SNCR 0.15 232Klamath Bioenergy, Klamath OR 459 FBB SNCR 0.11 230EDF Dorchester, Harleyville SC 275 18 Stoker SNCR 0.20 241EDF Allendale, Allendale SC 275 18 Stoker SNCR 0.20 241Loblolly Green Power, Newberry SC 675 53 Stoker MPCR* 0.07 222Orangeburg County Biomass,Orangeburg SC 525 35 FBB SCR 0.11 250NOVI Energy, South Boston VA 629 50 Stoker SCR 0.09 236Table 5. Nitrogen dioxide limits for some synthetic minor source permits issued in recent years. “FBB” isfluidized bed boiler. “MPCR” is “multi-pollutant catalytic reactor.”32
While the majority of biomass permits we examined did not require external emissions controls forCO, nearly all required emissions controls for NOx – usually either Selective Catalytic Reduction(SCR) or Selective Non-Catalytic Reduction (SNCR). These controls force reducing agents(ammonia or urea) to react with the nitrogen oxides formed during combustion, converting theNOx in the flue gas to nitrogen gas (N 2 ). The stated efficiency of these controls variestremendously. In our database, facilities planning to use SCR claim NOx conversion efficienciesranging from 36 – 95%; claims for SNCR efficiency range from 45 – 73%. This wide range ofclaims is obviously problematic, as it seems unlikely that all claims can be met in reality.As is the case for the 250 ton cap for CO, the NOx emission rates implied in Table 5 sometimesappear to be unrealistically low if the facility is stay under the emissions cap. For example, permitlimits for the Green Energy Resource Center in Lithonia, Georgia seem unrealistic. Thepermit narrative states, “Dekalb County is a non-attainment-area for ozone (NOx and VOC) and PM 2.5 .The major source thresholds in the non-attainment area for NOx and VOC are 25 tons per year each. Thepotential VOC emissions are less than 25 tpy. Since the NOx potential to emit exceeds 25 tpy, the facilityrequests a permit limit to limit the NOx emissions to less than 25 tpy. Based on the projected emissions andcontrol efficiencies, the facility will demonstrate through stack testing and continuous emission monitoring thatthe facility will be a synthetic minor source with respect to New Source Review.” 45However, to meet this cap, the facility will have to keep average NOx emissions at about 0.03lb/MMBtu, an extremely low level that is all the more extraordinary given that the company hasproposed a novel emissions control system that has never been tried on a biomass energy plantbefore, a ceramic filter device that apparently incorporates NOx reduction capabilities. Similarly,the proposed 25 MW (net) Greenleaf Environmental Solutions plant in Cumming,Georgia, which is also in the Atlanta non-attainment area, has an even lower NOx emissions rateit must meet – 0.015 lb/MMBtu – if it is to stay below its cap of 25 tons.For synthetic minor permits at some facilities, however, the Some synthetic minor facilitiesNOx emission rates required for a facility to avoid PSD may are allowed to emit pollutionnot be all that low. For instance, the permit for the 19 disproportionate to their sizeMW (net) ReEnergy Lyonsdale Biomass plant inLyonsdale, New York (which has a 290 MMBtu boiler) states that NOx emissions from thewood burning boiler are limited to 0.2 lb/MMBtu to avoid PSD. 46 This emission rate is aboutthree times higher than NOx emission rates commonly required at coal plants and biomass plantsthat have gone through a BACT analysis as part of PSD permitting. This plant’s permit allows it tobe unnecessarily polluting, but since the facility is permitted to burn pallets and “non-recyclablefibrous material such as wax cardboard,” the higher limit may be needed to accommodate surges inemissions that accompany burning waste materials.45 Renee Browne, Georgia Environmental Protection Division, Air Protection Branch. Permit narrative for Green EnergyResource Center, <strong>April</strong> 25, 2013.46New York State Department of Environmental Conservation. Air Title V Facility Permit for Lyonsdale Biomass, Permit ID 6-2338-00012/00004. Effective date 08/16/2011.33
Nitrogen oxides (tons per year)Figure 5 shows that for facilities that go through PSD and a Best Available Control Technologyanalysis, annual NOx emissions tend to increase as boiler size increases, as expected. However, forthe synthetic minor sources that avoid BACT, emission rates are capped around 250 tons or less.Figure 5: Projected emissions of nitrogen oxides700600500No PSDPSD40030020010000 500 1000 1500Boiler capacity (MMBtu/hr)Figure 5. The relationship between permitted NO x emissions for some facilities that went through PSD, versussynthetic minor sources that avoided PSD. Dashed line shows trend for no-PSD facilities; solid line shows trendfor PSD facilities.Although some larger synthetic minor facilities appear to be promising unrealistically low NOxemission rates, the graph makes it clear that allowable NOx emissions from smaller synthetic minorsources tend to be higher than they would be had the facility gone through a BACT analysis todetermine the lowest emission levels that could be achieved.Particulate matter (PM) emissionsAll biomass power plants are large sources of particulate matter emissions; even facilities that havegone through a BACT analysis and have emission rates as low as 0.012 lb/MMBtu emit moreparticulate matter per MWh than a coal plant (Table 2, Figure 2). Because uncontrolled particulatematter emissions from combustion are large, all utility-scale biomass plants use some kind ofparticulate matter control, usually either a fabric filter (“baghouse”) or an electrostatic precipitator(ESP), often in conjunction with a multiclone, which is a series of devices that use centrifugal forceto spin out particles in the larger size classes. 47 Once these controls are in place, they are generallyeffective enough that almost no typically sized biomass plant is in danger of emitting more than 250tons PM per year, meaning that PM is not usually a pollutant that triggers PSD for a new biomasspower plant. 48 However, crucially, this assumption only holds if the plant is running normally47 Only one facility in our database, the Green Energy Partners plant in Lithonia, GA, is proposing to use something other than afabric filter or ESP to control PM emissions, a ceramic filter from the TriMer corporation.48However, for existing facilities undergoing a “major modification,” PSD applicability is triggered when the increase inemissions caused by the modification exceeds certain triggering thresholds. The PSD major significance threshold for PM 2.5 is 1034
Filterable PM10 (tons per year)during the whole year. Periods of startup, shutdown, and malfunctions can cause significantemissions of PM since certain controls, such as ESPs, are allowed to be non-operational during suchtime periods.Even though all biomass plants use baghouses or ESPs,the NSPS emission limit of 0.03 lb/MMBtu that appliesat most synthetic minor facilities is at least twice as highas rates of 0.012 lb/MMBtu to 0.015 lb/MMBtu thatState-issued air permits have nolimits on the most harmful formsof particulate matterapply at facilities that have gone through a BACT analysis. When translated to tons of PM emittedper year, the allowable limits are likewise twice as high (Figure 6).Figure 6: Projected emissions of filterable particulate matter12010080No PSDPSD60402000 500 1000 1500Boiler capacity (MMBtu/hr)Figure 6. Allowable emissions of filterable PM 10 for permits in our database. For nearly all the facilities that avoidPSD, the only required emission limit is the 0.03 lb/MMBtu PM 10 limit set by the New Source PerformanceStandards. Dashed line shows trend for no-PSD facilities; solid line shows trend for PSD facilities. A couple ofminor sources that did not go through PSD nonetheless had lower limits, pulling the dashed trendline down.Particulate matter is a pollutant with immediate and dramatic health effects, and it is a pollutantwhere regulation under PSD can really reduce emissions. Particulate matter is regulated in two sizeclasses, PM 10 , and PM 2.5 , 49 with the subscript referring to particle size or diameter in micrometers.Particulate matter is also regulated in two forms – filterable PM (the portion of PM that can becaptured by a baghouse or ESP), and condensable PM (the portion of PM that condenses out ofother pollutants into the atmosphere after being emitted from the smokestack). While condensablePM is considered to fall into the PM 2.5 size class, much of it is actually in the “ultrafine” size class, of0.1 micron and below. These particles are considered the most dangerous to health, as they are sosmall, the penetrate deep into the respiratory system. The PSD program requires that emissions oftpy of direct PM 2.5 emissions; 40 tpy of SO 2 emissions; or 40 tpy of NOx emissions unless demonstrated not to be a PM 2.5precursor under paragraph (b)(50) of 40 CFR 52.21.49PM 2.5 is a subset of PM 10 .35
PM 2.5 , including condensable PM, be evaluated to assess a facility’s impact on air quality. 50 Incontrast, the only emission rate requirement included in most permits for synthetic minor facilitiesis the federal New Source Performance Standard (NSPS) for filterable particulate matter, whichsimply limits filterable PM 10 emissions to less than 0.03 lb/MMBtu, 51 and specifically exemptsfacilities during periods of startup and shutdown.Just because a facility is allowed to emit a certain amount of pollution doesn’t mean it will. Fabricfilter and electrostatic precipitator technologies should reduce filterable PM 10 emissions to less than0.03 lb/MMBtu (though emission rates can spike dramatically during startup and shutdown, whenmost synthetic minor facilities are specifically exempted from meeting an emissions limit – Table3). However, because synthetic minor source permits contain no consideration or limits oncondensable PM or PM 2.5 , total emissions of PM are likely to greatly exceed emissions of justfilterable PM. In fact, permitting agencies don’t seem to have a consistent concept of theimportance of condensable PM, even though it is an important part of total PM emissions.Regulation of condensable PM is chaotic. In our analysis of 23 permits where condensable PMrates were specified or could be estimated by subtracting filterable PM from total PM emissions,we determined that the ratio of allowable condensable emissions to filterable emissions variedsignificantly, with condensable PM rates ranging from 50% to 200% of filterable PM emissionrates.Particulate matter emissions from biomass power plants could be reduced considerably byrequiring use of one of the many high efficiency filtration products that EPA certifies. 52 Table 6shows how, for a representative 500 MMBtu/hr wood-burning boiler with an uncontrolled PMemission rate of 0.56 lb/MMBtu, 53 adding just tenths or one-hundredths of a decimal point in theefficiency of a filtration system can significantly decrease the amount of particulate matter emitted.The higher efficiency fabric filters produce a dramatic reduction in emissions even relative to thecontrol efficiencies of 98% or 99% that are often promised in modern permits, and actuallyrepresent the “best available” technology for particulate matter control. Unfortunately, becauseEPA rules are so weak, with synthetic minor source permits only requiring that facilities meet the0.03 lb/MMBtu NSPS limit for filterable PM, state-level permit writers have little regulatory basisfor requiring facilities to use high-efficiency filters, even if they want to.50Many permits use PM 10 emissions as a proxy for PM 2.5 , assuming that treating all PM as if it is in the smaller size class is themost conservative form of the analysis.51U.S. EPA. 40 CFR Part 60. Standards of performance for electric utility steam generating units, industrial –commercialinstitutionalsteam generating units, and small industrial-commercial-institutional steam generating units; final rule. FederalRegister Vol. 71, No. 38, Feb. 27, 2006.52 EPA lists currently certified products at http://www.epa.gov/etv/vt-apc.html#bfp53 Value of 0.56 lb/MMBtu for uncontrolled PM emissions taken from Table 1 of background document to EPA’s AP-42compilation of emission factors (Eastern Research Group. Background document report on revisions to 5 th Edition AP-42,Section 1.6, Wood Residue Combustion in Boilers. July, 2001).36
Table 6: Synthetic minor sources are allowed to emit hundreds of timesmore particulate matter than the best-controlled facilitiesTechnologyTons/yearAllowable emissions @ NSPS limit of 0.03 lb/MMBtu 65.70Electrostatic precipitator @ 98% 24.53Baghouse @ 99% 12.26Baghouse @ 99.5% 6.13Baghouse @ 99.9% 1.23High-efficiency baghouse @ 99.99% 0.12Table 6. Emissions of filterable PM 10 from a 500 MMBtu wood-burning boiler employing control technologies withdiffering removal efficiencies. A biomass power plant operating at the NSPS limit of 0.03 lb/MMBtu would emitmore than 500 times the PM of a plant employing a high-efficiency baghouse.In some cases, when regulators do have the option of requiring stricter emissions controls, theydon’t. For instance, the new 25 MW biomass boiler at Verso Paper in Bucksport, Maine,which did go through a BACT analysis, was nonetheless permitted with a 0.03 lb/MMBtuemissions rate for PM, 54 the same rate it would be required to meet if no BACT analysis had beenconducted. This large, high-emissions plant is located immediately adjacent to homes and schools.Sulfur dioxide (SO 2 ) emissionsWood is a relatively low-sulfur fuel, and thus generally emits less sulfur dioxide than coal, althoughrelative to natural gas, its emissions of SO 2 are far higher (Figure 2). While sulfur content of“unadulterated” wood samples in EPA’s fuel database 55 averages less than 1%, sulfur content can bemuch higher if wood chips are sourced from construction and demolition debris, which can becontaminated with gypsum wallboard, a material that contains sulfur. If all sulfur in biomass wereconverted to SO 2 during combustion, the sulfur in even unadulterated fuels would be sufficient tocreate more than 250 tons of annual emissions at most large biomass power plants. However, SO 2is neutralized naturally during combustion by alkaline ash products so that up to 90% of it isincorporated in ash, rather than exiting the stack in the flue gas. 56 Facilities that inject alkalineagents like limestone to neutralize hydrochloric acid emissions can also reduce SO 2 emissions.54Maine Department of Environmental Protection. Departmental Findings of fact and order, New Source Review, Amendment#3 for Verso Bucksport, LLC. A-22-77-4-A.55Draft Emissions Database for Boilers and Process Heaters Containing Stack Test, CEM, & Fuel Analysis Data Reported underICR No. 2286.01 & ICR No. 2286.03 (version 8) May, 2012. Available athttp://www.epa.gov/airtoxics/boiler/boilerpg.html (database labeled “Boiler MACT Draft Emissions and Survey ResultsDatabases”)56Oglesby, H.S. and Blosser, R.O. 1980. Information on the sulfur content of bark and its contribution to SO2 emissions whenburned as a fuel. Journal of the Air Pollution Control Association, 30:7, 769-772.37
Synthetic minor facilities tend to have higher allowable SO 2 emission rates than facilities that havegone through PSD permitting. However, in Figure 7, the non-PSD facilities with allowable SO 2emissions around 250 tons did include sorbent injection in their emissions controls, suggesting thatactual emissions would be lower than allowable emissions. Overall, 13 facilities did not appear toplan on using sorbent injection, including a couple of PSD-permitted facilities that plant to rely on“natural” ash sorption of to control SO 2 and HCl emissions.Figure 7: Projected emissions of sulfur dioxideFigure 7. The relationship between permitted SO 2 emissions for some facilities that went through PSD, versussynthetic minor sources that avoid PSD. Dashed line shows trend for no-PSD facilities; solid line shows trend forPSD facilities.Toxic air pollution from biomass energyHazardous air pollutants (HAPs) is the collective name for the group of 187+ compounds that EPAconsiders especially toxic in air. Although biomass energy is routinely presented as “clean,” in fact,biomass burning emits large amounts of HAPs, also known as “air toxics” – including hydrochloricacid, dioxins, “organic” compounds such as benzene and formaldehyde, and heavy metals likearsenic, chromium, cadmium, lead, and mercury. Emissions of metals and other HAPs are likely tobe highest when contaminated materials like construction and demolition debris are burned as fuel,but burning just unadulterated forest wood also emits toxic air pollutants. Some of thesecompounds are contained in the fuel itself while others are created during the combustion process.As we discuss below, the use of contaminated fuels is increasing in the bioenergy industry, thusHAPs emissions from the biomass power industry are likely to increase.Burning biomass emits a wide variety of air toxics, but the HAP typically thought to be emitted inthe greatest quantities is hydrochloric acid (HCl). Other HAPs emitted at relatively high ratesinclude acrolein, acetaldehyde, styrene, benzene, and formaldehyde, which have various38
espiratory and carcinogenic effects. A co-firing test conducted at the 600 MW Killen coalplant in Wrightsville, Ohio, where a small amount of biomass was burned at a coal plant,showed the dramatic potential for biomass to increase emissions of air toxics. There, adding just5% biomass to the coal increased CO emissions by 50%, while increasing the yearly potential toemit for benzene from 1.51 tons to 6.89 tons per year and the PTE for formaldehyde from 0.28tons to 5.98 tons per year (both these organic HAPs are classified as carcinogens). 57 It is importantto note, however, that many HAPs (such as dioxins), while emitted in small quantities as comparedto the HAPs discussed above, can pose very significant health risks, due to their high levels oftoxicity.How the Clean Air Act regulates emissions of hazardous air pollutants (HAPs)The Clean Air Act regulates HAPs by settingNational Emissions Standards for Hazardous Bioenergy plants emit acrolein, styrene,Air Pollutants (NESHAPS) for different benzene, and formaldehyde, as well as heavytypes of emissions sources. The Act metals like arsenic, chromium, cadmium,requires EPA to set emission standards for lead, and mercury.each HAP that a source category emits,although the regulations as written do not appear to meet this standard. The allowable emissionlevels for HAPs, known as the Maximum Achievable Control Technology (MACT) standards, aresupposed to be derived by collecting emissions data from existing sources, then setting standardsfor new facilities based on the best performing (lowest emitting) units of each type. 58As EPA currently implements the rules, different types of facilities are held to different MACTstandards, with one category being units described as “designed to burn” biomass. Under EPA’scurrent rules, if a boiler burns or co-fires more than 10% biomass, and is greater than 10MMBtu/hr, it is regulated as a biomass burner under the Industrial/Commercial/Institutional(ICI) rule, known informally as the “boiler rule” 59 or boiler MACT. Amazingly, this rule regulatesa facility burning 90% coal and 10% biomass as a biomass burner, which as shown below, hasconsequences for emissions, as biomass boilers are allowed to emit more pollution than coalboilers.The “boiler rule” regulates all biomass boilers, no matter how large they are, and sets separatestandards for emissions from fossil-fueled boilers up to 25 MW in capacity. However, oil, coal andgas facilities larger than 25 MW are governed not by the boiler rule, but by a separate ElectricGenerating Unit (EGU) rule, which is more rigorous (discussed below). If a facility burns a57Technical support document, DP&L Killen Electric Generating Station, Boiler #2 coal and renewable fuel co-firing. 2010;58Section 112(d)(2) of the Clean Air Act requires the maximum degree of reduction in emissions that can be achieved,considering cost and other factors, through the full range of potential reduction measures. 42 U.S.C. § 7412(d)(2). In addition,§ 112(d)(3) provides that regardless of cost, standards for new and existing facilities must reflect the emission level achieved bythe best performing similar sources. 42 U.S.C. § 7412(d)(3).59Whereas coal plants larger than 25 MW are held to a stricter standard for emissions under the Electric Generating Unit MACTstandard, all biomass plants, regardless of how large they are, are govern by the more lenient “boiler” MACT39
material classified as a commercial or industrial waste 60 it is regulated under the Commercial andIndustrial Solid Waste Incinerator rule (CISWI).Under the boiler rule, a facility is considered a “major” source for HAPs if it has the potential toemit more than 10 tons of any one HAP or more than 25 tons of all HAPs in a year. If potentialemissions are anticipated during the permitting process to be less than this, a facility is classified as aminor source, known as an “area” source in MACT parlance. In some cases, the MACT standardsset emission limits directly for the HAP in question; in the boiler rule, however, only HCl andmercury are regulated directly, and other HAPs are regulated indirectly by setting limits onemissions of PM and CO, which EPA has claimed can serve as “surrogates” for emissions of variousco-emitted HAPs. 61While the term “maximum” achievable control technology (MACT) for hazardous air pollutantswould imply that HAP emissions are controlled to the greatest degree possible, EPA’s approach,and the way data are manipulated to set standards, have not resulted in protective standards. As anarea source, the only limit a biomass burner greater than 30 MMBtu 62 must meet under the rule is afilterable PM emissions rate of 0.03 lb/MMBtu, the same rate as required under the NSPS, asdescribed above in the section on PSD avoidance. The biomass area source rule does not set anyemissions limits on dioxins, other organic HAPs like benzene and formaldehyde, metals likemercury, arsenic, and lead, or hydrochloric acid (HCl) and other acid gases.Since the area source standard is so weak, it mightbe expected that emissions standards for majorsources of HAPs (those that anticipating exceedingthe 10/25 ton limit) would be more rigorous, butin fact, the filterable PM standard for stokerUnder the boiler rule, the majority ofbiomass power plants have almost norestrictions on the amount of toxicpollution they can emit.boilers under the major source rule is also 0.03 lb/MMBtu, the same as for area sources, althoughthe filterable PM standard for bubbling fluidized bed boilers is one third the standard for stokers, at0.0098 lb/MMBtu. In general, the MACT standards are far more lax than what can be routinelyachieved using present-day technology. For example, the 0.03 lb/MMBtu filterable PM limit formajor source stoker boilers (and area sources) is orders of magnitude higher than filterable PMemissions levels that can be achieved using high-efficiency fabric filters discussed above, as shown inTable 6. The CO standard set by the major source MACT rule is higher than rates commonly setby BACT determinations, as we discuss in more detail below. The major source MACT limit forHCl, which is supposed to serve as a proxy for emissions of other acid gases like hydrogen fluoride,is set at 0.022 lb/MMBtu, about an order of magnitude higher than emissions that can be achievedusing sorbent injection. The limit is so high, it allows facilities that have declared themselves majorsources for HAPs, like the 31 MW unit being added at the Sierra Pacific Anderson plantin Anderson, California, to be built without HCl controls. That facility projects emitting 45 tons60 Municipal waste, medical waste, sewage sludge, and certain other types of waste are regulated separately.61 There is considerable debate as to whether these proxies are at all valid, and much evidence that emissions of certain HAPs aredecoupled from their proxies.62The rule sets the filterable PM rate at 0.07lb/MMBtu for biomass burners that are 10 – 30 MMBtu in capacity.40
of HCl per year. Likewise, the 45 MW (gross) Aspen facility, in Lufkin, Texas, waspermitted as a major source for HAPs with a permit limit of 57 tons of HCl per year, and will notuse a sorbent system to control HCl. 63Of the permits that we reviewed, the majority were designated as area sources for HAPs, no matterwhat their boiler size; just 19 (22%) were clearly identified as major sources for HAPs (somesimply did not discuss HAPs in their construction permit at all. 64 ) As neither the major source rulenor the area source rule is particularly restrictive, the question is what facilities hope to accomplishby being designated as area sources for HAPs. The lack of any emission limits in the area sourcerule other than the 0.03 lb/MMBtu limit for filterable PM is no doubt attractive for facilitieswishing to minimize the requirements they must meet, but as we discuss below, facilities may bechallenged to demonstrate that they are truly area sources.EPA rules let biomass plants emit more toxic air pollutants than coal plantsHow do the boiler rule emissions standards for bioenergy compare to standards set for coal plants?We focus here on filterable PM standards, since particulate matter is an important threat to healthon its own and is treated by EPA as a proxy for heavy metal emissions under the boiler rule, whichdoes not regulate heavy metal emissions directly. Under the rule, for filterable PM:Area source biomass boilers greater than 30 MMBtu/hr are allowed to emit 0.03lb/MMBtu, the same as an area source coal boiler.Major source biomass stoker boilers 65 are allowed to emit more than 27 times the PM of amajor source coal boiler (0.03 lb/MMBtu for bioenergy, versus 0.0011 lb/MMBtu forcoal).Major source fluidized bed biomass boilers are allowed to emit almost 9 times the PM of amajor source coal boiler (0.0098 lb/MMBtu for bioenergy, versus 0.0011 lb/MMBtu forcoal).Although all biomass energy facilities of anysize are regulated under the boiler rule,coal plants larger than 25 MW are regulatedunder the separate and relatively moreEven under “maximum achievable” standardsfor air toxics, biomass plants are allowed tobe more polluting than coal plants.rigorous Electric Generating Unit (EGU) MACT rule, which sets the filterable PM emission rateon an output basis, 66 at 0.09 lb/MWh. To do a biomass to coal comparison for two representative50 MW power plants, where the coal plant is regulated under the EGU rule and the biomass plant63Technical briefing sheet for Aspen Power LLC, Permit No.: 81706 and PDS-TX-1089, and HAP1264In some cases this may be because HAPs are handled by Title V operating permits, which are issued subsequent to constructionpermits. Most of the permits we reviewed were construction permits, but our database also included a few Title V permits.65For major sources (facilities that exceed the 10/25 ton emissions threshold), the boiler rule sets separate standards for biomassand coal stoker boilers and fluidized bed boilers.66 Pollution emissions expressed on an output basis is in units of pounds of pollutant emitted per megawatt-hour of electricitygenerated; emission expressed on an input basis is in units of pounds of pollutant emitted per million Btu (MMBtu) of boilercapacity, an expression of the heat input to the boiler.41
is regulated under the boiler rule, therefore requires converting the bioenergy MACT standard(which is expressed on an input basis, as lb/MMBtu) to an output basis. 67Assuming a 24% conversion of energy to electricity for bioenergy, which is a typical value forlarge-scale bioenergy facilities, for filterable particulate matter:The biomass boiler MACT standard of 0.03 lb/MMBtu for a stoker boiler translates to arate of 0.427 lb/MWh on an output basis, 474% the standard for a coal plant regulatedunder the EGU rule,The biomass boiler MACT standard of 0.0098 lb/MMBtu for a fluidized bed boilertranslates to a rate of 0.139 lb/MWh on an output basis, 68 154% the standard for a coalplant.Thus, even subject to the “maximum achievable” control technology standard for hazardous airpollutants, biomass power plants are allowed to emit dramatically more particulate pollution thancoal plants.EPA rules let biomass plants emit more air toxics than waste incineratorsUnder the Clean Air Act, how much pollution an industrial boiler is allowed to emit depends inpart on whether it is classified as a biomass burner (an ICI unit) or a waste incinerator (a CISWIunit, which burns commercial and industrial waste). 69 Waste incinerators are generally betterregulated than biomass burners, as the CISWI standards apply to all units regardless of their size,based on potential to emit, and because the rule regulates a larger number of the pollutants likely tobe present in waste, and generally regulates them more tightly (Table 7). This seems reasonable,given that burning wastes is likely to emit more toxins than burning wood and other fuels typicallythought of as “biomass,” but as we explain below, EPA’s new rules blur the line between biomassand waste, allowing a greater amount of contaminated fuels to be burned as biomass in area sourceboilers, which have no emission limits for HAPs.As shown in Table 7, while the CISWI rule is not especially rigorous, it does recognize thepotential for heavy metals and dioxin emissions from burning waste materials, regulating a coupleof metals directly (an important exception is that the CISWI rule does not set an emission limit forarsenic, which is one of the main ingredients in the copper-chromium-arsenate (CCA) cocktail thatis used to pressure-treat wood). Unlike the incinerator rule, the boiler rule only regulates nonmercurymetals indirectly, by setting emission standards for filterable particulate matter, whichEPA considers a proxy for metals emissions.67 To do this, one divides boiler capacity by the efficiency of the conversion from heat input to electricity, and converts units ofMMBtu to MWh. The conversion from btu to MWh is made assuming 3,413,000 btu per MWh68These conversions assume 24% efficiency for the biomass boilers.69Municipal waste, medical waste, sewage sludge, and certain other types of waste are regulated separately.42
Table 7: EPA barely regulates toxic air pollution from biomass plantsCISWI limit for ERU'sburning biomassICI Major Source limitsStoker boilersICI Major Source limitsFluidized bed boilersICI Area SourcelimitsPM, filterable(mg/dscm) 5.1PM, filterable(lb/MMBtu) 0.03PM, filterable(lb/MMBtu) 0.0098PM, filterable(lb/MMBtu) 0.03Carbon monoxide(ppm at 7% O 2 ) 240Hydrogen chloride(ppmv) 0.2Mercury(mg/dscm) 0.0022Lead (mg/dscm) 0.014Cadmium(mg/dscm) 0.0014Dioxin, furans,total (ng/dscm) 0.52Dioxin, furans,Toxic Equivalents(TEQ) (ng/dscm) 0.076Nitrogen oxides(ppmv) 290Sulfur Dioxide(ppmv) 7.3Carbon monoxide(ppm at 3% O 2 ) 620Hydrogen chloride(lb/MMBtu) 0.022Mercury(lb/MMBtu) 0.0000008Carbon monoxide(ppm) 230Hydrogen chloride(lb/MMBtu) 0.022Mercury(lb/MMBtu) 0.0000008Table 7. Allowable emissions under EPA’s incinerator rule and major and area source boiler rules.Because the incinerator and boiler rules expressemission rates for the same pollutants usingdifferent units, direct comparisons are difficult.However, the comparisons are possible by makingA biomass plant is allowed to emit tentimes more fine particulate matter than awaste incineratorreasonable assumptions regarding boiler capacity and stack flow for a facility regulated as either abiomass burner or an incinerator. Considering a representative 50 MW facility with a 740MMBtu/hr stoker boiler: 70If classified as an incinerator, it would be allowed to emit 9.5 tons per year of filterable PM.If classified as a biomass burner, it would be allowed to emit more than 10 times as much,97 tons per year, under both the area source rule and the major source rule for stokerboilers. If filterable PM truly is a proxy for emissions of metals, then this means that tentimes more heavy metals would be released at a facility regulated as a biomass burner.70These parameters were taken from the permit for the Russell Biomass plant, a 50 MW wood burner that was proposed inMassachusetts.43
As an incinerator, the facility would be allowed to emit 1,518 tons/yr of CO, but doublethat amount – 3,045 tons/yr – under the major source boiler rule. 71 Importantly, boththese limits are so high, they are nearly meaningless, as large biomass plants permitted assynthetic minor sources under PSD routinely claim to keep CO emissions at one-tenth thislevel– see Table 4 and Figure 4, earlier. In fact, the allowable levels of CO emission underthe biomass MACT are so high, it is doubtful whether EPA’s treatment of CO as a proxyfor hazardous air pollutants like dioxin, benzene and formaldehyde is at all meaningful.Allowable HCl emissions under the incinerator rule would be 1.28 tons/yr, whereas therule for major source biomass facilities would allow 5,546% this amount, 71 tons/yr.Allowable emissions of mercury would be higher under the incinerator rule than the majorsource boiler rule, at 8.2 lb/yr versus 5.2 lb/yr, but unlike emissions of CO and PM,which are products of combustion from all fuels, actual mercury emissions depend on theamount of mercury in the fuel.Bioenergy emissions of Hazardous Air Pollutants: Clean Air ActloopholesAs is the case for criteria pollutants, the bioenergy industry seeks to avoid EPA regulation ofhazardous air pollutants. The industry employs a variety of ploys to downplay toxic emissions.Loophole 4: Most biomass plants have no restrictions on hazardous emissionsAs for PSD permitting, the Clean Air Act allows facilities (other than incinerators) to claim“synthetic” minor source status for emissions of HAPs, stating that the facility will stay under the10/25 ton per year triggering threshold. Claiming area source status is common – of the bioenergypermits that we reviewed, 52 (59%) were synthetic minor sources for HAPs and just 19 (22%)clearly were identified as major sources for HAPs; the rest simply did not discuss HAPs in theirpermit at all. 72 Facilities claiming area source status by capping HAPs emissions in their permitbelow the 10/25 ton threshold ranged in size from the 11.5 MW (gross) Green EnergyResources facility proposed in Lithonia, Georgia, which is limited by its permit to emittingless than 24.5 tons of all HAPs annually, 73 to the 116 MW (gross) Gainesville RenewableEnergy (GREC) facility in Florida, which was in its initial permit limited to emitting 24.7 tonsof all HAPs annually. 74 Interestingly, although the GREC application documents initially stated“GREC will be a major source of HAPs since the potential facility emissions exceed 10 tpy for any individual71Converting the CISWI limit for CO to 3% oxygen basis to make it comparable with the limit expressed in the boiler rule, thevalue is 309 ppm.72Failure to discuss HAPs in a preconstruction permit may indicate that the facility will set HAPs limits in the Title V operatingpermit; however, if a facility is declaring as a major source for HAPs, it is likely that emissions rates and controls will bereferenced in the preconstruction permit.73 Georgia Department of Natural Resources, Environmental Protection Division. Permit N. 4911-089-0379-E-01-0, for GreenEnergy Resource Center. <strong>April</strong> 26, 2013.74Florida Department of Environmental Protection. Air Permit No. 001031-001-AC for Gainesville Renewable Energy.December 29, 2010.44
HAP and 25 tpy for total combined HAPs,” 75 a subsequent evaluation reversed this, stating “The applicantbelieves that the proposed GREC project alone (the BFB in particular) will not have a PTE of any single HAPthat is equal to or greater than 10 TPY or of all aggregated HAP equal to or greater than 25 TPY.” 76Such claims and sudden conversions to area source status for HAPS are not uncommon in thebioenergy world; as we discuss in more detail below, the 58 MW (gross) ecoPower plantbeing built in Hazard, Kentucky, also abruptly and inexplicably reduced its projectedemissions estimate of HAPs in order to be regulated as a synthetic area source, and a permittingdocument for the proposed 54.5 MW (net) Piedmont Green Power in Barnesville,Georgia limits emissions of HAPs to 24.9 tons, stating “The potential rates exceed this rate. Howeveractual emissions are limited to this rate.” 77 In fact, under federal rules, this constitutes an admissionthat the facility is a major source, but it was not regulated as such.How is it that the majority of facilities we reviewed claim to be area sources for HAPs, no matterwhat their boiler size? There are two main ways that facilities justify this claim. First, because HClis the HAP that tends to be emitted in the largest quantities by biomass burning, and may easilyexceed the annual 10 ton limit, facilities sometimes propose to install an acid-neutralizing sorbentinjection system to control emissions. Following a one-time initial emissions test (which may takeplace sometime in the first 6 months of operation), if a facility is found to be emitting too muchHCl to stay below the 10-ton limit per year, it can increase the amount of sorbent until the ratedrops to a level where staying below the cap seems feasible. Setting aside the lack of requirementsto then maintain this sorbent injection rate at all times, only 51 of the 88 permits we reviewed(58%) clearly required use of sorbents to reduce HCl emissions – in the other cases, facilitiesclaimed area source status for HAPs without promising to control HCl emissions at all.Loophole 5: The biomass industry lowballs estimates of toxic emissions to avoidregulationAnother way to “reduce” emissions of HAPs, at least on paper, is to simply claim that a biomassplant won’t emit much toxic pollution. 78 EPA’s published “AP-42” emission factors for HAPsemitted by wood-burning are supposed to be used to calculate total emissions of HAPs during thepermitting process. However, the bioenergy industry doesn’t like to use EPA’s factors, claimingthey are too high, and seeks to use lower emissions factors whenever possible. Very often,bioenergy developers use a set of emissions factors from the National Council on Air and StreamImprovement (NCASI), an opaque forestry and bioenergy industry advocacy group (Table 8).75Environmental Consulting and Technology, Inc. Gainesville Renewable Energy Center Prevention of SignificantDeterioration/Air Construction Permit Application. November, 2009. Section 6, p. 6-1.76Florida Department of Environmental Protection. Technical Evaluation and Preliminary Determination, Gainesville RenewableEnergy Center, LLC. July 14, 2010. Page 9.77Alaa-Eldin A. Afifi, Georgia Environmental Protection Division, Air Protection Branch. Permit narrative for Piedmont GreenPower. February 2, 2010.78 Just as for criteria pollutants, the total amount of HAPs emitted by a plant is estimated as the product of boiler capacity(MMBtu/hr) and the emission factor for each pollutant (in lb/MMBtu), producing an hourly rate (pounds per hour; see Equation1). This rate is then multiplied by 8,760, the number of hours in a year, to estimate annual emissions. The lower the emissionrate assumed, the lower the emissions.45
Table 8: Industry data helps biomass plants lowball projected emissions of air toxicsHazardous Air PollutantAP-42 factor(lb/MMBtu)NCASI factor(lb/MMBtu)NCASI as% of AP-42Total lbAP-42Total lbNCASIACETALDEHYDE 8.300E-04 1.90E-04 22.9% 1,352.4 309.6ACETONE 1.900E-04 2.20E-04 115.8% 309.6 358.5ACROLEIN 4.000E-03 7.80E-05 * 2.0% 6,517.4 127.1ANTIMONY 7.900E-06 4.20E-07 5.3% 12.9 0.7ARSENIC 2.200E-05 1.00E-06 4.5% 35.8 1.6BARIUM 1.700E-04 1.60E-04 94.1% 277.0 260.7BENZALDEHYDE 8.500E-07 3.00E-06 352.9% 1.4 4.9BENZENE 4.200E-03 3.30E-03 78.6% 6,843.3 5,376.9BERYLLIUM 1.100E-06 1.90E-06 172.7% 1.8 3.1BIS(2-ETHYLHEXYL)PHTHALATE 4.700E-08 4.70E-08 100.0% 0.1 0.1CADMIUM 4.100E-06 1.90E-06 46.3% 6.7 3.1CARBON TETRACHLORIDE 4.500E-05 8.90E-07 * 2.0% 73.3 1.5CHLOROBENZENE 3.300E-05 1.70E-05 51.5% 53.8 27.7CHLOROFORM 2.800E-05 3.10E-05 110.7% 45.6 50.5CHROMIUM 2.100E-05 6.24E-07 3.0% 34.2 1.0COBALT 6.500E-06 1.90E-07 2.9% 10.6 0.3COPPER 4.900E-05 5.50E-06 11.2% 79.8 9.0DICHLOROMETHANE 2.900E-04 5.40E-04 186.2% 472.5 879.9ETHYL BENZENE 3.100E-05 6.80E-06 * 21.9% 50.5 11.1FORMALDEHYDE 4.400E-03 1.30E-03 29.5% 7,169.2 2,118.2HYDROCHLORIC ACID 1.900E-02 6.70E-04 3.5% 30,957.8 1,091.7LEAD 4.800E-05 5.80E-06 12.1% 78.2 9.5MANGANESE 1.600E-03 1.50E-04 9.4% 2,607.0 244.4MERCURY 3.500E-06 9.90E-07 28.3% 5.7 1.6METHYL ETHYL KETONE 5.400E-06 9.10E-06 168.5% 8.8 14.8NAPHTHALENE 9.700E-05 1.60E-04 164.9% 158.0 260.7NICKEL 3.300E-05 2.90E-06 8.8% 53.8 4.7PENTACHLOROPHENOL 5.100E-08 4.60E-08 90.2% 0.1 0.1PHENOL 5.100E-05 1.40E-05 27.5% 83.1 22.8SELENIUM 2.800E-06 3.00E-06 107.1% 4.6 4.9STYRENE 1.900E-03 6.40E-04 33.7% 3,095.8 1,042.8TOLUENE 9.200E-04 2.90E-05 3.2% 1,499.0 47.3VINYL CHLORIDE 1.800E-05 1.80E-05 100.0% 29.3 29.3Total tonsAP-42Total tonsNCASI31.0 6.2Table 8. HAPs emissions based on potential to emit for a 186 MMBtu boiler. Shaded rows represent air toxicswhere the emissions factor from NCASI is lower than the EPA factor (data from EPA’s AP-42, and NCASI Bulletin858; NCASI emissions factors marked with asterisks are median values, for instances when mean is not presented).46
Whereas EPA’s AP-42 emissions factors are based on data that can be publically reviewed, NCASI’semission factors, and the data upon which they are based, are only available to industry partnerswho pay thousands of dollars per year for membership in NCASI. However, we gained access toNCASI’s emissions factors because the publication that contains the information, NCASI TechnicalBulletin #858, has been reproduced in air permit applications that we have reviewed. Thispublication contains the emission factors but none of the underlying data upon which they arebased.As shown in Table 8, NCASI’s industry-suppliedemission factors tend to be much lower than EPA’sAP-42 factors (shaded rows represent air toxicswhere the emissions factor from NCASI is lower thanCompanies use industry-providedemissions factors to avoid regulationas major sources for air toxicsthe EPA factor). There are only ten instances out of the 33 HAPs shown in the table where NCASIfactors are the same or greater than the EPA factors, and for the HAPs with the highest AP-42factors (acrolein, benzene, formaldehyde, hydrochloric acid, manganese, and styrene, dark shading)the NCASI factors are consistently and significantly lower – for instance, NCASI’s emissions factorfor acrolein is just 2% of the EPA emission factor.The fact that NCASI emissions factors are so much lower than EPA’s makes a real difference whencalculating total HAPs emissions from a bioenergy facility. For example, applying the EPA andNCASI emission factors to the 186 MMBtu boiler at the proposed 11.5 MW Green EnergyResource Center in Lithonia, Georgia produces dramatically different estimates of total tonsof annual HAPs emissions. Estimating HAPs emissions using the EPA-sanctioned factors, the plantwould emit 31tons of HAPs a year, making it a major source and subject to regulation under themajor source boiler rule, whereas under the NCASI factors, the total is 6.2 tons. Because the airpermitting branch of the Georgia Environmental Protection Division uncritically accepts and usesNCASI emissions factors with no independent evaluation, the plant in Lithonia was permitted as anarea source and is subject to no emission limits for air toxics. This was the case for every biomasspower plant permit in Georgia that we have reviewed, with the exception of two facilities. 79While EPA has mostly avoided getting drawn into questions about whether facilities should be usingnon-EPA sanctioned emissions factors for HAPs, the agency has occasionally commented. In theirletter to the Hawaii air permitting authority on the 23.8 MW (gross) Hu Honua coal tobiomass conversion in Pepe’ekeo, Hawaii, 80 EPA Region 9 stated that it was not acceptableto use non-AP-42 emission factors without justifying why these factors were better than the EPAfactors. However, the use of these non-EPA sanctioned factors is widely accepted by state79The Georgia biomass plants we reviewed that have been given area source status for HAPs are: 40 MW Graphic Packaging,Macon; 10 MW Green Energy Partners. Lithonia; 22 MW North Star Jefferson, Wadley ; 25 MW Greenleaf EnvironmentalSolutions, Cumming; 49.8 MW Greenway Renewable Power, LaGrange; 45 MW Wiregrass, Valdosta; 100 MW WarrenCounty Biomass, Warrenton; 15 MW Lancaster Energy Partners, Thomaston; 16 MW Lancaster Energy Partners, Macon; 60MW Fitzgerald Renewable Energy, Fitzgerald; 54.5 MW Piedmont Green Power, Barnesville. The two plants permitted asmajor sources were: 110 MW Yellow Pine Energy, Fort Gaines; 25 MW Plant Carl, Carnesville (poultry-waste burner).80Letter from Gerardo C. Rios, Chief, Permits office EPA Region IX, to Wilfred K. Nagamine, Manager, Clean Air Branch,Hawaii Department of Health. June 30, 2011.47
permitting authorities, especially in states like Georgia that tend to look favorably on forestryrelatedindustries. Since EPA as a whole does not review many of the permits where these NCASIfactors are being used, the Agency appears to be turning a blind eye to the variety of methods beingused to lowball HAPs emissions. One of the most egregious examples is the proposed 50 MW(net) ecoPower facility in Hazard, Kentucky, which invented their own emissions factorsusing selected emissions data, thus estimating less than ten tons of HAPs overall for a 745 MMBtuboiler. Even calculated using the suspect NCASI factors, the total HAPs emissions for the facilitywould have been more than twice that amount.The industry-supplied emission factor for HCl likely underestimates actual emissionsAre the NCASI emission factors credible? To evaluate this question, we analyzed actual emissionsof hydrochloric acid (HCl) from currently operating plants. 81 We focused on HCl because it isemitted by biomass burning in large quantities, and can thus push a facility over the threshold frombeing an area source to a major source of HAPs.The AP-42 emission factor for HCl is 0.019lb/MMBtu (1.9E-02 using scientific notation).Using EPA’s emissions factor, a 121 MMBtuboiler (approximately, an 8 MW facility) wouldAnalysis of actual HCl emissions datasuggests the industry-supplied emissionsfactor under-represents emissions attypical biomass plantshave the potential to emit ten tons of HCl per year, and would thus be a major source for HAPs. Incontrast, the NCASI emission factor for HCl is 0.00067 lb/MMBtu (6.7E-04), just 3.5% the EPA’sAP-42 value. A boiler would have to be 2,840 MMBtu (199 MW) to have a PTE of ten tons peryear using the NCASI factor. This is far larger than any facility in our database.To determine which emissions factor is more representative of HCl emissions from currentlyoperating facilities, we averaged data for the 46 facilties for which EPA has collected recent testdata on HCl emissions, grouping data by the year in which the data were collected, 82 and arrangedthe averages by percentiles (Table 9). Our analysis suggests that the NCASI emissions factorsignificantly underrepresents typical HCl emissions at most biomass plants. The median andaverage emission rates of HCl for the EPA dataset are 1.00E-03 and 8.00E-03 lb/MMBtu,respectively 200% the value of NCASI’s reported median of 5.0E-04 lb/MMBtu, and 1,194% ofthe NCASI average of 6.7E-04 lb/MMBtu. In fact, the NCASI median and average emission factorsfor HCl are both lower than the 30 th percentile of the recent EPA test data, as seen from the actualdistribution of HCl emissions from the EPA dataset. 83 This strongly suggests that the NCASI factorunder-represents HCl emissions at currently operating plants.81EPA called for information on actual emissions to assist in formulating the boiler rule. The database is, Draft EmissionsDatabase for Boilers and Process Heaters Containing Stack Test, CEM, & Fuel Analysis Data Reported under ICR No. 2286.01& ICR No. 2286.03 (version 8) May, 2012. Available at http://www.epa.gov/airtoxics/boiler/boilerpg.html (database labeled“Boiler MACT Draft Emissions and Survey Results Databases”)82 Three of the facilities were represented by three years of data; eight were represented by two years of data.83It is interesting to note that since EPA published its new dataset, NCASI has updated its set of emissions factors. The groupclaims that the new data were integrated with existing data using an “elaborate statistical procedure”.48
Table 9. The NCASI emission factor for HCl under-represents emissions atoperating plantsPercentile10th Percentile20th Percentile30th Percentile40th Percentile50th Percentile60th Percentile70th Percentile80th Percentile90th Percentile95th Percentile99th PercentileAverageHCl EF(lb/MMBtu)1.60E-042.89E-041.00E-031.00E-031.00E-033.00E-037.00E-031.30E-022.30E-023.70E-028.20E-028.00E-03Table 9. Percentile distribution of HCl emission rates for 46 bioenergy facilities in EPA’s emissions database. 84The median and average values reported for the NCASI dataset are both lower than the 30 th percentile value.Is the NCASI emissions factor so low because it is based on emissions data from plants are using asorbent system to neutralize HCl? We examined the EPA’s data to see if using a sorbent systemmade a difference. While it is likely that a number of facilities in the EPA’s HCl emissions datasetuse sorbent to neutralize HCl emissions, there is no clear way to determine all that do. However,even facilities that are clearly marked in the EPA dataset as using an acid gas sorbent system can stillhave emissions that exceed the NCASI emissions factor. For instance, two wood-burning biomassplants, Covanta’s Medota and Delano facilities in California, both use acid gas sorbentsystems. The average HCl emissions rate reported to EPA for the Delano plant was 7.14E-03,which is 1,065% the NCASI average. The average rate for the Mendota plant was 2.65E-02,which is 3,950% the NCASI average. 85 This indicates that even when plants use sorbent systems,their emissions can exceed the NCASI estimate.Our permits database contains permits for facilities that claim to be area sources for HCl, yet donot propose to use any acid control at all, suggesting their emissions could be elevated and that ifthey used the NCASI emissions factors to estimate future emissions, they have probably underestimated.For instance, the proposed 24.9 MW (net) Biogreen Sustainable Energy plant in84Draft Emissions Database for Boilers and Process Heaters Containing Stack Test, CEM, & Fuel Analysis Data Reported underICR No. 2286.01 & ICR No. 2286.03 (version 8) May, 2012. Available athttp://www.epa.gov/airtoxics/boiler/boilerpg.html (database labeled “Boiler MACT Draft Emissions and Survey ResultsDatabases”)85The data for these two plants are notated as “new test data submitted by Biomass Power Association.”49
La Pine, Oregon, used the NCASI factor to estimate its HCl emissions, claiming to be an areasource for HAPs. The plant is not going to use any sorbent system for HCl, even though up to 20%of its fuel will be construction and demolition wood. 86 This suggests this facility should acutally beregulated as a major source for HAPs.The AP-42 HCl emissions factor of 0.019 lb/MMBtu (1.9E-02), which is based on the average ofolder data collected by the Agency, falls between the 80 th and 90 th percentiles of the new set of EPAemissions data that we analyzed, suggesting that it is a relatively protective factor that adequatelycharacterizes emissions of many new facilities. Since so many facilities are being permitted withouta sorbent system to reduce HCl emissions, the need to estimate emissions using properlyconservative factors is even greater.Overall, the evidence suggest that the NCASI emission factor for HCl significantly underestimatesHCl emissions at most facilities. Of the 88 facilties in our permit database, all but three had boilersthat were greater than 121 MMBtu in capacity, meaning that if their emissions had all beencalculated using the EPA’s AP-42 factor, all these facilities would have been regulated as majorsources for hazardous air pollutants on the basis of their potential to emit HCl emissions alone.When states issue permits and allow permit applicants to pick and choose what emissions factors touse for air toxics, including the low-ball NCASI factor for HCl, the result is that facilities areerroneously permitted as “area” sources under the boiler rule.Loophole 6: Weak testing requirements mean air toxics limits aren’t enforceableOnce a facility that has been permitted as an area source for HAPs is operating, lax to non-existenttesting requirements for air toxics mean it may be able to exceed allowable emissions thresholdsand pollute with impunity. While facilities that avoid PSD by declaring themselves minor sourcesfor criteria pollutants are required to at install continuous emissions monitors (CEMs) for a fewcriteria pollutants such as NOx and CO, there isalmost no monitoring required for emissions of Facilities are supposed to estimate allhazardous air pollutants, and thus no way to ensure emissions of air toxics when claimingthat permit limits are or can be enforced. Some minor source status, but few dopermits require facilities to perform one-time stack tests for certain air toxics 180 days afterstartup, then possibly once every few years thereafter, although this is not always enforced. Forexample, although the wood- and garbage-burning 33 MW(gross) EvergreenCommunity Power facility in Reading, Pennsylvania started operation on August 17,2009, the plant still had not conducted required stack testing for dioxins, metals, HCl, PM, NOx,SOx, and other pollutants 87 as of September 2011, more than two years later, due to86 Oregon Department of Environmental Quality, Eastern Region. Standard air contaminant discharge permit review report forBiogreen Sustainable Energy Co., LLC. Permit No. 09-9557-ST-01.87Required pollutant tests from letter to Mr. Cliff Heistrand, Evergreen Community Power, from George N. Liddick,Pennsylvania Department of Environmental Protection, June 1, 2009.50
malfunctions. 88 The facility had also not been keeping track of emissions of criteria pollutants, 89 asrequired by federal law. Nonetheless, the plant was allowed to keep operating (see below for moredetails on malfunctions and violations at the Evergreen facility).In the biomass power plant permits we reviewed, a lack of accountability for HAPs emissions wasthe norm. The lax nature of biomass air permitting has been rarely challenged in a formal waybefore EPA, but petitioners to EPA on the 23.8 MW (gross) Hu Honua coal to biomassconversion in Pepe’ekeo, Hawaii, did receive some satisfaction from the Agency. In theEPA’s response to the citizen petition protesting the lax nature of the Hu Honua air permit, EPAstates “To effectively limit Hu Honua’s individual HAP and total HAP PTE to less than 10 and 25 tpy,respectively, as specified, the individual and total HAP emission limits in Section C.7 of the Final Permit mustapply at all times to all actual emissions, and all actual individual and total HAP emissions mustbe considered in determining compliance with the respective limits” 90 (emphasis added). EPAis saying here that the permit must contain requirements for the facility to examine actual HAPsemissions in a comprehensive way – meaning testing – for the permit to be enforceable.The EPA Hu Honua decision is significant, because it appears that a number of the permits wereviewed do not include enforceable limits for HAPs. For instance, the permit for the 54.5 MW(net) Piedmont Green Power in Barnesville,Georgia, requires a one-time stack test for HCl toestimate monthly emissions, but for HAPs otherthan HCl, emissions are calculated based onemission factors for HAPs “as approved by theDivision” (i.e., the Georgia EnvironmentalMany of the biomass plant permits wereviewed do not appear to containenforceable limits for air toxics,potentially rendering them invalidProtection Division). No stack testing is required. The Piedmont plant was awarded a $49.5million cash grant from the federal government in “clean energy” funding, but the programapparently does not check whether permits are legal and enforceable before awarding funding. 91The permit for the 42 MW (net) conversion of an oil/gas boiler at the Montville Powerplant in Uncasville, Connecticut allowing the plant to burn biomass provides another exampleof apparently unenforceable permit limitations on hazardous air pollutants. The plant will beallowed to burn a variety of waste wood, increasing the likelihood it will be a significant source ofmetals and other HAPs. While the permit states that the Permittee “shall not cause or allow emissionfrom this equipment to exceed the maximum allowable stack concentration (MASC) for any pollutant listed inRCSA §22a-174-29,” thus referencing a long list of allowable emissions for air toxics regulated in88Pennsylvania Department of Environmental Protection Air Quality Program. Inspection report for United Corrstack, LLC,conducted September 29, 2011.89Ibid.90United States Environmental Protection Agency. In the matter of Hu Honua Bioenergy Facility, Pepeekeo, Hawaii. Permit No.0724-01-C. Order responding to petitioner’s request that the Administrator object to issuance of state operating permit. PetitionNo. IX-2011-1. Page 17.91 The Piedmont facility has received a “Section 1603b” grant, which converts the incentive tax credit, worth 30% of constructioncosts, to a cash award. Grantees are listed athttp://www.treasury.gov/initiatives/recovery/Documents/Section%201603%20Awards.xlsx51
Connecticut, the permit only requires stack testing for HCl and ammonia. 92 In contrast, the permitfor the 37.5 MW (net) Plainfield Renewable Energy plant in Plainfield, Connecticut,which will burn “sorted” construction and demolition wood, states “The Permittee shall demonstratecompliance for each and every hazardous air pollutant emitted from this unit” that is listed in three tables ofthe RCSA document, and that emission rates will be calculated using continuous emissionsmonitoring for certain pollutants and “initial and annual stack testing (or fuel testing) for all otherpollutants.” 93 However, that permit also states that the only stack tests for HAPs that are reallyrequired are tests for a small handful of HAPs that are listed directly in the permit. 94 In this case,although the permit does at least require testing, its provisions still appear to be contradictory andunenforceable.Neither of the Title V permits for two biomass energy plants in New York, the 19 MW (net)ReEnergy Lyonsdale Biomass plant in Lyonsdale, and the 50 MW(net) ReEnergy BlackRiver plant at Fort Drum, include firm testing and compliance requirements for HAPs. Bothsimply state, “For the purpose of ascertaining compliance or non-compliance with any air pollution controlcode, rule or regulation, the commissioner may require the person who owns such air contamination source tosubmit an acceptable report of measured emissions within a stated time.” 95 Yet both facilities claim syntheticminor status for HAPs.Representative of the woefully inadequate state of air permitting for bioenergy is the permit forthe 58 MW (gross) ecoPower plant proposed in Hazard, Kentucky. An early summary ofthe permit 96 declared that the facility would emit 35 tons of HAPs, putting it over the 25-tonannual threshold and thus making it a major source subject to the major source MACT standard.Evidently, the company objected, because the summary of the final permit 97 states that the totalemissions of all HAPs from this large 745 MMBtu/hr boiler will now be less than ten tons annually.Further, even the minimal requirement for one-time stack testing for emissions of the main HAPsemitted by biomass burning, including benzene and formaldehyde, 98 was stripped from the finalpermit. This company cherrypicked their own emissions factors to estimate total HAPs emissions,92Connecticut Department of Energy and Environmental Protection. Bureau of Air Management. New Source Review Permitfor Montville Power, LLC. Modification issue date May 20, 2013; Prior issue date <strong>April</strong> 6, 2010.93Connecticut Department of Energy and Environmental Protection. Bureau of Air Management. New Source Review Permitfor Plainfield Renewable Energy LLC. Permit modification date December 8, 2011.94 Connecticut Department of Energy and Environmental Protection. Hazardous Air Pollutants, RCSA §22a-174-29. Available athttp://www.ct.gov/deep/cwp/view.asp?a=2684&Q=322184&deepNav_GID=161995New York State Department of Environmental Conservation. Air Title V Facility Permit for Lyonsdale Biomass, Permit ID 6-2338-00012/00004. Effective date 08/16/2011; and, New York State Department of Environmental Conservation. Air Title VFacility permit for ReEnergy Black River, LLC. Permit ID: 6-2240-00009/00007. Effective date 5/20/2013.96Commonwealth of Kentucky Division of Air Quality Permit Application Summary Form, for ecoPower Generation, LLC.Version marked “Application received 1/7/2010”.97Commonwealth of Kentucky Division of Air Quality Permit Application Summary Form, for ecoPower Generation, LLC.Version marked “Application received December 21, 2012”.98This provision, found in the draft of the permit dated 6/26/09, stated “During the initial stack testing, the permittee shalldetermine emission factors for hydrogen chloride, benzene, chlorine, and formaldehyde. The emission factors from stack testingshall be used to demonstrate that emissions of any single HAP do not exceed 9 tons per 12 consecutive months, and that totalpotential emissions of HAPs do not exceed 22.5 tons per 12 consecutive months. These emission factors shall be valid for the lifeof the permit unless directed otherwise by the Division [401 KAR 52:020, Section 26].”52
not using the NCASI factors, but inventing their own. Nonetheless, typically for bioenergycompany rhetoric, the company’s website states, “ecoPower is creating a new, clean and renewablesource of electricity known as ‘bioenergy.’ 99It is likely that if the requirements imposed by the EPA decision on the Hu Honua facility wereapplied to other plants – i.e., that once operating, facilities should use actual emissions of HAPs,including during startup and shutdown, to determine whether they are complying with therequirement to stay below the 10/25 ton threshold – almost none of the biomass power plants nowclaiming “synthetic minor” status for HAPs would be able to comply. What saves these facilitiesfrom having to comply with air quality laws, however, is that EPA is ignoring the majority of statelevelbioenergy permits currently being issued.Fuel contaminant testing requirements are even more rareTesting fuels before they are burned to determine whether their combustion will emit toxic airpollution is one way to increase compliance with permitted emissions limits. However, in ourreview of tens of permits, we rarely found requirements that fuel be tested, and when there was arequirement, it was so lax as to be almost meaningless. For instance, the permit for the proposed60 MW (gross) Loblolly Green Power plant in Newberry, South Carolina states that theplant will burn “clean, untreated wood waste,” and that “an initial fuel analysis or stack testing will beconducted. No additional analysis will be required, unless the clean, untreated wood becomes inconsistent incomposition or is received from another source.” 100 However, the document does not explain how adetermination that fuel has become “inconsistent in composition” is to be made if testing is notrequired.Fuel testing requirements at the 50 MW(net) ReEnergy Black River plant at Fort Drum,NY, highlight the difficulty of characterizing fuel contamination in a statistically meaningful way.The facility’s permit states that it can burn “clean wood, unadulterated wood from C+D debris, glued woodcreosote treated wood (sic), tire derived fuel and nonrecyclablefibrous material (waste paper).” Todetermine the amount of contaminated woodburned, the permit states, “ReEnergy shall employ the"grid test" which consists of a 10 by 10 grid placed overthe wood stream and checked to determine the percentageAlthough many biomass facilities arepermitted to burn waste-derived fuels,few actually test to determinecontamination levelsof glued wood, treated/painted wood, and non-wood materials. If it is determined that the percentage of gluedwood is between 0 and 1.0% by volume, then the percentage of glued wood for that load is 1%. If it isdetermined that the percentage of glued wood is between 1% and 20% by volume, the percentage of glued woodfor that load is 20%. If it is determined that the percentage of glued wood is greater than 20% by volume,99 http://www.ecopg.com/100Loblolly Green Power Statement of Basis, Permit number 1780-0051CA. South Carolina Department of Health andEnvironmental Control, September 3, 2009.53
then the load is considered to 100% glued wood. This method shall be employed once every 5 loads persupplier.” 101As tractor-trailer loads of wood are typically 20 – 22 tons, this method of checking the “woodstream” (presumably the material being fed to the plant on the conveyor belt) is likely tocharacterize only a tiny fraction of the material burned. Even done properly, such tests are unlikelyto be representative; and it seems unlikely that adequate oversight will occur. As we discussbelow, new rules proposed by EPA are likely to increase burning of construction and demolition(C&D) waste while removing any requirement for testing at all.Contaminated wastes burned as biomass: EPA declines to regulateThe bioenergy industry is growing fast, and looking for new sources of fuel. Construction anddemolition debris, as well as municipal and industrial wastes, are especially attractive fuels giventheir disposal often generates “tipping fees” that can constitute a significant portion of a biomasspower plant’s income. For instance, the 25 MW (net) Taylor Biomass plant, a wood andgarbage-fueled power plant proposed in Montgomery, New York, estimates that tippingfees for wastes range from $50/ton to over $80/ton, and a 2008 IRS evaluation of the facility’seligibility for tax credits 102 reports that Taylor anticipated receiving $50 for each ton of MSW itreceived. The Taylor project was permitted under rules governing municipal waste incinerators,though their name suggests they are a biomass plant. 103For the purposes of distinguishing “waste” from “biomass,” EPA relies on a part of the ResourceConservation and Recovery Act (RCRA) known informally as the “waste rule.” 104 As part ofdetermining whether a material is a waste, EPA compares contaminant levels in the material tothose in “traditional” fuels. An early draft of EPA’s waste rule, from March 2011, explains: “nonhazardoussecondary materials (NHSM) that contain contaminants that are not comparable in concentration tothose contained in traditional fuel products or ingredients would suggest that these contaminants are beingcombusted as a means of discarding them, and thus the non-hazardous secondary material should be classified asa solid waste.” 105This definition is problematic for the expanding bioenergy industry. Under the Clean Air Act andcourt precedent, any facility that burns any solid waste at all is an incinerator and must meetincinerator emission standards, which are, as discussed previously, somewhat more restrictive thanthose applicable to conventional biomass boilers (Table 7). Further, “waste incineration” doesn’t101New York State Department of Environmental Conservation. Air Title V Facility permit for ReEnergy Black River, LLC.Permit ID: 6-2240-00009/00007. Effective date 5/20/2013.102Internal Revenue Service. Letter ruling on qualification of Montgomery LLC for federal for tax credit. June 11, 2008.103Our report on the Taylor facility, which evaluates claims made by the company in its application for a $100 million “cleanenergy” loan guarantee from the US Department of Energy, is available at http://www.pfpi.net/wpcontent/uploads/2013/05/<strong>PFPI</strong>-Gasification-and-DOE-loan-guarantees.pdf.104 The current version of the rule, and amendments, are available at http://www.epa.gov/epawaste/nonhaz/define/index.htm10540 CFR Part 241. Identification of non-hazardous secondary materials that are solid waste; proposed rule. Federal RegisterVol. 75, NO. 107. Friday, June 4, 2010. p. 3187154
sound green and renewable, whereas “biomass power” does. A letter from Michigan Biomass,an advocacy group working on behalf of six biopower plants 106 in Michigan, filed inEPA’s waste rule docket, explains the bioenergy industry’s problem:“Waste wood from the pulp and paper and forest products industries is the major source of biomass fuel for thesefacilities. However, for nearly a decade, these industries have been in decline, drastically reducing the woodavailable for fuel. Because of this, alternative fuels have played a significant role in offsetting the constrainedwood fuel supply. This will only grow tighter as the state’s new energy policy promoting biofuels productionand incentivizing new biomass-fueled power production puts increasing demand on this limited resource. Theability to fire alternative fuels with our main forest-based wood fuel is imperative to the survival of theseprojects in this new energy landscape.Being regulated as incinerators would represent a regulatoryburden to power plants that utilize wood as a fuel and couldkill the legitimate reuse of materials that work well as fuel intraditional power plant boilers. Additionally, there is astigma attached to being classified as an incinerator thatBiomass industry to EPA: “There isa stigma attached to being classifiedas an incinerator that plants willwant to avoid”plants will want to avoid. It is likely a facility will cease using a material as a fuel if it means they will beclassified as an incinerator. Limiting the use of such fuel will jeopardize the viability of these plants and morematerial will be sent to landfills or open burned.” 107Because biomass burners are usually eligible for renewable energy subsidies and tax breaks, whereasincinerators may not be, it’s clear that the stigma of being classified as an incinerator may haveactual financial consequences.Many biomass plants plan to burn contaminated waste materials as fuelMany of the biomass power plants currently being developed plan to burn waste wood as fuel. Anindustry database of operating and proposed bioenergy plants lists 54 facilities that burn, or plan toburn, “urban wood,” which often includes construction and demolition wood and other potentiallycontaminated waste wood, such as railroad ties. 108 Of the permits in our database, the majority (61permits, 69%) allowed burning of some kind of waste wood besides forest and mill residues, withmany explicitly stating that construction and demolition debris would be burned. While some ofthese permits are for plants that have subsequently been cancelled, and some plants won’t be built,the high percentage of total permits that allow waste wood burning indicates how widespread thispractice has become. Of those 60 permits that allow burning waste wood, 38 (63%) are clearlyclaiming area source status under the boiler rule, meaning they will only be required to meet the106The six plants represented by Michigan Biomass are Cadillac Renewable Energy, in Cadillac; Genesee Power Station, in Flint;Grayling Generating Station, in Grayling; Hillman Power Company, in Hillman; Lincoln Power Station, in Lincoln; and McBainPower Station, in McBain.107 Letter from Tamra S. Van Til, representing Michigan Biomass, to EPA: Comments on advanced notice for rulemaking, docketID# EPA-HQ-RCRA-2008-0329, Identification of non-hazardous materials that are solid waste. February 2, 2009.108Forisk, Wood Bioenergy US database, December, 201355
elatively high filterable PM standard of 0.03 lb/MMBtu, with no limits on HCl, dioxins, mercury,or other heavy metals, even as they burn potentially contaminated fuels.Some plants will be fueled almost exclusively by waste wood. The 37.5 MW (net) PlainfieldRenewable Energy plant in Plainfield, Connecticut is permitted to burn up to 495,305tons per year of wood, including “waste wood from industries” and construction and demolitionwaste. The wood is supposed to be sortedto remove materials like plastics, gypsumwallboard, and “wood which contains creosoteor to which pesticides have been applied or whichThe majority of “area” source permits, whichlack any emissions limits for air toxics, allowpotentially contaminated waste wood as fuel.contains substances that have been defined as hazardous,” 109 but it is not clear how effective such sortingcan be, given that the sorting facilities rely on visual inspection to remove contaminated materialsfrom a fast-traveling conveyor belt loaded with tons of debris. Any testing program to check forcontamination is bound to be statistically invalid, given that on average the Plainfield plant will burnmore than 60 tractor-trailer loads of wood chips per day. In Massachusetts, the state commissioneda health risk assessment for burning “sorted” construction waste after a construction and demolitiondebris burner was proposed for the city of Springfield, citing concerns about emissions of heavymetals and other hazardous air pollutants, 110 but Connecticut has commissioned no equivalentstudy.Many other facilities will depend on at least some waste wood, even when forestry wood isapparently available. Two biomass cogeneration expansion projects associated with paper mills onthe Olympic Peninsula in Washington, the 20 MW (net) Nippon Paper facility at PortAngeles, 111 and the 24 MW (net) boiler at the Port Townsend Paper Company plant, 112will both burn waste wood as fuel, along with forestry wood (the Nippon facility also burnswastewater-treatment sludge from the paper-making process).Why would biomass facilities want to burn contaminated fuels? There are a number of reasons.Pass-through of tipping fees for waste disposal to biomass power plants can produce a lucrativerevenue stream for a facility. In some cases, facilities may fear that “clean” wood sources arelimited, or might become more distant over time , increasing transportation costs. Finally, certainwaste fuels burn hotter and produce more energy than green forestry chips. Construction anddemolition-derived wood tends to be drier, which increases its heating value per unit mass, andpaper-based and especially plastic-based fuels can have significantly higher heating values than wood– for instance, the proposed 25 MW (net) Taylor Biomass plant, a wood and garbage-109Connecticut Department of Energy and Environmental Protection. Bureau of Air Management. New Source Review Permitfor Plainfield Renewable Energy LLC. Permit modification date December 8, 2011.110This study was not completed because the developer of the Palmer Renewable Energy plant in Springfield elected to reapply asa facility that would only burn “clean” wood derived directly from trees, rather waste wood.111 Olympic Region Clean Air Agency. Order of Approval – Notice of Construction 10NOC763, Issued to Nippon PaperIndustries USA Co. Ltd. June 21, 2011.112Washington Department of Ecology. Notice of Construction for Port Townsend Paper Corporation, NOC Order No. 7850.October 22, 2010.56
fueled power plant proposed in Montgomery, New York depends on plastics in fuel togenerate sufficient energy for the gasification process they plan to use. 113Shredded tires are another attractive fuel that is seen as integral to the success of the proposed 25MW North Star Jefferson wood-tire burner proposed in Wadley, Georgia, where thedeveloper states that “TDF is important to the financial viability of the project given its high caloric contentas evidenced by its use in various industries such as pulp and paper production, cement plants in addition toelectricity generation.” 114 The North Star plant avoided PSD and thus did no pre-construction airquality modeling. It will be a significant new source of air pollution in a community that alreadyincludes several large polluters, including a lumber mill that is a large source of emissions fromburning wood. Developers of the North Star plant include the U.S. Endowment for Forestry andCommunities, a non-profit organization that is setting up the for-profit wood and tire-burner togenerate revenue and, they say, to revitalize the economy around Wadley. 115Loophole 7: EPA rules blur the line between biomass facilities and incineratorsThe bioenergy industry needed EPA to redefine wastes as legitimate fuels, because for biomassplants where the “traditional fuel” is unadulterated forest wood, the waste rule’s requirement that“non hazardous secondary materials” (NHSM) contain no more contamination than traditionalfuels 116 might be assumed to exclude most contaminated materials. EPA’s response, which hasbeen to define “traditional fuel” as any fuel afacility might burn, even a very dirty coal, hasbeen more than satisfying to the bioenergyindustry and other facilities that burncontaminated fuels. The EPA’s latest waste rule isEPA’s waste rule classifies contaminatedmaterials as “non-hazardous,” allowingthem to be burned as biomassexplicit – a facility can burn contaminated fuels, including construction and demolition wood, aslong as concentration levels of contaminants are “comparable to or less than the levels in the traditionalfuel the unit is designed to burn, whether wood or another traditional fuel,” 117 and that “Designed to burn”means, “can burn or does burn, and not necessarily permitted to burn.” 118 This includes coal. The ruleclarifies further: “The agency has also determined that restricting comparisons to traditional fuels the unit ispermitted to burn is unnecessary. The fact that a facility is not currently permitted to burn a particulartraditional fuel does not mean it could not be permitted to burn that traditional fuel in the future. For thisreason, we do not believe it is reasonable to limit the comparison to permitted traditional fuels.” 119113Our report on Taylor Biomass is available at http://www.pfpi.net/wp-content/uploads/2013/05/<strong>PFPI</strong>-Gasification-and-DOE-loan-guarantees.pdf.114http://northstarrenewable.com/index.php/projects/north-star-jefferson/faqs115http://usendowmentblog.blogspot.com/2011/12/working-not-where-light-is-best-rather.html116Because the rule requires comparing contamination on a material weight basis, not a material energy content basis, a biomassfacility can burn a “less contaminated” material and still emit more air toxics than a same-sized coal plant, because the lowefficiency of bioenergy requires burning more fuel to produce the same amount of energy.117 40 CFR Parts 60 and 241. Commercial and industrial solid waste incineration units: reconsideration and final amendments;non-hazardous secondary materials that are solid waste. Federal Register Vol. 78, No. 26, Thurs. February 7, 2013. p. 9139.118Ibid, p. 9136119Ibid, p. 914957
EPA rules compare contaminant concentrations in biomass to the dirtiest coalWhat if the biomass a company wants to burn is so contaminated, they can’t find a coal dirtyenough to compare to? The waste rule can accommodate that situation, stating: “Persons who wouldotherwise burn coal may use any as-burned coal available in coal markets in making a comparison in theirNHSM and the contaminants in coal – they are not limited to coal from a specific coal supplier they have usedin the past or currently use.” And, while “national surveys of traditional fuel contaminant levels are oneexample of another acceptable data source,” 120 it’s also fine to compare to dirty coals internationally: “astatement that national surveys can be used does not preclude the use of appropriate international data.” 121Incredibly, the EPA seems quite sanguine about theimplications of these provisions, stating, “The EPAacknowledges that the revisions adopted as final in today’srule would allow C&D wood contaminant levels to becompared to the highest contaminant levels for coal.” 122EPA explicitly acknowledges that rulerevisions “allow C&D woodcontaminant levels to be compared tothe highest contaminant levels for coal”We found a large number of facilities in our permits database that list potentially contaminatedmaterials as fuel. One permit stands out for having cited the new rule allowing use of fuels that areas contaminated as coal – the proposed 25 MW wood and tire-burning North StarBiomass project, in Wadley, Georgia. In its application for an air permit, the companyproposed to burn agricultural waste, animal waste, construction and demolition waste, wood, andtire-derived fuel, stating stated that their fuels would be no more contaminated than coal. TheGeorgia air permitting branch of the Environmental Protection Division (EPD) did ultimatelyrestrict the facility to burning “clean” wood and tire-derived fuel after the community protested,but cited the new EPA rule allowing fuels to be as contaminated as coal as justification for inclusionof tires in the fuel stream: “Although the permitted fuels for the boiler are wood biomass and TDF, thetraditional fuel with which TDF is compared (coal) can be burned in the fluidized bed boiler. This has beenconfirmed by the boiler vendor - Premier Energy. The ‘designed to burn’ provision of the legitimacy criteria isbased on what the respective boiler is capable of burning, not what it is permitted to burn or intended to burn.Because the boiler is capable of burning coal, the “designed to burn” provision of the legitimacy criteria ismet.” 123During the permitting process, the company and the Georgia EPD dismissed comments pointingout that burning tires emits a large number of extremely toxic substances, and chose to calculatetoxic emissions based on just a subset of the hazardous air pollutants known to be emitted. Thecompany claimed that air toxics emitted by open burning of tires would not be emitted when tireswere burned in a boiler, but presented no evidence to that effect. 124 Overall, considering the way120Ibid, p. 9144121Ibid, p. 9153122Ibid, p. 9152123Alaa-Eldin A. Afifi, Georgia Environmental Protection Division, Air Protection Branch. Permit narrative for North StarJefferson Renewable Energy Facility, page 22. May 2, 2012.124 Response to public comments on draft permit and permit application no. 20770, North Star Jefferson Renewable Energy.Letter to Eric Cornwell, Manager, Stationary Source Permitting Program, Air Protection Branch, Georgia EnvironmentalProtection Division, from North Star Jefferson. <strong>April</strong> 17, 2012.58
the Georgia EPD invoked the comparison to coal, the North Star permit demonstrates how littleprotection communities can expect to receive from EPA and state-level permitting agencies when abiomass facility decides it is going to burn contaminated fuels. Communities should considerthemselves lucky to even know what materials the facility will burn, since the EPA’s rules open thedoor to so many potentially contaminated materials.EPA takes industry’s word that biomass fuels are “clean” – testing not requiredProcessing waste materials to reduce contamination isone way to meet EPA’s “legitimacy criteria” forclassifying a material as a non-hazardous fuel, ratherthan a waste. The first step for processing is generallyvisual inspection – waste is tipped out onto a sortingRemoval of contaminated materialsfrom the fuel stream relies primarilyon visual inspectionroom floor and workers manually sort through it to remove household hazardous waste, e-waste,and other contaminated materials such as PVC pipe that can emit high levels of toxics whenburned. 125 With construction and demolition debris, visual sorting is the means of removingpressure treated and otherwise contaminated wood.Although such sorting is prone to a high error rate, EPA nonetheless states that “In general,contaminated C&D wood that has been processed to remove contaminants, such as lead-painted wood, treatedwood containing contaminants, such as arsenic and chromium, metals and other non-wood materials, prior toburning, likely meets the processing and legitimacy criteria for contaminants, and thus can be combusted as anon-waste fuel.” 126The line of reasoning that once it is processed, “waste is not waste” was employed by a court inWashington as a reason for denying an effort to require an environmental impact report for the 24MW Port Townsend Paper biomass expansion project in Washington. Citizen groupswanted the state to require an environmental impact assessment of the project, which will burnwaste materials, emit large amounts of greenhouse gases, and potentially impact forests wherelogging occurs to provide fuel for the plant. The court responded that a Washington law requiringthat “No solid waste incineration or energy recovery facility shall be operated prior to the completion of anenvironmental impact statement” didn’t actually apply to the facility, in part because it will not be an“energy recovery facility” for solid waste. Solid waste is defined as “all putrescible and nonputresciblesolid and semisolid wastes including, but not limited to, garbage, rubbish, ashes, industrial wastes, swill,sewage sludge, demolition and construction wastes, abandoned vehicles or parts thereof, and recyclablematerials”. However, the court determined that hog fuel, urban wood, and burnable rejects fromthe mill and container recycling facility are not solid waste, because they have “become a125The EPA comfort letters sent to companies manufacturing fuel cubes from garbage and other wastes describe the processingsteps as the waste is “transformed” into a non-hazardous secondary material. These letters are available athttp://www.epa.gov/epawaste/nonhaz/define/12640 CFR Parts 60 and 241. Commercial and industrial solid waste incineration units: reconsideration and final amendments;non-hazardous secondary materials that are solid waste. Federal Register Vol. 78, No. 26, Thurs. February 7, 2013. p. 913859
commodity” – therefore, the facility is not actually an energy recovery facility, because it won’tactually burn solid waste. 127The waste rule and its implementation are seenas a disaster by many who are concerned abouttoxic emissions. In its response to commentson the rule, EPA acknowledges concerns thatEPA rules allow potentially contaminatedbiomass fuels to escape testingfuel testing should be required, given the potential for contaminated materials to slip through thesorting process. The rule states that “there will be instances where testing is conducted and comparisonswill have to account for the variability of contaminant levels in NHSMs, including lead concentrations in C&Dwood,” 128 implying one-time testing for initial fuel characterization, rather than ongoing testing.However, “contaminant testing is not required in all situations. Requiring testing in some situations isunnecessary.” 129 Instead, “expert opinion” is sufficient: “contaminant legitimacy criterion determinationsdo not require testing contaminant levels, in either the NHSM or an appropriate traditional fuel. Persons canuse expert or process knowledge to justify decisions to either rule out certain constituents or determine that theNHSM meets the contaminant legitimacy criterion.” 130 EPA adds, “The agency wishes to emphasize, thatdeterminations that the cellulosic biomass used as a fuel or ingredient is clean, do not presuppose any testing ofcontaminant levels. Persons can use expert or process knowledge of the material to justify decisions regardingpresence of contaminants.” 131EPA: construction and demolition-derived wood too clean to monitor?That construction and demolition wood (CDD) can contain lead-painted wood, copper-chromiumarsenate(CCA)-treated wood, glued woods, asbestos, mercury waste, and other materials thatresult in toxic emission when burned is well known. Contaminated wood constitutes around 20%of the growing supply of construction and demolition wood generated by housing tear-downs andby storms. 132 This material can contain large amounts of heavy metals – for instance, one studyestimated that wood debris generated after Hurricane Katrina contained 1,890 tons of arsenic. 133Initially, the draft waste rule included pressure-treated wood as a material where contaminantlevels are high enough that combustion may be occurring as a means of disposal, stating “…nonhazardoussecondary materials that may not contain comparable concentrations of contaminants include127Pollution Control Hearings Board, State of Washington. PCHB No. 10-160 Order on Summary Judgment. PT Air Watchers,No Biomass Burn, World Temperate Rainforest Network, Olympic Environmental Council, and Olympic Forest Coalition,Appellants, v. State of Washington Department of Ecology and Port Townsend Paper Corporation, Respondents. May 10, 2011.12840 CFR Parts 60 and 241. Commercial and industrial solid waste incineration units: reconsideration and final amendments;non-hazardous secondary materials that are solid waste. Federal Register Vol. 78, No. 26, Thurs. February 7, 2013. p. 9152129Ibid, p. 9152130Ibid, p. 9144131 Ibid, p. 9139132 Dubey, B., et al. 2007. Quantities of arsenic-treated wood in demolition debris generated by Hurricane Katrina.Environmental Science and Technology, 41:5, 1533 – 1536.133Ibid.60
chromium-,copper-, and arsenic (CCA)-treated lumber, polyvinyl chloride (PVC) plastics which can contain upto 60 percent halogens (chlorine), lead-based painted wood, and fluorinated plastics.” 134However, EPA apparently has such confidence in the data submitted by industry on contaminationlevels in materials that the Agency has announced it is nearly ready to grant a categoricalclassification of processed CDD wood as “biomass,” and remove testing requirements altogether:“In the March 2011 final rule, we determined that C&D wood that is sufficiently processed can be a non- wastefuel. The Agency has received additional information since the issuance of that rule on specific bestmanagement practices used by suppliers/processors of C&D wood. Such practices include processing to removecontaminants. EPA believes the information received to date would tend to support a listing of these materialsas a categorical non-waste fuel and expects to propose that listing in a subsequent rulemaking.” 135 As of mid-March <strong>2014</strong>, the EPA’s proposed rule granting the reclassification is due to be published in theFederal Register.An “Inside EPA” article additionally states that that theEPA has also been evaluating industry petitions to listpreservative-treated wood as categorical non-waste,including one from the American Forest & PaperAssociation and the American Wood Council seeking acategorical listing for creosote-treated railroad ties, andone from the Treated Wood Council recommendingthat “treated wood biomass,”’ including wood treatedwith borate-based preservatives, copper-basedpreservatives, pentachlorophenol, oilborned coppernaphthenate and creosote, be considered a nonhazardoussecondary material. 136EPA did acknowledge in the final waste rule that“chromated copper arsenate-treated wood (CCA wood) wouldlikely have contaminant levels not comparable to traditionalfuels,” 137 suggesting that this material, by itself, shouldcontinue to be treated as a waste and require disposal inincineration units with more protective emissionscontrols. However, in practice EPA leaves the doorwide open to burning this material in area sourcebiomass boilers and thus increasing emissions of metalsand other air toxics. Even when visually sorted toFigure 8. A 50 MW bioenergy plant burns theequivalent of a truckload of chips approximatelyevery 20 minutes. Photo credit: NREL.13440 CFR Part 241. Identification of non-hazardous secondary materials that are solid waste; proposed rule. Federal RegisterVol. 75, NO. 107. Friday, June 4, 2010. p. 3187113540 CFR Parts 60 and 241. Commercial and industrial solid waste incineration unites: reconsideration and final amendments;non-hazardous secondary materials that are solid waste. Federal Register Vol. 78, No. 26, Thurs. February 7, 2013. p. 9173136 “OMB clears EPA’s proposed expansion of ‘non-waste’ fuel list. Inside EPA.com: The Inside Story. Posted March 13, <strong>2014</strong>.13740 CFR Parts 60 and 241. Commercial and industrial solid waste incineration unites: reconsideration and final amendments;non-hazardous secondary materials that are solid waste. Federal Register Vol. 78, No. 26, Thurs. February 7, 2013, p. 915261
emove obviously contaminated materials, the extraordinarily high volume of C&D that isprocessed for fuel and the dependence on visual inspection to remove contaminated materialsmeans it is inevitable that pressure-treated, painted, and glued woods get into the fuel stream.Once chipped, and delivered in high volume to a bioenergy facility (Figure 8), as a practical matter,there is little chance of detecting contamination before wood is burned.Further, since unadulterated wood in the waste stream can be recycled for mulch, wood pellets,animal bedding, and particleboard, the most contaminated materials are what is left over forburning – although, in EPA’s view, these are the very materials that are ostensibly sorted out of thebioenergy fuel stream and are not used for fuel. It seems inevitable that the EPA’s proposal to granta blanket exemption from testing of C&D wood will mean that more of this contaminated materialis burned in biomass power plants that have no restrictions on emissions of air toxics. Importantly,this includes many small “thermal only” wood boilers being installed for heat at municipal buildings,schools, campuses, and hospitals – i.e., in close proximity to sensitive individuals includingchildren, the elderly, and the sick. Many of these boilers are too small to even be covered by thearea source rule, which only regulates boilers greater than 10 MMBtu/hr. Once contaminatedwood is in circulation as fuel, it is likely to end up being burned at these small facilities, which havealmost no emissions controls.Garbage-derived fuels are EPA’s new “non-waste fuel products”Another category of materials newly classified as fuels under the waste rule is municipal andindustrial wastes that have been processed into fuel products. EPA’s “legitimacy criteria,” therequirements that a waste must meet in order to bereclassified as a non-hazardous secondary material (NHSM),include processing of the material to reduce contaminants orimprove energy content. Seizing on the opportunitiesprovided by the waste rule, a number of companies are nowprocessing municipal garbage and industrial wastes intocompressed fuel cubes (Figure 9 shows a product fromInternational Paper. 138 ) Once EPA issues a “comfort letter”approving these materials as non-hazardous, they can be usedas a coal or biomass substitute, and burned in units that areregulated as biomass boilers, rather than the more strictlyFigure 9. International Paper fuel cubes,made from compressed waste.regulated incinerators. EPA’s classification of “biomass” burners as including any boiler that burnsjust 10% biomass means that even if these fuels contain substantial fossil fuel-derived content, forpurposes of regulation, units burning them are subject to the very lax boiler rule standards forbiomass boilers.EPA’s administrative process to “transform” wastes to non-hazardous fuels is quite hands-off. Inaccordance with the Agency’s legitimacy criteria, a company wishing to get a non-waste138Photo from http://www.globalventurelabels.com/the-environment/62
determination for a particular material must describe how the materials are processed, and submitits own supporting data on contaminant levels in its product to the EPA. The EPA then reviewsthese data, comparing data on contaminant levels in the material to a standard set of contaminationlevels in wood and coal that ranges from the lowest to the highest levels observed, an extraordinaryrange. If EPA deems contamination levels in the waste-derived fuel are comparable to those in coal(and sometimes even if they are not), the EPA issues a comfort letter to the company approving thereclassification of the material from “waste” to “fuel.”We reviewed several recently issued comfort letters, and concluded that the EPA review process issloppy. 139 For example, we found that the EPA trusts companies to test and provide data oncontaminants they expect to be present, and does not require similar materials to be tested forsimilar contaminants. Given the high contaminant concentrations presented by EPA as beingpresent in wood, against which the fuel products are supposed to be compared, it seems likely thatthe Agency has included contaminated wood as the baseline for measurement. However, thisrepresents circular reasoning, as it assumes that contaminated wood is already acceptable as fuel.We also noted that the ranges of values for contaminant concentrations in fuel vary wildly, and thatthe EPA’s estimate for formaldehyde content in wood, against which prospective fuels arecompared, is derived from a single unpublished memo from a single industry source. 140EPA signs off on a contaminated fuel product: phthalates and fluorine in SpecFUELIt seems likely that EPA’s process for transforming wastes to fuel, carried out far from public view,can easily lead to approval of contaminated materials as fuel. For instance, the waste disposalcompany Waste Management makes a product called “SpecFUEL,” which consists ofmostly paper and plastic compressed into cubes. The EPA comfort letter 141 to the company statesthat according to company-submitted data, “All contaminants in SpecFUEL are comparable to or lowerthan those contaminants in both coal and wood/biomass with the exceptions of antimony, fluorine, and bis(2-ethylhexl)phthalate. The latter is a synthetic chemical commonly referred to as DEHP and is used as aplasticizer in plastics, resins, consumer products, and building materials.”The DEHP that EPA refers to here is commonlyknown as phthalate, one of a recognizedendocrine disrupting class of chemicals that arebeing phased out in the European Union due toEPA has approved waste-derived fuelsthat contain phthalates, which are knownendocrine disruptorspotential health effects, including potential effects on development of reproductive organs inchildren. EPA’s own reference page on DEHP states, “Animal studies have reported increased lungweights and increased liver weights from chronic inhalation exposure to DEHP. Oral exposure has resulted in139Available at http://www.epa.gov/epawaste/nonhaz/define/140EPA’s memo titled “Contaminant concentrations in traditional fuels: Tables for comparison,” dates November 29, 2011 andavailable at http://www.epa.gov/osw/nonhaz/define/pdfs/nhsm_cont_tf.pdf, cites “Written communication from Tim Huntof American Forest & Paper Association to Jim Berlow of EPA, July 14, 2011” as the sole source for data on formaldehyde levelsin wood.141Letter to Ms. Kerry Kelly, Waste Management, from US EPA Office of Solid Waste and Emergency Response, August 22,2013. Available at http://www.epa.gov/epawaste/nonhaz/define/63
developmental and reproductive effects in rats and mice. A study by the National Toxicology Program (NTP)showed that DEHP administered orally increased the incidence of liver tumors in rats and mice. EPA hasclassified DEHP as a Group B2, probable human carcinogen.” 142Although a variety of the waste-derived fuels approved by EPA contain plastics, of the comfortletters we reviewed, the letter about SpecFUEL was the only one that referenced phthalatecontent. One large source of DEHP is the blue nitrile gloves used for medical exams and otherpurposes, suggesting that Waste Management may be using medical waste for making its SpecFUELproduct. Waste Management reported to EPA that the concentration of DEHP in SpecFUEL cubesis 240 – 1,410 parts per million, but because there are no data on levels of this contaminant in coalor wood to which the SpecFUEL levels could be compared, EPA simply declared that the fuel metthe legitimacy criterion for DEHP.Waste Management also reported the SpecFUEL concentration of fluorine, a toxic substanceemitted as hydrogen fluoride gas when burned, as 585 – 1,070 parts per million, significantlyexceeding the reported level in coal, which according to EPA’s data can reach 178 parts per million(Table 10). However, EPA glossed over the excessive fluorine content when it approved theSpecFUEL product, arguing that because combined, concentrations of fluorine and chlorine togetherwere within the ranges found for the most contaminated coals, the high fluorine content inSpecFUEL did not cause it to fail the legitimacy test.Table 10: Levels of fluorine in SpecFUEL exceed levels in coalHalogenUnitsAverageRangeSpecFUEL 1 Coal 1 Wood 1 SpecFUEL 2 Coal 2 Wood 2Chlorine ppm 2033 992 259 1840 - 2250 ND - 9080 ND - 5400Fluorine ppm 892 64 32.4 585 - 1070 ND - 178 ND - 300Total Halogens 3 ppm 2925 1056 291 2425 - 3320 ND - 9080 ND - 5497Notes:l. SpecFUEL data represents five samples taken on different days in January 2012, provided by WasteManagement on March 16, 2012..2. Data for coal and wood (i.e., clean wood and biomass materials) from a combination of EPA data andliterature sources, as presented in EPA document Contaminant Concentrations in Traditional Fuels: Tablesfor Comparison, November 29,2011, available at www.epa.gov/epawaste/nonhaz/define/index.htm.3 The high and low ends of each individual halogen's range do not necessarily add up to total halogensrange. This is because maximum and minimum concentrations for individual halogens do not alwayscome from the same sample.Table 10. Re-creation of Table 3 (“Contaminant Comparison, Total Halogens Group”) from EPA comfort letter toWaste Management, approving use of SpecFUEL as a “non-waste fuel product.”142http://www.epa.gov/ttnatw01/hlthef/eth-phth.html64
Another concern about burning plastic-based fuels like SpecFUEL is their dioxin emissions. Whilethe incinerator rule sets limits for dioxins, the boiler rule does not regulate dioxins directly (aninitial draft of the boiler rule did include direct limits on dioxins, but EPA removed these in thefinal rule, presumably due to objections from the bioenergy industry). Instead, the major sourceboiler rule regulates CO emissions as a proxy indicator of incomplete combustion, which can leadto dioxin formation. The CO limits in the major source boiler rule are extremely lax, and in anycase, almost irrelevant to the facilities we reviewed, since so few plants admitted to being majorsources for HAPs. The area source rule, which regulates the majority of the facilities we reviewed,contains no limit on dioxins or CO. The result of EPA’s new waste rule is that if waste-derivedfuels like SpecFUEL are burned in biomass units, there are no restrictions or accountability fordioxin emissions, or indeed for any HAPs other than HCl. According to the letter from EPA,Waste Management plants to build SpecFUEL plants all over the United States. 143Case study of a biomass power plant burning waste: Evergreen Community PowerThe 33 MW (gross) Evergreen Community Power/United Corrstack facility inReading, Pennsylvania is an example of the kinds of waste-burning biomass projects that EPArules encourage and the bioenergy industry wishes to promote. This combined heat and powerplant associated with United Corrstack, a paper product manufacturing company, cost $140 millionto build. It received a $39 million “clean”energy grant from the federal government atstartup. 144 An evaluation by the Departmentof Energy states that the fuel burned at theplant includes mostly wood, but that there are“significant amounts of paper, plastic and otherforeign debris” 145 (Figure 10 146 ). This fuel mixsuggests that the facility is actually anincinerator, although for reasons that areunclear, it was not permitted as one. TheDOE reported that the facility receives 41 –55 tractor trailer loads a day of fuel and burns300,000 – 350,000 tons per year. It generates~70,000 tons of toxic ash a year, which costs$2.45 million a year for disposal.Figure 10. The fuel burned at the Evergreen CommunityPower facility in Reading, Pennsylvania.143Letter to Ms. Kerry Kelly, Waste Management, from US EPA Office of Solid Waste and Emergency Response, August 22,2013. Available at http://www.epa.gov/epawaste/nonhaz/define/144The guidance for the Department of Treasury’s 1603(b) program, which converts the Incentive Tax Credit worth 30% ofconstruction costs to a cash grant, states that the program provides a long-term benefit of expanding the use of clean andrenewable energy and decreasing our dependency on non-renewable energy sources.”http://www.treasury.gov/initiatives/recovery/Documents/GUIDANCE.pdf145 U.S. Department of Energy, Mid-Atlantic Clean Energy Application Center. Evergreen Community Power Plant Case Study:33 MW Facility Using Biomass. November 16, 2011.146U.S. Department of Energy, Mid-Atlantic Clean Energy Application Center. Evergreen Community Power Plant Case Study:33 MW Facility Using Biomass. November 16, 2011.65
The Evergreen plant is located in the Ozone Transport Region, and federal air permittingapplicability thresholds were 100 tons when it was permitted, not 250 tons, but the plant projectedemitting no more than 98.7 tons of any pollutant, and thus avoided nonattainment New SourceReview permitting. 147 Evergreen was also permitted as an area source for HAPs, even though itwas permitted to burn municipal waste, demolition debris, railroad ties, and tire-derived fuel.Projected emissions of HAPs included 9.6 tons of HCl per year (just below the 10 tons per yearmajor source threshold) and a variety of heavy metals, including cadmium, cobalt, chromium,nickel, lead (over a ton per year), manganese, mercury (almost seven pounds per year), arsenic,and selenium. Total HAPs emissions were projected to be 23.9 tons per year, perilously close tothe 25-ton triggering threshold that facilities so wish to avoid. 148 The facility started operations in2009, and by 2010 had seen failure of its ash handling system, its sorbent injection system forcontrolling HCl, which had to be fully replaced, and its SCR system for controlling NOx. 149 Aninspection in 2010 found that the facility had failed to record continuous emissions data for somepollutants, and that the 30-day rolling average emissions rate for HCl, which was supposed to be0.005 lb/MMBtu to ensure the plant didn’t emit more than 10 tons, was actually 30 times higher,at 0.149 lb/MMBtu. 150 This rate, maintained over a year, would lead to emissions of over 300tons of HCl annually. As of 2010 and 2011, the facility was losing $15 million per year, eventhough the plant does not pay for fuel, but just its transportation. 151Needless to say, this was not how the company had represented its future operations. A write-upabout the plant from 2009 looks to the future, quoting David Stauffer, a vice-president of UnitedCorrstack. “Thanks to reduced emissions, the new plant will improve air quality. ‘For every megawatt ofelectricity we make, that electricity will be displacing a fossil fuel unit somewhere,’ Stauffer says. ‘When we fireup our 25 megawatts, 25 megawatts of coal fire goes down, which helps clean up the air.’” 152Conclusion: Seven recommendations for seven loopholesThe biomass energy industry is growing rapidly in the United States, but regulation has not keptpace – EPA and the states still treat bioenergy as a boutique industry, requiring special treatment,when in fact the industry is an increasingly large and bullying presence. As we found, bioenergy isdisproportionately polluting, both due to physical reasons, and due to loopholes and laxenforcement of the Clean Air Act by localities, states, and the EPA.147Plan approval application for the United Corrstack LLC Evergreen Community Power Project. Submitted to the PennsylvaniaDepartment of Environmental Protection, October, 2006.148Ibid.149Letter from Art McLaughlin, Site Manager for Evergreen Community Power, to Kenneth Hartzler, Pennsylvania Departmentof Environmental Protection, December 28, 2010.150Annual inspection verification report for minor facilities – United Corrstack, LLC. Date of inspection September 29, 2010.Submitted by William Borst, AQDS, to Pennsylvania Department of Environmental Protection.151 The facility anticipated receiving $500,000 in tipping fees in its first year of operation, but only collected $10,000.152 Ben Franklin Technology Partners website: “United Corrstack: Developing a co-generation plant to provide steam andelectricity to its manufacturing facility.” May 10, 2009. Accessed January <strong>2014</strong> at http://nep.benfranklin.org/united-corrstackdeveloping-a-co-generation-plant-to-provide-steam-and-electricity-to-its-manufacturing-facility/66
What can be done to reduce the threat of pollution from biomass power? Our analysis identifiedseven loopholes in clean air laws and their enforcement; here, we suggest how these loopholes canbe closed.Loophole 1: Biomass plants can emit more pollution before triggering federal permittingThe Clean Air Act requires a coal plant to go through federal Prevention of SignificantDeterioration permitting, including a best available control technology analysis and air qualitymodeling, if a facility emits 100 tons of a criteria pollutant per year. Biomass plants get to emittwo and a half times as much of each pollutant – 250 tons per year – before PSD permitting applies.The fix: Burning biomass for electricity produces as much or more of key pollutants as coal – sobiomass should be regulated like coal. EPA has the authority to require that biomass plants beadded to the list of pollution sources where PSD permitting is triggered at 100 tons. Biomasspower plants are big, polluting facilities that emit hundreds to thousands of tons of pollution eachyear. They should be regulated accordingly.Loophole 2: EPA’s free pass for bioenergy CO 2 lets large power plants avoid regulationThe EPA’s decision to not regulate bioenergy CO 2 under the Clean Air Act was deemed unlawfulby the U.S. Court of Appeals in 2013. The exemption has allowed a large number of plants toescape PSD permitting, thus doubling allowable pollution from this industry.The fix: EPA should regulate bioenergy CO 2 now. Once in the PSD program, facilities candiscuss how to reduce their net emissions of CO 2 during the consideration of best available controltechnology.Loophole 3: State regulators help biomass power plants avoid more protective permittingRegulators routinely accept even far-fetched permit limits for biomass facilities that claim they canmeet “synthetic minor” permit limits of 250 tons of each criteria pollutant per year. Avoiding PSDdoubles the pollution a plant is allowed to emit, and avoids air quality modeling that coulddetermine whether a facility will cause EPA health standards to be exceeded.The fix: If Loophole 1 were fixed, and PSD permitting was triggered at 100 tons of emissions,most biomass plants would have to go through PSD. Likewise, if EPA implemented the Court’sdecision and regulated bioenergy CO 2 , most plants emit more than 100,000 tons of CO 2 , alsotriggering PSD. Beyond those fixes, EPA should subject every power plant permit to federaloversight – especially those from states like Georgia, where regulators routinely issue syntheticminor source permits with the most minimal of conditions. It is going to take meaningful federaloversight to ensure these facilities set emissions limits that are federally enforceable, as the CleanAir Act requires.67
Loophole 4: Most biomass plants have no restrictions on hazardous air emissionsThe boiler rule, the part of the Clean Air Act that regulates emissions of hazardous air pollutants, isextremely weak. Area source plants, which constitute the majority of biomass facilities, have nolimits on emissions of hazardous air pollutants, and the MACT standard for PM (0.03 lb/MMBtu)is double the rate issuing from most BACT determinations. Major source facilities face only laxemissions standards on PM, CO, HCl, and mercury, standards that usually don’t require facilitiesto reduce their emissions at all.The fix: EPA should make the so-called Maximum Available Control Technology standardmeaningful, by setting standards as the Clean Air Act requires – standards that require themaximum degree of reduction of each HAP that is “achievable,” considering cost and otherstatutory factors. At a minimum, without regard to cost, they must reflect the emission level thatthe cleanest sources have achieved – sources that are using emission control technologies that areeffective and available, such as high-efficiency fabric filters that dramatically reduce particulatematter emissions. The biomass MACT should be made at least as protective as the standards forwaste incinerators and coal boilers – especially given that facility can be classified as biomass boilerseven when burning up to 90% coal, and when burning highly contaminated wastes.Loophole 5: The biomass industry lowballs estimates of toxic emissions to avoid regulationThere is an epidemic of biomass facilities claiming to be synthetic minor sources for hazardous airpollutants. Almost no matter what their boiler size, facilities claim they should be regulated as areasources of HAPs that emit less than 25 tons of HAPs per year, and less than 10 tons of anyindividual HAP. Our analysis determined that the commonly used emission factor provided by thesecretive industry group NCASI significantly under-represents typical emissions of hydrochloricacid, an important HAP. Using these industry emissions factors appears to lowball HAPs at thepermitting stage, under-representing actual emissions.The fix: EPA and the states should require that HAPs emissions are estimated at the permittingstage based on emissions factors that are transparently derived, with a generous margin for errorthat assumes emissions are likely to spike at the very times (such as startup and shutdown) whenthey are least likely to be measured. Most facilities are probably major sources for HAPs, andshould be regulated as such.Loophole 6: Weak testing requirements mean air toxics limits aren’t enforceableFacilities have been able to claim minor source status for HAPs with impunity because their permitscontain so few requirements for actual testing and ongoing monitoring of emissions, once the plantis operating.The fix: EPA’s recent decision on the Hu Honua permit states that if a facility wants to beregulated as a synthetic minor source (for criteria pollutants or HAPs) it must conduct testing thatrepresents its true emissions, including during startup and shutdown. The permit must be written68
to require such testing, otherwise it is not federally enforceable, and is thus invalid. For limits tobe truly enforceable, there should be ongoing monitoring with results revealed in real time, so thatstates and citizens can know when and if a facility is violating its permit.Loophole 7: EPA rules blur the line between biomass facilities and incineratorsEPA’s rules allow materials that are just as contaminated as coal – and in some cases, morecontaminated, as in the case of phthalate-containing “fuel cubes” – to be burned in biomass plants as“non-hazardous secondary materials,” instead of waste incinerators, where emissions are moretightly regulated. EPA is proposing to grant a blanket designation as non-hazardous forconstruction and demolition waste wood, which contains heavy metals like arsenic, lead, andmercury, and emits carcinogens like benzene, formaldehyde, and dioxins when burned.The fix: EPA needs to put people first – not the bioenergy industry, which has an inexhaustibleappetite for contaminated fuels, particularly materials they are paid to dispose of by burning. TheEPA should ensure that it does not create a loophole for unregulated waste incineration and that itprotects public health by ensuring that all waste burners – including those that label themselvesbiomass units – meet the protective standards that Congress enacted for waste burning.All around the country, communities are being faced with large biomass plants that are promoted as“clean and green” renewable energy. When people find out how much pollution these facilitiesemit, however, and the special treatment the bioenergy industry receives, they wonder why theirscarce renewable energy dollars are supporting an industry that can, literally, kill people with itsemissions. The data from the 88 permits we reviewed tells the story – again and again, biomassplants are allowed to emit more criteria pollutants and hazardous air pollutants, as well asgreenhouse gases, than fossil fueled plants or even waste burners. The majority of the biomassplants currently being built will burn some kind of waste materials, and it is increasingly difficultfor communities to protect themselves from toxic air pollution in light of the rollback on regulationat EPA now underway. It is time to take a clear-eyed look at what this bioenergy industry actuallyrepresents – the liquidation of pollution-emitting and often toxic materials into the atmosphere,where they are dispersed into the environment and the air we breathe. Across the board, it is timefor states and the federal government to stop promoting and supporting biomass power as “clean”energy, and recognize its real impacts.69
Summary case studies: the emerging bioenergy industryThe following are some representative examples of biomass power plants being proposed and builtaround the country. Information on facilities and the loopholes from which they benefit is takenfrom permits and permit application documents. Unlike the set of permits for new, “greenfield”facilities that we used for graphically demonstrating the differences between PSD facilities andsynthetic minor facilities (Figures 4 through 7), this list includes some biomass facilities thatpreviously burned fossil fuels.Sierra Pacific, Anderson, CAWhat: An existing facility that is increasing biomass-burning capacity. 468 MMBtu/hr stoker boiler;31 MW (gross)Estimated CO 2 emissions (tons per year): 401,890Permitted emissions (tons per year): NOx: 267 CO: 472 PM 10 total : 41 SO 2 : no limit setStatus for NOx, PM, and CO: Major source (PSD)Status for HAPs: Major sourceFuel: 25 bone dry tons/hour of: “a. Untreated wood pallets, crates, dunnage, untreatedmanufacturing and construction wood debris from urban areas; b. All agricultural crops orresidues; c. Wood and wood wastes identified to follow all of the following practices; i.Harvested pursuant-to an approved timber management plan prepared in accordance withthe Z'berg-Nejedly Forest practice Act of 1973 or other locally or nationally approved plan;ii. Harvested for the purpose of forest fire fuel reduction or forest stand improvement.”Construction and demolition wood or other waste allowed as fuel? YesUse of NCASI or other non-EPA factors to estimate HAPs? UnknownNotes: This air permit does not set a limit for SO 2 at all, and does not specify any means ofcontrolling emissions of HCl, as apparently, the major source limit of 0.022 lb/MMBtu forHCl under the boiler rule is so easily met, no controls are needed. The plant can emit up to45 tons of HCl under the major source limit. This permit is also notable in that it actuallyspecifies an emission rate for CO 2 , unusual for a bioenergy plant permit.DTE Stockton, Stockton, CAWhat: Refire of old coal plant to biomass. 699 MMBtu/hr stoker boiler; 54 MW (gross).Estimated CO 2 emissions (tons per year): 600,259Permitted emissions (tons per year): NOx: 108 CO: 248 PM 10 total : 58 SO 2 : 70Status for NOx, PM, and CO: Synthetic minor source (avoided PSD)Status for HAPs: Synthetic minor sourceFuel: “Biomass is defined as any organic material originating from plants, not chemically treated andnot derived from fossil fuels, including but not limited to products, by-products, andresidues from agriculture, forestry, aquatic and related industries, such as agricultural,energy or feed crops and residues, orchard and vineyard prunings and removal, stone fruitpits, nut shells, cotton gin trash, corn stalks and stover, straw, seedhulls, sugarcane leavingsand bagasse, aquatic plants and algae, cull logs, eucalyptus logs, poplars, willows,70
switchgrass, alfalfa, bark, lawn, yard and garden clippings, paper (unprinted), leaves,silvicultural residue, tree and brush pruning, sawdust, timber slash, mill scrap, wood andwood chips, and wood residue. Biomass does not include tires, material containing sewagesludge, or industrial, hazardous, radioactive, or municipal solid waste.”Construction and demolition wood or other waste allowed as fuel? YesUse of NCASI or other non-EPA factors to estimate HAPs? YesNotes: As a coal plant, this facility stopped operation in 2009. It is located in a highly polluted area,with “extreme” non-attainment status for ozone. Emissions from the new biomass boilertriggered offset requirements for emissions of NOx, SOx, PM 10 , and VOCs, but rather thanbeing compelled to obtain new offsets, the facility was allowed to treat the cessation ofprevious allowable emissions from the coal plant as mostly offsetting biopower emissions.Although the DTE Stockton boiler is about 50% larger than the boiler at the PSD-permittedSierra Pacific Anderson plant described in this report, the DTE plant claimed syntheticminor status to avoid PSD permitting.Plainfield Renewable Energy, Plainfield, CTWhat: 523 MMBtu/hr fluidized bed boiler; 37.5 MW (net)Estimated CO 2 emissions (tons per year): 449,207Permitted emissions (tons per year): NOx: 175 CO: 239 PM 10 fil : 84.8 SO 2 : 81.3Status for NOx, PM, and CO: Major source (PSD)Status for HAPs: Synthetic minor sourceFuel: 56.54 tons per hour of chipped trees, stumps, branches or brush as defined in RCSA 22a-208a-1; Recycled wood or clean wood, meaning any wood or wood fuel which is derivedfrom such products or processes as pallets skids, spools, packaging materials, bulky woodwaste or scraps from newly built wood products, provided such wood is not treated wood.[CGS 22a-209a][RCSA 22a-208a-1]; Processed Construction and Demolition wood,meaning processed wood from construction and demolition activities which has been sortedto remove plastics, plaster, gypsum wallboard, asbestos, asphalt shingles and wood whichcontains creosote or to which pesticides have been applied or which contains substancesdefined as hazardous under section CGS 22a-115. [CGS 22a-209a]; Other types if properlysized, clean, uncontaminated wood materials, such as sawdust, chips, bark, tree trimmingsor other similar materials. The plant is also allowed to burn up to 781 gal of biodiesel perhour, with no restrictions on number of hours that biodiesel can be burned.Construction and demolition wood or other waste allowed as fuel? YesUse of NCASI or other non-EPA factors to estimate HAPs? UnknownNotes: This permit requires the plant to burn “sorted” waste wood that has had contaminatedmaterials removed, but does not specify what level of contamination is acceptable, aproblem given that no sorting program can remove 100% of contaminated materials. Thepermit contains a requirement for initial testing for emissions of sulfuric acid, ammonia,arsenic, beryllium, cadmium, chromium, nickel, copper, benzene, titanium, formaldehyde,lead, manganese, mercury, dioxins (2,3,7,8-TCDD equivalents), selenium, hydrogenchloride, styrene, silver, and zinc. The permit also calls for the facility to meet certain71
emission limits for HAPs, but does not specify how those emission limits should be met, orwhether testing for all HAPs is required. The HAPs provisions in this permit thereforeappear to be unenforceable, although subsequent issuance of a Title V operating permit mayrectify this.Montville Power, Uncasville, CTWhat: 600 MMBtu/hr stoker boiler when firing biomass; 42 MW (net). Can convert to distillate oilor gas for up to 995 MMBtu/hr and 82 MW (net).Estimated CO 2 emissions (tons per year): 515,244 (when firing biomass)Permitted emissions (tons per year): NOx: 158 CO: 263 PM 10 fil : 31.5 SO 2 : 65.7Status for NOx, PM, and CO: Major source (PSD)Status for HAPs: Presumably majorFuel: Chipped trees, stumps, branches or brush. Recycled wood or clean wood, meaning any woodor wood fuel which is derived from such products or processes as pallets skids, spools,packaging materials, bulky wood waste or scraps from newly built wood products, providedsuch wood is not treated wood. Other Clean Wood, if properly sized, clean,uncontaminated wood materials, such as sawdust, chips, bark, tree trimmings or otherorganic based materials.Construction and demolition wood or other waste allowed as fuel? YesUse of NCASI or other non-EPA factors to estimate HAPs? UnknownNotes: This permit requires the facility to meet emissions standards for a long list of air toxicsoutlined in Connecticut regulations, but only specifies testing for HCl and ammonia, whichwhile toxic, is not considered to be a hazardous air pollutant. The permit therefore appearsto be unenforceable, although subsequent issuance of a Title V operating permit may rectifythis.Gainesville Renewable Energy, Gainesville, FLWhat: 1,359 MMBtu/hr fluidized bed boiler; 116 MW (gross), 100 MW (net)Estimated CO 2 emissions (tons per year): 1,167,000Permitted emissions (tons per year): NOx: 416 CO: 714 PM 10 fil : 58 SO 2 : 172.6Status for NOx, PM, and CO: Major source (PSD)Status for HAPs: Initially permitted as area source; may be re-permitted as major sourceFuel: “Tops, limbs, whole tree material and other residues from soft and hardwoods that result fromtraditional silvicultural harvests; Saw dust, bark, shavings and kerf waste fromcutting/milling whole green trees; fines from planning kiln-dried lumber; wood wastematerial generated by primary wood products industries such as round-offs, end cuts,sticks, pole ends; and reject lumber as well as residue material from the construction ofwood trusses and pallets. Tops, limbs, whole tree material and other residues that resultfrom the cutting or removal of certain, smaller trees from a stand to regulate the number,quality and distribution of the remaining commercial trees; and forest understory which72
includes smaller trees, bushes and saplings. Tops, limbs, whole tree material and otherresidues that are damaged due to storms, fires or infectious diseases. Tree parts and/orbranches generated by landscaping contractors and power line/roadway clearancecontractors that have been cut down for land development or right-ofway clearingpurposes. Wood derived from used pallets packing crates; and dunnage disposed bycommercial or industrial users. Herbaceous plant matter; clean agricultural residues (i.e.,rice hulls, straw, etc.; no animal wastes or manure); and whole tree chips and pulpwoodchips.”Construction and demolition wood or other waste allowed as fuel? NoUse of NCASI or other non-EPA factors to estimate HAPs? YesNotes: Early in the permit application process, this massive plant applied as a major source forHAPs, but subsequent revisions claimed it would emit less than 25 tons of HAPs, and thefacility was ultimately permitted as an area source. Now, a pending and potential permitrevision filed in February <strong>2014</strong> seeks to regulate the facility under the major source boilerrule, 153 after all, although this re-permitting process is currently suspended. If the plant isre-permitted as a major source for HAPs, its allowable filterable PM emissions will decreaseunder the major source MACT for bubbling fluidized bed boilers, from 0.015 lb/MMBtu to0.0098 lb/MMBtu. This change would reduce permitted emissions of filterable PM from89 tons to 58 tons per year.Green Energy Partners, Lithonia, GAWhat: Two stoker boilers of 93.22 MMBtu/hr; 11.5 MW (net).Estimated CO 2 emissions (tons per year): 160,103Permitted emissions (tons per year): NOx: 25 CO: 249 PM 10 fil : 24 SO 2 :8.1Status for NOx, PM, and CO: Synthetic minor source (avoided PSD)Status for HAPs: Synthetic minor sourceFuel: “Biomass shall consist of wood wastes in chip or in shredded form from timber harvesting,pre-commercial thinning of forest plantation stands, harvesting non-commercial, dead ordeformed species for fuel purposes and land clearing activities (limbs, tops, stumps andnon-commercial trees), and may also include peanut hulls, pecan shells, cotton stalks,lumber and pallet wood wastes (unpainted/untreated only) and similar woody biomass. “Construction and demolition wood or other waste allowed as fuel? YesUse of NCASI or other non-EPA factors to estimate HAPs? YesNotes: This plant is being built in the Atlanta metro area, which is out of attainment with EPA’s airquality standard for PM and ozone. It is proposing to use a ceramic filter system for controlof NOx and PM, a technology unique to this facility. Permitted as a synthetic minorsource, the company has avoided measures that could be taken to reduce emissions. Likealmost all the biomass plants that have received air permits in Georgia in recent years, the153Gainesville Renewable Energy Center. Initial Title V air operation permit application filed with Florida Department ofEnvironmental Protection. February 10, <strong>2014</strong>.73
company was permitted to use non-EPA emissions factors for HAPs, which dramaticallyunderestimate emissions compared to the EPA-sanctioned emissions factors.North Star Jefferson, Wadley, GAWhat: 312 MMBtu/hr fluidized bed boiler; 25 MW (gross).Estimated CO 2 emissions (tons per year): 275,000Permitted emissions (tons per year): NOx: 249 CO: 249 PM 10 fil : 21 SO 2 : 249Status for NOx, PM, and CO: Synthetic minor source (avoided PSD)Status for HAPs: Synthetic minor sourceFuel: wood, shredded tiresConstruction and demolition wood or other waste allowed as fuel? Initially yes; as permitted, no.Use of NCASI or other non-EPA factors to estimate HAPs? YesNotes: The facility is located in an area with large existing pollution sources, including woodburners.No pre-construction air quality modeling has been conducted. It is beingdeveloped by a pro-forestry non-profit organization, the U.S. Endowment for Forestry andCommunities, but the developer has stated that burning tires is important to the success ofthe facility. As for other biomass facilities permitted in Georgia, this facility used non-EPAsanctioned emissions factors to come to the conclusion that it is a minor source for HAPs.Initial stack tests are required to establish emissions rates for certain HAPs.Piedmont Green Power, Barnesville, GAWhat: 657 MMBtu/hr stoker boiler; 54.5 MW (net).Estimated CO 2 emissions (tons per year): 564,192Permitted emissions (tons per year): NOx: 228 CO: 227 PM 10 fil : 86 SO 2 : not specStatus for NOx, PM, and CO: Synthetic minor source (avoided PSD)Status for HAPs: Synthetic minor sourceFuel: “Biomass shall consist of wood wastes in chip or in shredded form from timber harvesting,pre-commercial thinning of forest plantation stands, harvesting non-commercial, dead ordeformed species for fuel purposes and land clearing activities (limbs, tops, stumps andnon-commercial trees), and may also include peanut hulls, pecan shells, cotton stalks,lumber and pallet wood wastes (unpainted/untreated only) and similar woody biomass.”Construction and demolition wood or other waste allowed as fuel? YesUse of NCASI or other non-EPA factors to estimate HAPs? YesNotes: While this facility claims to be a synthetic minor source for HAPs, and the permit states thatpotential emissions of HAPs are greater than 25 tons, the permit contains no testingrequirements other than a one-time test for HCl. The permit would thus likely be deemedunenforceable under Clean Air Act requirements, although the omission might be rectifiedwhen the Title V operating permit is issued. This facility was awarded $49.5 million in“clean” energy funding from the federal government, as a 1603b award that converts thefederal renewable energy incentive tax credit to a cash grant.74
Hu Honua, Pepe’ekeo, HIWhat: Refire of old coal plant. 407 MMBtu/hr stoker boiler; 23.8 MW gross, 21.5 MW netEstimated CO 2 emissions (tons per year): 349,507Permitted emissions (tons per year): NOx: 210 CO: 246 PM 10 fil : 21.4 SO 2 : 39.2Status for NOx, PM, and CO: Synthetic minor source (avoided PSD)Status for HAPs: Synthetic minor sourceFuel: wood, biodieselConstruction and demolition wood or other waste allowed as fuel? NoUse of NCASI or other non-EPA factors to estimate HAPs? YesNotes: This facility took synthetic minor status for criteria pollutants and HAPs. EPA commentedon this permit, observing that it was unlikely that a facility this size could stay below its COcap, and observing that the use of non-EPA sanctioned emission factors for calculatingHAPs emissions needed to be justified. As allowed by the Clean Air Act, a citizen grouppetitioned the EPA to formally object to the permit, and EPA has responded, agreeing thatas written, the pollution limits are not enforceable. This decision is significant because EPAhas made it clear that actual emissions testing for both criteria air pollutants and HAPs mustbe conducted under a variety of operating conditions for a facility to be able to claim andmaintain synthetic minor source status. Many permits for bioenergy facilities being issuedaround the country do not contain these requirements, particularly for HAPs, and aretherefore likely unenforceable under the terms of the Clean Air Act.ecoPower, Hazard, KYWhat: 745 MMBtu/hr fluidized bed boiler; 58 MWEstimated CO 2 emissions (tons per year): 577,073Permitted emissions (tons per year): NOx: 240 CO: 240 PM 10 fil : 240 SO 2 : 240Status for NOx, PM, and CO: Synthetic minor source (avoided PSD)Status for HAPs: Synthetic minor sourceFuel: Hardwood tree stems removed during pre-commercial thinning operations. Storm and firedamaged hardwood trees and tree parts. Low quality hardwood logs and hardwood blocksthat are trimmed in the production of sawlogs. Hardwood wood industry byproducts suchas shavings, saw dust, bark, and similar materials that do not contain preservatives, resins,or other additives. Low quality hardwood logs and hardwood wood chips produced duringright-of-way operations and urban forestry operations. Unrecyclable untreated hardwoodpallets, untreated lumber, and dunnage.Construction and demolition wood or other waste allowed as fuel? YesUse of NCASI or other non-EPA factors to estimate HAPs? YesNotes: An early draft of the air permit classified the facility as a major source for HAPs that wouldemit over 35 tons per year. The final version of the permit reduced the amount of HAPs to7.71 tons. The applicant achieved the reduction in estimated HAPs by making up their ownHAPs emissions factors, and only counting certain HAPs toward total emissions. Provisionsrequiring stack testing were removed in the final version of the permit, so the HAPs limitsare unenforceable at this point.75
Verso Bucksport, Bucksport, MEWhat: 814 MMBtu/hr stoker boiler; 25 MW (gross)Estimated CO 2 emissions (tons per year): 699,014Permitted emissions (tons per year): NOx: 476.3 CO: 952.7 PM 10 fil : 95.3 SO 2 : 243.9Status for NOx, PM, and CO: Major sourceStatus for HAPs: Presumably a major source; permit makes no mention of HAPs.Fuel: “Fuel oil (including fuel oil, off-specification waste oil, and specification waste oil), naturalgas, and biomass (including wood waste, wood chips, bark, mill waste treatment sludge,paper roll core ends, and waste papers).”Construction and demolition wood or other waste allowed as fuel? YesUse of NCASI or other non-EPA factors to estimate HAPs? UnknownNotes: Located immediately adjacent to homes and schools, the Verso Bucksport paper millexpanded its biomass-burning capabilities to 25 MW to take advantage of renewable energycredits available in the Northeast. Although the facility went through a BACT analysis, itsemission rate for PM (at 0.03 lb/MMBtu) is highly permissive, double what other BACTpermittedplants and coal plants achieve. At 0.3 lb/MMBtu, the 24-hr allowable NOxemissions rate is also more than triple the limit at other PSD- permitted plants. The facilitydoes not use any sorbent system to reduce hydrochloric acid emissions.Burgess Biopower, Berlin, NHWhat: 1,013 MMBtu/hr bubbling fluidized bed boiler; 70 MW (gross)Estimated CO 2 emissions (tons per year): 869,903Permitted emissions (tons per year): NOx: 244.5 CO: 307.3 PM 10 fil : 40.9 SO 2 : 48.7Status for NOx, PM, and CO: Major sourceStatus for HAPs: Major sourceFuel: “Whole tree wood chips and other low-grade clean wood”Construction and demolition wood or other waste allowed as fuel? NoUse of NCASI or other non-EPA factors to estimate HAPs? UnknownNotes: Located at the site of an old pulp mill, this facility is immediately adjacent to homes andschools. It is the largest wood-burning plant in the Northeast. The permit specifies that theplant will burn about 113 tons of wood chips per hour, which will be sourced primarilyfrom whole trees. This facility admitted to being a major source for HAPs, in contrast toanother all “clean” wood plant, the 100 MW (net) Gainesville Renewable Energy Center,which claimed to be an area source.ReEnergy Lyonsdale Biomass, Lyons Falls, NYWhat: 290 MMBtu/hr stoker boiler; 19 MW (net)Estimated CO 2 emissions (tons per year): 243,882Permitted emissions (tons per year): NOx: 249 CO: 249 PM 10 fil : ~124 SO 2 : “Less than10 tons”Status for NOx, PM, and CO: Synthetic minor source (avoided PSD)76
Status for HAPs: Synthetic minor sourceFuel: Unadulterated wood, up to 30% pallets; also non-recyclable fibrous material such as waxcardboard in combination with other fuels in quantities up to and equal to 30% by weight ofthe boiler's fuel feed. Non-recyclable fibrous material may be in the form of pellets,extrusions, chips, shreds, or other shapes that provide suitable fuel management capability.Construction and demolition wood or other waste allowed as fuel? YesUse of NCASI or other non-EPA factors to estimate HAPs? UnknownNotes: While the permit clearly authorizes the facility to burn waste materials, the company’swebsite states that the plant “provides sustainable electricity from responsibly harvested green forestresidue biomass, and unadulterated wood. This permit exploits an obscure loophole in the lawthat allows it to specify a filterable particulate matter emission rate of 0.1 lb/MMBtu. Thefacility is required to do one stack test for PM every five years to demonstrate compliance.The permitted NOx emission rate of 0.2 lb/MMBtu is about three times higher than therate at plants that go through a BACT analysis. The permit contains no limits on HClemissions and no sorbent system is specified in the permit. This is a Title V permit with nofirm testing requirements to establish and maintain its synthetic minor source status forHAPs, suggesting that it is unenforceable.ReEnergy Black River, Fort Drum, NYWhat: Refire of existing old coal plant. Three circulating fluidized bed boilers, 284 MMBtu/hreach; 60 MW (gross)Estimated CO 2 emissions (tons per year): 658,274Permitted emissions (tons per year): NOx: 538.5 CO:234.1 PM 10 fil : 52 SO 2 : 696.3Status for NOx, PM, and CO: Major sourceStatus for HAPs: Synthetic minor sourceFuel: “The proposed fuels to be combusted are clean wood, unadulterated wood from C+D debris,glued wood creosote treated wood, tire derived fuel and non-recyclable fibrous material(waste paper).”Construction and demolition wood or other waste allowed as fuel? YesUse of NCASI or other non-EPA factors to estimate HAPs? UnknownNotes: This facility is allowed to burn a number of waste-derived fuels. Its testing requirements forfuel state “ReEnergy shall employ the "grid test" which consists of a 10 by 10 grid placed over thewood stream and checked to determine the percentage of glued wood, treated/painted wood, and nonwoodmaterials. If it is determined that the percentage of glued wood is between 0 and 1.0% byvolume, then the percentage of glued wood for that load is 1%. If it is determined that the percentageof glued wood is between 1% and 20% by volume, the percentage of glued wood for that load is 20%.If it is determined that the percentage of glued wood is greater than 20% by volume, then the load isconsidered to 100% glued wood. This method shall be employed once every 5 loads per supplier.” Thisis a Title V permit with no firm testing requirements to establish and maintain its syntheticminor source status for HAPs, suggesting that it is unenforceable.77
Biogreen Sustainable Energy, La Pine, ORWhat: 353 MMBtu stoker boiler, 24.9 MW (net)Estimated CO 2 emissions (tons per year): 303,135Permitted emissions (tons per year): NOx: 232 CO:247 PM 10 fil : 46 SO 2 : 39Status for NOx, PM, and CO: Synthetic minor source (avoided PSD)Status for HAPs: Synthetic minor sourceFuel: “Wood in the form of hog fuel, bark, and chips, forest management residue (slash), woodfrom yard debris , and construction and demolition wood materials will be used as fuel forthe boiler. The facility will not bum wood by-products that contain plywood or resinmaterials. Less than 20% of the heat input to the boiler on an annual basis will come fromyard debris and construction and demolition materials”Construction and demolition wood or other waste allowed as fuel? YesUse of NCASI or other non-EPA factors to estimate HAPs? YesNotes: The facility’s website 154 states, “Creating clean energy from local forests,” but a significantportion of the plant’s fuel will come from construction and demolition waste. This permitcontains a requirement to test HCl emissions to ensure its emission factor is valid, but doesnot contain any requirement to test for other HAPs, suggesting it is unenforceable.Evergreen Community Power/United Corrstack, Reading, PAWhat: 482 MMBtu/hr stoker boiler; 33 MW (gross)Estimated CO 2 emissions (tons per year): 414,000Permitted emissions (tons per year): NOx: 96 CO: 99 PM 10 fil : 96 SO 2 : 92Status for NOx, PM, and CO: Synthetic minor source (avoided PSD)Status for HAPs: Synthetic minor sourceFuel: Wood, construction waste, municipal wasteConstruction and demolition wood or other waste allowed as fuel? YesUse of NCASI or other non-EPA factors to estimate HAPs? YesNotes: See section above for details on this plant.Nacogdoches Power, Sacul, TXWhat: 1,374 MMBtu bubbling fluidized bed boiler, 116 MW (gross).Estimated CO 2 emissions (tons per year): 1,179,908Permitted emissions 155 (tons per year): NOx: 602 CO: 903 PM 10 total : 192.6 SO 2 : 274Status for NOx, PM, and CO: Major source (PSD)Status for HAPs: Major sourceFuel: 1.4 million tons a year of “biomass materials in the form of forest residue (primarily residualtops and limbs of trees, unutilized cull trees, and slash), and mill residue (includingsawdust). Whole tree wood chips may also be used as fuel.”154http://biogreenenergyco.com/155Calculated from permitted rates, as no limits for total tons are specified in permit.78
Construction and demolition wood or other waste allowed as fuel? Yes – “clean municipal wood waste”Use of NCASI or other non-EPA factors to estimate HAPs? UnknownNotes: This is the sister plant to the Gainesville Renewable Energy Center in Florida, which claimsto be a minor source for HAPs although it was permitted as a major source. TheNacogdoches plant was permitted as a major source, with permitted emissions of 126 tonsof HCl per year.EDF Allendale, Allendale, SCWhat: New facility; 275 MMBtu/hr stoker; 21 MW gross, 17.5 MW netEstimated CO 2 emissions (tons per year): 236,153Permitted emissions (tons per year): NOx: 241 CO: 250 PM 10 fil : 36 SO 2 : 30.1Status for NOx, PM, and CO: Synthetic minor source (avoided PSD)Status for HAPs: Synthetic minor sourceFuel: The boiler is permitted to burn only clean, untreated wood waste as fuel. Clean wood isdefined in SC Regulation 61-62.1 as untreated wood or untreated wood products includingclean untreated lumber, tree stumps (whole or chipped), and tree limbs (whole orchipped). Clean wood does not include yard waste, or construction, renovation, anddemolition waste (including but not limited to railroad ties and telephone poles). The useof any other substances, including yard waste and construction, renovation and demolitionwaste, as fuel is prohibited without prior issuance of a construction permit revision fromthe Bureau of Air Quality.Construction and demolition wood or other waste allowed as fuel? NoUse of NCASI or other non-EPA factors to estimate HAPs? YesNotes: This permit would be a major source for HAPs if AP-42 emission factors had been used tocalculate emissions instead of a combination of NCASI and other factors. This facility has atwin which has also recently come online, the EDF Dorchester plant in Harleyville, SC.Dominion Energy, Southampton, Altavista, and Hopewell, VAWhat: Three 63-MW coal plants being converted to 51 MW biomass plants: Altavista (Altavista,VA), Hopewell (Hopewell, VA) and Southampton (Franklin, VA)Estimated CO 2 emissions (tons per year): 2,030,060 (three facilities)Permitted emissions (tons per year): NOx: 412 (x 3) = 1,236 CO: 916 (x 3) = 2,748PM 10 fil : 59.6( x 3) = 178.7 SO 2 : 38.2 (x 3) = 114.6Status for NOx, PM, and CO: Major sources (PSD)Status for HAPs: Unknown.Fuel: Three permits; two specify use of 785,480 tons of wood a year and no contaminated wood;one permit (Southampton) allows use of 5,879,518 gal/yr distillate fuel oil. “Biomassmeans those residuals that are akin to traditional cellulosic biomass including forest-derivedbiomass (e.g., green wood, forest thinnings, clean and unadulterated bark, sawdust, trim,and tree harvesting residuals from logging and sawmill materials) wood collected fromforest fire clearance activities, trees and clean wood found in disaster debris, and clean79
iomass from land clearing operations, each as specified in the definition of Clean CellulosicBiomass in 40 CFR 241.2, excluding any wood which contains chemical treatments or hasaffixed thereto paint and/or finishing materials or paper or plastic laminates. Approvedbiomass is biomass that does not contain contaminants at concentrations not normallyassociated with virgin biomass materials.”Construction and demolition wood or other waste allowed as fuel? NoUse of NCASI or other non-EPA factors to estimate HAPs? YesNotes: While initial stack testing is required to determine emissions of SO 2 , NOx, CO, VOCs,sulfuric acid mist, and hydrogen fluoride, there is no stack testing required for HCl or otherHAPs. Requirements for HAPs testing may be included when Title V operating permits forthe plants are issued.Nippon Paper, Port Angeles, WAWhat: Facility expansion; 420 MMBtu/hr stoker; ~20 MW net (cogen, uses some thermal energy)Estimated CO 2 emissions (tons per year): 360,670Permitted emissions (tons per year): NOx: 184 CO: 644 PM 10 fil : 2 SO 2 : 152Status for NOx, PM, and CO: Major sourceStatus for HAPs: Major source (PSD)Fuel: “Approved Cogeneration Plant Fuels: The Permittee shall burn only clean woody biomass,recycled wood-derived fuel, dewatered wastewater treatment sludge, natural gas, and ultralow sulfur diesel fuel in the cogeneration plant. For the purpose of this order: a. Cleanwoody biomass, also known as hog fuel or hogged fuel, is defined is any woody materialthat meets the definition of clean cellulosic biomass in §241.2. b. Recycled wood-derivedfuel is defined as any woody, non-hazardous secondary material that has been declared nonwasteby the standards and procedures outlined in §241.3. c. Dewatered wastewatertreatment sludge is defined as clarifier sludge consisting largely of pulp and paper fibers andproduced on site that has been declared non-waste by the standards and procedures outlinedin §241.3. d. Natural gas means any fuel defined as natural gas in §63.7575, includingpropane and LPG. e. Ultra low sulfur diesel fuel means fuel oils containing less than 0.05weight percent nitrogen and less than 0.0015 weight percent sulfur that comply with thespecifications for fuel oils numbers 1 and 2 as defined by ASTM D396 or diesel fuelnumbers 1 and 2 as defined by ASTM D975. Ultra low sulfur fuel oil may contain anypercentage of biodiesel that complies with the specifications in ASTM 6751, provided thenitrogen and sulfur limits are met by the liquid fuel mixture.”Construction and demolition wood or other waste allowed as fuel? YesUse of NCASI or other non-EPA factors to estimate HAPs? YesNotes: Located on the Olympic Peninsula, about 31 miles from the Port Townsend PaperCompany, this facility was required to reduce emissions of air toxics more than most otherfacilities we reviewed, but as it burns a variety of contaminated fuels, including papermakingsludge, its emissions of air toxics are likely to be high. The company is required byits permit to develop a fuel monitoring plan and test fuel analyze for chlorine and mercurycontent. It is supposed to ensure that “recycled wood derived fuel” meets a quality80
assurance plan. The plant was permitted as a major source of HAPs before the significantlyweakened version of the boiler rule that exists today, and was required to meet a filterablePM emission limit of 0.0011 lb/MMBtu (the current MACT standard for major sourceboilers is 0.03 lb/MMBtu, which is 27 times higher). The filterable PM limit explains therelatively low estimated emissions of 2 tons per year from the plant. The permit also setslimits for emissions of acrolein, ammonia, benzene, formaldehyde, hydrogen chloride(HCl) mercury, and dioxins/furans. Initial and “intermittent” stack tests are required toensure compliance (once per permit term, or every five years). The plant is also requiredto install a continuous emissions monitoring system for PM, which is unusual for thepermits we reviewed.Port Townsend Paper Company, Port Townsend, WAWhat: Facility expansion; 414 MMBtu/hr stoker; ~24 MW net (cogen, uses some thermal energy)Estimated CO 2 emissions (tons per year): 355,518Permitted emissions (tons per year): NOx: 262 CO: 635 PM 10 fil : 36.4 SO 2 : 96Status for NOx, PM, and CO: Major source (PSD)Status for HAPs: Synthetic minor sourceFuel: “Wood fuels including hog fuel, forest biomass, and urban wood. Ecology does not currentlyclassify these wood fuels as solid waste. Wood fuels do not include wood treated withcreosote, pentachlorophenol, or copper-chrome-arsenic; or municipal waste. Forestbiomass means the by-products of current forest management activities, current forestprotection treatments authorized by the agency, or the by-products of forest healthtreatment prescribed or permitted under Washington's forest health law. Forest biomassdoes not include municipal solid waste. Urban wood is purchased wood fuel meeting anacceptance program which prohibits wood treated with creosote, pentachlorophenol, orcopper-chrome-arsenic; municipal waste, hazardous material contaminants (asbestos, lead,mercury), lead painted items, and plastic coatings.” (Urban wood is demolition waste. PortTownsend Paper's fuel also includes reprocessed fuel oil (about 15% of total fuel) andcorrugated cardboard recycling rejects ("OCC rejects"), meaning corrugated boxes that aretoo contaminated with labels, fasteners, etc., to recycle. PTPC uses approximately onethirdof Washington’s recycled cardboard.Construction and demolition wood or other waste allowed as fuel? YesUse of NCASI or other non-EPA factors to estimate HAPs? YesNotes: Unlike the Nippon Paper plant at Port Angeles, which was issued by the Olympic RegionClean Air Agency in Washington, the permit for this facility was issued by the WashingtonDepartment of Ecology and contains relatively few protective measures, even though it is alarger facility than the Nippon plant. Emissions calculations that were used to justify theexpansion of biomass burning at the facility include reductions from installing futureemissions control equipment that will be required by law regardless of whether the biomassproject is built or not. The proposed expansion will increase fuel throughput to 2.9 timesthe present amounts.81