

222 - SERDP-ESTCP
222 - SERDP-ESTCP
222 - SERDP-ESTCP
- No tags were found...

You also want an ePaper? Increase the reach of your titles
YUMPU automatically turns print PDFs into web optimized ePapers that Google loves.
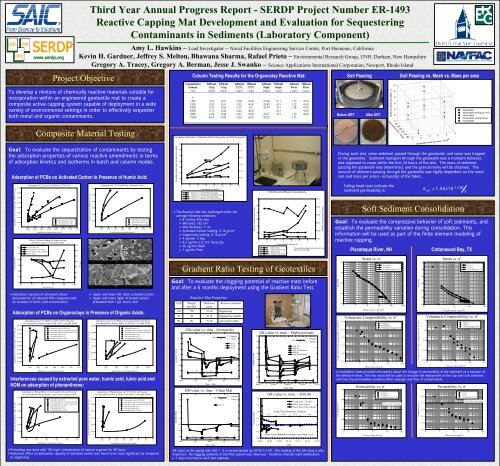
Third Year Annual Progress Report - <strong>SERDP</strong> Project Number ER-1493Reactive Capping Mat Development and Evaluation for SequesteringContaminants in Sediments (Laboratory Component)Soil-GeotextileSoilSoil GeotextileSoilSoil GeotextileSoilAmy L. Hawkins – Lead Investigator – Naval Facilities Engineering Service Center, Port Hueneme, CaliforniaKevin H. Gardner, Jeffrey S. Melton, Bhawana Sharma, Rafael Prieto – Environmental Research Group, UNH, Durham, New HampshireGregory A. Tracey, Gregory A. Berman, Jesse J. Swanko – Science Applications International Corporation, Newport, Rhode IslandProject ObjectiveTo develop a mixture of chemically reactive materials suitable forincorporation within an engineered geotextile mat to create acomposite active capping system capable of deployment in a widevariety of environmental settings in order to effectively sequesterboth metal and organic contaminants.Composite Material TestingGoal: To evaluate the sequestration of contaminants by testingthe adsorption properties of various reactive amendments in termsof adsorption kinetics and isotherms in batch and column modes.Adsorption of PCBs on Activated Carbon in Presence of Humic Acid:Adsorbed 2,2',4,4',5,5'-hPCB (mg)/ CETCO OC (g)% Adsorbed PCB0.070.060.050.040.030.020.010.00120110100908070Adsorption of 2,2',4,4',5,5'-hPCB on CETCO OC0.000 0.002 0.004 0.006 0.008 0.010 0.012 0.014Equilibrium concentration (mg/L)Effect of different loadings of humic acid onadsorption capacity of activated carbon% adsorbed 2-cbp% adsorbed 2,2',5,5'-tPCB% adsorbed 2,2',4,4',5,5'-hPCBHumic acidAdsorption on CETCO OCPreloading effect of HADesorption effect of HA600.01 0.1 1 10 100 1000HA (g)/ AC (g)‣Adsorption capacity of activated carbondecreased for all selected PCB congeners withan increase in humic acid concentration121086420Adsorption of 2,2',5,5'-tPCB on Activated Carbon0.00 0.02 0.04 0.06 0.08 0.10 0.12 0.14Equilibrium concentration (mg/L)Adsorption of PCBs on Organoclays in Presence of Organic Acids:Adsorbed 2,2',5,5,'-tPCB (mg)/ CETCO OC (g)0.0180.0160.0140.0120.0100.0080.0060.0040.0020.000Adsorption of 2,2',5,5'-tPCB on CETCO OC in Presenceof Extracted Pore Water, Humic Acid, Fulvic Acid and NOMAdsorption on bare CETCO OCPreloading effect of extracted Passaic PWPreloading effect of extracted Hudson PWPreloading effect of HAPreloading effect of FAPreloading effect of NOM0.00 0.02 0.04 0.06 0.08 0.10 0.12Equilibrium concentration (mg/L)HA (g/L)Adsorbed 2,2',5,5'-tPCB (mg)/ AC (g)0.50.40.30.20.10.010,000 X 10,000 X1000 X 1000 XAdsorption on bare ACPreloading effect of HADesorption effect of HA‣ Upper and lower left: Bare activated carbon‣ Upper and lower right: Activated carbonpreloaded with 1 g/L humic acidAdsorbed 2,2',5,5'-tPCB (mg)/ AC (g)0.0250.0200.0150.0100.0050.000Adsorption of 2,2',5,5'-tPCB on Activated Carbon in Presenceof Extracted Pore Water, Humic Acid, Fulvic Acid and NOMEquilibrium concentration (mg/L)Adsorption on bare ACPreloading effect of extracted Passaic PWPreloading effect of extracted Hudson PWPreloading effect of HAPreloading effect of FAPreloading effect of NOM0.00 0.02 0.04 0.06 0.08Interferences caused by extracted pore water, humic acid, fulvic acid andNOM on adsorption of phenanthrene:Adsorbed Phenanthrene (mg)/ AC (g)0.100.080.060.040.020.00Adsorption of Phenanthrene on Activated Carbon in Presenceof Extracted Pore Water, Humic Acid, Fulvic Acid and NOMEquilibrium concentration (mg/L)Adsorption on bare ACPreloading effect of extracted Passaic PWPreloading effect of extracted Hudson PWPreloading effect of HAPreloading effect of FAPreloading effect of NOM0.0 0.1 0.2 0.3 0.4 0.5Adsorbed Phenanthrene (mg)/ CETCO OC (g)0.250.200.150.100.050.00Adsorption of Phenanthrene on CETCO OC in Presenceof Extracted Pore Water, Humic Acid, Fulvic Acid and NOMAdsorption on bare CETCO OCPreloading effect of extracted Passaic PWPreloading effect of extracted Hudson PWPreloading effect of HAPreloading effect of FAPreloading effect of NOM0.0 0.2 0.4 0.6 0.8 1.0 1.2 1.4Equilibrium concentration (mg/L)‣Preloading was done with 100 mg/L concentration of natural organics for 48 hours‣Reduction effect on adsorption capacity of activated carbon was found to be more significant as comparedto organoclayColumn Testing Results for the Organoclay Reactive Mat:Cumulative Adsorption of Selected PAH Compounds and PCB CongenersCumulative Adsorbed Concentration (mg/g)Gradient Ratio Testing of GeotextilesGoal: To evaluate the clogging potential of reactive mats beforeand after a 6 months deployment using the Gradient Ratio Test.Reactive Mat PropertiesAOS Weight Thickness Reactive material[oz/yd 2 ] [cm]170 170 ~0.10 Organoclay70 70 ~0.10 Organoclay/Apatite80 80 ~0.10 Activated CarbonGradient RatioGradient Ratio1210864202.01.81.61.41.21.00.80.60.42.01.81.61.41.21.00.80.60 2 4 6 8 10 12 14Cumulative Volume (L)Volume (L) vs 2 CBP adsorbed (mg/g)Volume (L) vs Naphthalene adsorbed (mg/g)Volume (L) vs 2,2',5,5' adsorbed (mg/g)Volume (L) vs Phanthrene adsorbed (mg/g)‣The Reactive Mat was challenged under theaverage following conditions‣ 8 cm/day flow rate‣ Mat area: 182 cm 2‣ Mat thickness: 1 cm‣ Activated Carbon loading: 0.16 g/cm 3‣ Organoclay loading: 0.16 g/cm 3‣ 4 ug/min 2 cbp‣ 0.2 ug/min 2,2’,5,5’ tetra-cbp‣ 20 ug/min Naph‣ 1 ug/min PhenGR-value vs. time - GeotextilesiGR=i ~ 1.0 i ~ 4.0 i ~ 8.0>1 Cloggingi 1 Clogging−i < 1 PipingTest 12i ~ 1.0 i ~ 4.0 i ~ 8.0Mon Tue Wed Thu Fri1.00.80.60.40.20.0i i i0.6~ 1.0 ~ 4.0 ~ 8.00.4Mon 01 Tue 02 Wed 03 Thu 04 Fri 05Time - DayTime - DayDateGR-value on the piping side (GR < 1) is recommended by ASTM D-5101. The stability of the GR-value is alsoimportant. No clogging potential of the filter system was observed. Tendency towards rapid stabilization(~1 day) occurred on each test replicate.Influent Concentration (mg/L)Gradient RatioGradient Ratio5432102.01.81.61.41.21.00.83.02.52.01.51.00.5PCB Influent & Effluent Concentrations0 2 4 6 8 10 12 14Cummulative Volume (L)Influent 2cbpInfluent-2',2,5',5, cbpEffluent 2cbpEffluent 2',2,5',5 cbpGR-value vs. time – Deployed matsGR=i> 1 Clogging−i < 1 PipingAOS 170AOS 70AOS 70 (Replicate)AOS 80AOS 80 (Replicate)GR-value vs. time – AOS 80Long Term - 24 daysShort Term 5 daysShort Term 5 days (Repl)Long Term Hydraulic Gradienti=1 i=4 i=5 i=6Short Term Hydraulic Gradient vary from 1 to 80.001/01 01/05 01/09 01/13 01/17 01/21 01/250.100.080.060.040.020.00Effluent Concentration (mg/L)*Concentrations below the detection limit arereported at 1/2 the MDLBefore GRT11.5 cmSoil PassingAfter GRTSediment passing weight - gSoil Passing vs. Mesh vs. Mass per areaDuring each test, some sediment passed through the geotextile, and some was trappedin the geotextile. Sediment transport through the geotextile was a transient behavior,and appeared to cease within the first 24 hours of the test. The mass of sedimentpassing the geotextile was determined, and the granulometry will be obtained. Theamount of sediment passing through the geotextile was highly dependent on the meshsize and mass per area (~tortuosity) of the fabric.Falling head tests indicate thesediment permeability is:1210864208010012011.5 cm 140160180Geotextile AOS - MeshGoal: To obtain evaluate initial the estimates compressive of settlement, behavior of flow soft variation, sediments, and anddepth establish and the area permeability of affected variation sediment. during consolidation. Thisinformation will be used as SEEPAGE part of MODELS the finite element modeling ofreactive Unclogged capping. Case kmat/ksed = 1Clogged Case kmat/ksed = 0.1Strain [%]Coefficient of Volume Compressibility m v [m 2 /kN]Permeability [m/s]051015201e+01e-11e-21e-31e-41e-51e-51e-61e-71e-89ksed−5≈ 1.50x10cmsSoft Sediment ConsolidationPiscataqua River, NH0.1 1 10 100 1000 10000Effective Stress - [kN/m 2 ]0.1 1 10 100 1000Effective Stress [kN/m 2 ]1e-90.1 1 10 100 1000Effective Stress [kN/m 2 ]Piscataqua 1Piscataqua 2Piscataqua Seepage SC-05Picataqua 1Piscataqua 2Piscataqua Seepage SC-04Picataqua 1Piscataqua 2Piscataqua Seepage SC-04k = 1e-7 m/s = 1e-5 cm/s87Geotextile mass per area - oz/yd 2Coefficient of Volume Compressibility m v [m 2 /kN]Permeability [m/s]1e-51e-61e-71e-81e-90.0011e-1010.10.0165Cottonwood Bay, TXStrain vs. σ’ Strain vs. σ’4Effective Stress - [kN/m 2 ]Effective Stress [kN/m 2 ]Effective Stress [kN/m 2 ]GeotextilesGeotextiles starting at i=0.5Clean MatsTexas Mats Upside DownTexas Mats0.1 1 10 100 1000Volumetric Compressibility vs. σ’ Volumetric Compressibility vs. σ’Texas 1Texas 2Texas Seepage SC-05*0.00010.1 1 10 100 1000Permeability vs. σ’ Permeability vs. σ’Strain [%]0102030405060Texas 1Texas 2Texas Seepage SC-05Consolidation tests provided information about the change in permeability of the sediment as a function ofthe effective stress. This key result will be used to simulate the deployment of the cap over soft sediment,and how the permeability variation affect seepage and flow of contaminants.Texas 1Texas 2Texas Seepage SC-05*k = 1e-7 m/s = 1e-5 cm/s1e-110.1 1 10 100 1000
Third Year Annual Progress Report - <strong>SERDP</strong> Project Number ER-1493Reactive Capping Mat Development and Evaluation for SequesteringContaminants in Sediments (Field Work Component)Amy L. Hawkins – Lead Investigator – Naval Facilities Engineering Service Center, Port Hueneme, CaliforniaKevin H. Gardner, Jeffrey S. Melton, Scott Greenwood, Donald Wise – Environmental Research Group, UNH, Durham, New HampshireGregory A. Tracey, Gregory A. Berman, Jesse J. Swanko – Science Applications International Corporation, Newport, Rhode IslandGeotextile TestingGoal: To retrieve first set of small-scale geotextile test mats ofdifferent compositions and apparent opening sizes after sixmonths of soak time to evaluate field performance in terms ofbiofouling and clogging potential; retrieval of second setscheduled for two years.Total of 14 Test Mats ConstructedRep. Geotextile Material Core AOS Position Quantity1 CETCO 1 Polyester Mixed 170 Up 22 CETCO 1 Polyester Mixed 170 Down 23 CETCO 2 Polypropylene Mixed 70 Up 24 CETCO 2 Polypropylene Mixed 70 Down 25 CETCO 3 Polypropylene Mixed 80 Up 26 CETCO 3 Polypropylene Mixed 80 Down 27 CETCO 2 Polypropylene Ottawa Sand 70 Up 2Core mixture = apatite, activated carbon, organoclay; Ottawa sand = control.Float(Color Coded)Non-WovenGeotextile UpSingle LayerGeotextile~25 ftSingle LayerGeotextilewith SandCoverScrew AnchorCottonwood Bay Mat System Layout15 ft3-4 ft Overlap~25 ft25 ftFour TestArrangementsTarget AreaDouble LayerGeotextileSand CoverOnlyNon-Woven Geotextile Down – Bottom LayerNon-Woven Geotextile Up – Top LayerBrick w/ FloatControl Area(No Cover)Sand capping material consisted ofcourse grained masonry sand placedby slurry pumping from a roll offbox; used to provide 3-6” ofsubstrate for benthic colonization intwo test arrangements.Selected Pilot Site: Cottonwood BayGrand Prairie, TexasPrototype Mat System ConstructionGoal: To deploy a prototype mat system constructed of the mostadsorbent amendment mixture and the geotextile most resistant tobiofouling, as determined by laboratory testing, in order to assessthe in situ chemical sequestration effectiveness and groundwaterflux properties of different mat and sand cap arrangements.Prototype (Full-Scale) Mat Fabrication0.5 in15 ft25 ft80 AOS (8 oz/sy)polypropylene geotextileMixture of activatedcarbon (0.28 lb/sf),organoclay (0.28 lb/sf),apatite (0.23 lb/sf)Woven Backing Geotextile (Silt Curtain)Mat System Performance TestingGoal: Deploy passive diffusion sampling devices(peepers/SPMDs/SPMEs) to monitor contaminant transport acrossspecific interfaces within the mat system; use resulting data to resolvecontaminant fluxes under site specific conditions.Peepers:‣ Analyze Metals inPore Water‣ Polyethylene PlasticCasing‣ NucleoporeMembraneVerticalPeeperHorizontal PeeperH. Peeper/SPMET1- Mat(No Sand)Semi-Permeable Membrane Devices:‣ Simulate Organic ContaminantAbsorption‣ Permeable Tube-Like Bags‣ High Molecular Weight Lipid(Triolein)BAZMatSPMDH. Peeper/SPMET3- Double Mat(No Sand)Custom AluminumDeployment DeviceBAZMatMatSolid Phase Micro-Extraction:‣ Analyze Organics‣ Fibers Coated withPolymer/Sorbent‣ Contaminants EstablishEquilibriaT5- No Treatment(Control)V. Peeper SPMD V. SPMEHorizontal SPMECottonwood Bay Contaminant Sampler Layout – Deployed October 2008SPMDSPMDBAZVerticalSPMEMat System Flux Modeling (Pending)Goal: Collect Ultraseep measurements from the full scale matsystem to directly quantify net contaminant flux through the varioustreatments.Ultraseep TM TechnologyNext Steps / Technology Transition‣Retrieve contaminant samplers after one month of soak time.‣Conduct geophysical surveys (side-scan, sub-bottom, SPI) toevaluate sediment properties at the full-scale mat system.‣Conduct an Ultraseep TM survey at the full-scale mat systemafter one year of soak time.‣Compare dissolved chemical concentrations detected acrosstarget interface boundaries for five different mat treatments.‣Use measured differences in pore water contaminantconcentrations to isolate boundary transport dynamics.‣Determine the effectiveness of prototype field design throughperformance testing and contaminant flux modeling.‣Utilize findings of the mat treatment most effective insequestering contaminants to recommend/design a full scaleremediation effort (<strong>ESTCP</strong> transition).H. Peeper/SPMESPMDT2- Mat(Sand)BAZSandMatV. Peeper SPMD V. SPMEBAZSandT4- No Mat(Sand Cap)Unique Interfaces of Interest:Mat/Water Sand/WaterSediment/Mat Sediment/SandMat/Sand Sediment/WaterMat/MatAcknowledgementsU.S. DoD Strategic Environmental Research & Development ProgramSarah M. Reed – NAVFAC SoutheastMichael L. Mendias, P.E., C.A.P.M. – Vought Aircraft Industries, Inc.


