View this Presentation (PDF 2.06 MB) - Iamgold
View this Presentation (PDF 2.06 MB) - Iamgold
View this Presentation (PDF 2.06 MB) - Iamgold
- No tags were found...

You also want an ePaper? Increase the reach of your titles
YUMPU automatically turns print PDFs into web optimized ePapers that Google loves.
The New Niobec Niobium MinePDAC March 7, 2012Gordon StothartEVP & COO®®
3IAMGOLD Overview• IAMGOLD is a leading mid-tier gold mining company• Gold production of approximately one million ouncesannually from 5 gold mines on 3 continents• Head Office located in Toronto, Canada• Publicly Listed Company on TSX (IMG) & NYSE (IAG)• Market Capitalization of $5.3 Billion®• Owns 100% of the Niobec Mine (Niobec Inc)
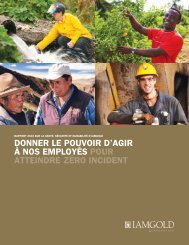
4Conduct Governed by Zero Harm FrameworkHigheststandards inHealth andSafetyMinimizingEnvironmentalFootprintPartnering withHostcommunities®Highest standard of corporate social responsibility
IAMGOLD’s Platform – High Quality, Long-Life Assets5®Natural extensions with significant expansion potential
6Growth StrategyExtend and optimize existing minesIncrease focus on mine specific cost reduction measuresPursue exploration playsEvaluate acquisition opportunitiesSurface full value of Niobec®Focused on maximizing return on capital
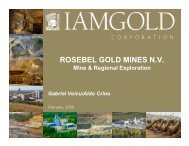
7Niobec Niobium MineQuebecIAMGOLD: 100% Ownership®• Saguenay region has strong industrial base, sound infrastructure• In operation for 35+ years, operated by IAMGOLD since 2006• Expansion Pre-feasibility confirmed 600%+ increase in probablereserves• REE potentialOnly major niobium producer in North America; 1 of 3 globally
Nominal Production Rate (t/d)Shaft Depth (ft.)8Niobec HistorySoquem: 50%Teck Corp. (Copperfield): 25%Lamaque Mining: 25%Teck Corporation: 50%Cambior: 50%Cambior: 100%IAMGOLD:100%7,0006,0005,0002010: Paste BackfillMill expansion to 6,240 t/d1994: Construction of Ferroniobium convertor2002: ISO 9000:2000ISO 14.0014,0003,0001974: Construction starts1976: Production starts2,0001,0000-1,000®-2,000-3,0001967: Orebody discovered1995: ISO 90022007: New hoistProd. RateShaft
Production (tonnes)9Niobium Production ProfileAnnual production growth of 10.3% per year since 2000,with an average grade of 0.66%5,0004,5004,163 4,300 4,396 4,1064,3434,6320.804,0003,5003,339 3,344 3,417 3,7500.603,0002,5002,0002,1703,0060.40Grade (%Nb 2 O 5 )1,5001,0000.20500®0'00 '01 '02 '03 '04 '05 '06 '07 '08 '09 '10 '110.00Production (tonnes) Grade (%)Long history of stable production
10Niobec Local Geology• St-Honoré Complex®• Alkaline complex (6 x 8 kms )• The core is comprised ofcrescent-shaped lenses ofcarbonatite (calcitite/dolomitite/ferrocarbonatite)• Overlain by younger flat-lyingTrenton limestones• Niobium (>0.4% Nb 2 O 5 ) hostedin the southern sector of thecarbonatite• NE and NW Nb trends projectedfrom mine area• REE mineralization hosted in thecentral and youngest part of thecarbonatite complex
11Niobec – MineralogyGroup Components % WeightCarbonatesSilicatesDolomite, Calcite,Ankerite, SideriteZircon, Biotite, Chlorite,Na-,K-, Feldspars,Pyroxenes, Nepheline64.921.1Phosphates Apatite 6.8Niobium Oxides Pyrochlore, Columbite 1.1Other OxidesSulphidesMagnetite, Hematite,Rutile, IlmenitePyrite, Pyrrhotite,Sphalerite1.70.9®Others Baryte, Fluorite, Halite 3.3
12Ferroniobium Marketing for NiobecFerroniobium®• Niobec’s final product is Ferroniobium = FeNb• Niobium content in FeNb is 66%• Ferroniobium is sold on its Nb content & traded in US dollars› Revenues are calculated on Nb content• Capacity, export, import, consumption quantities forferroniobium are based on the FeNb product and not its Nbcontent› e.g. 2011 Production at Niobec ≈ 4.6 Mkg Nb or 6,970 tFeNb• FeNb is not quoted on the open market
Niobium: Scarce Metal with Unique PropertiesUsing niobiumto enhance steel has many benefits:13• Adds strength• Lightens weight• Enhances flexibility• Improves durability• Reduces costs®Niobium is used to produce high-quality steel
14Ferroniobium: alloy of niobium and ironWorld Consumption of Ferroniobium by End-use (2010)STRUCTURAL29%STAINLESSSTEELother13%10%AUTO24%PIPE24%®Source: Niobec management and Roskill
Ferro-niobium World Consumption by Region(2011)16CIS7%China25%Japan10%Other Asia11%EU24%Americas21%ROW2%®
2011 Niobium Supply (% of global production)17CBMM84.3%CATALÃO6.1%®Other1%NIOBEC8.6%
FeNb consumption (tonnes)'82'85'88'91'94'97'00'03'06'09'12'15g FeNb/t steel18Niobium Demand is Rapidly Growing145,000125,000105,00085,00065,00045,00025,000Ferroniobium DemandGrowing at 10% CAGR2,0001,8001,6001,4001,2001,000800Steel Production (Mt)• ~ 60% of FeNb growth generated by increasedintensity; balance is in growth of crude steelproduction• 20% of steel produced in developed countries isHSLA; only 10% in developing countries• HSLA prod’n will continue to increase inboth developed and developing countries(HSLA in automobiles will double by 2020)5,000600FeNb ConsumptionSteel ConsumptionSource: Roskill, World Steel AssociationGrowth in:• Crude Steel• HSLA steel production increase• Intensity UsageIs forecast to generate a CAGR of 10to 11% for FeNb over the next 5 years656055504540354041 414343525663624355 551,5501,4501,3501,2501,1501,050950850Steel Production (Mt)®30'00 '01 '02 '03 '04 '05 '06 '07 '08' '09 '10' '11750Driven by increase usage intensity & growing steel production
19Niobium Pricing• For Long Term Planning purposes, average priceconservatively forecast to be $45/kg• SPOT market in 2011 > $45/kg$33$37$35 $36$40$43$45 $45 $45 $45 $45 $45 $45 $45$15'06 '07 '08 '09 '10 '11E '12E '13E '14E '15E '16E '17E '18E '19E '20E®Base Case ForecastPrices estimated by an independent source to Roscoe Postle Associates.
20Niobec Expansion Opportunity: Resources®• Strategic ResourceDevelopment Plan:› 5-year drilling program› Full delineation ofniobium resource› Assess alternatemining methods• Goals:› Reduce extractioncosts› Increase annualproduction› Grow mineralresources› Extend mine lifebeyond 40 yearsBlock 1 to 6considered forpre-feas.SurfaceBlocks 1 to 3:Reserves(18% mined out)Blocks 4 to 6:Reserves& resourcesBlocks 7 to 9:ResourcesBlocks 10 to 12Niobec Expansion Opportunity: Resources
Niobec Mining Methods (Pre-feasibility Analysis)21Base Case LOM wasestimated using the latestinformation availablePyramidalTwo additional scenarioswere evaluated:• Open Pit• Block CavingOpen PitBlock Caving®All scenarios used the samegeologic resource model
Niobec – Block Caving chosen as thecarry forward scenario22Orebody – Cavability Potential®• Niobec mine cavability was an action item from the SRDP to bepursued at pre-feasibility.• None of the experts consulted have identified any fatal flawsduring the exercise.• Rock mass good quality could lead to big size rocks.› Special design considerations and equipment were factoredin the study to address <strong>this</strong> issue.• The size of the deposit is particularly suitable for Block Caving.• Ultimate draw height of 700m. Suggested by both cavingconsultants
23Niobec MiningBlock Caving Proposed Mining Sectors®
24Niobec – Infrastructure Block CavingPower stationConverterMillOre PileAdministration®Service ShaftProduction Shaft
27Funding for Niobec Expansion$976MIPOStrategicSaleCreditFacilityCash Flow(2013E-2016E)Capital Expenditures(2013E-2016E)FundingSources®Expansion Fully Self Funded27
28Niobec – PermittingProcess, Sequence and DurationCumulative duration• Selection of mining scenario and detailed description 3 months• Full environmental and social impact assessment 7 monthsProvincial• Project assessment by provincial environment ministryMDDEP18 months• Public hearings – BAPE (in parallel) 18 months• Quebec provincial cabinet decision ± 24 monthsFederal (if there is impact on fish habitat)• Review of Environmental Impact Assessment and furtherinvestigation if necessary3 to 20 months(Included in the 24 months)®Strong, transparent community relations are an important aspectof achieving a positive decision
29Niobec Stakeholder Map®
30Rare Earth Element Potential at NiobecRare earth elements• Grade 1.65% Total RareEarth Oxides (TREO)• 7.7 Bkg TREO• 98% Light REEs, incl.:› Cerium (47.9%)› Lanthanum (24.5%)› Neodymium (18.4%)• 2% Heavy REEs• Potential developmentwould be self-fundedNiobium exploration potential› Niobium mineralization open toeast and west of existingresource› Resource expansion drilling inprogressShaftExisting block modeland shaft®Mineralization begins very near surface
The New Niobec Niobium MinePDAC March 7, 2012INVESTOR RELATIONSBob Tait, VP Investor RelationsT: 416 360 4743 C: 647 403 5520Laura Young, Director, Investor RelationsT: 416 933 4952 C: 416 670 3815®®