Stanford-Binet Intelligence Scales, Fifth Edition ... - Faculty.utep.edu
Stanford-Binet Intelligence Scales, Fifth Edition ... - Faculty.utep.edu
Stanford-Binet Intelligence Scales, Fifth Edition ... - Faculty.utep.edu
You also want an ePaper? Increase the reach of your titles
YUMPU automatically turns print PDFs into web optimized ePapers that Google loves.
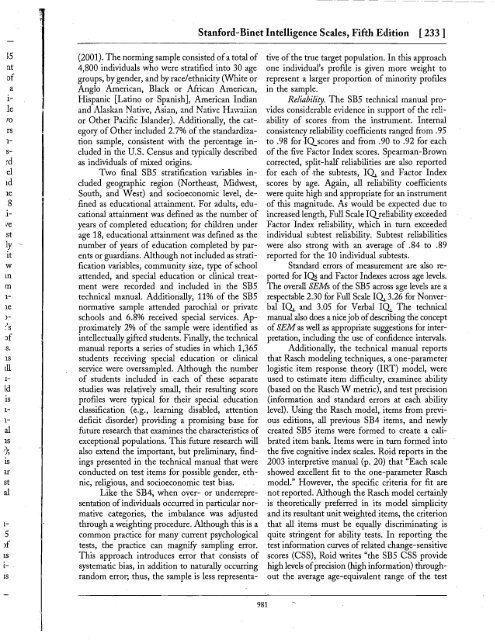
<strong>Stanford</strong>-<strong>Binet</strong> <strong>Intelligence</strong> <strong>Scales</strong>, <strong>Fifth</strong> <strong>Edition</strong> [233]15ntofalIerors1srde1td1e8liTestly 'itwLfim11e):s.1S111ltdis11al1Sr);isarstal1Sl-IS(2001). The norming sample consisted ofa total of4,800 individuals who were stratified into 30 agegroups, by gender, and by race/ethnicity (White orAnglo American, Black or Mrican American,Hispanic [Latino or Spanish], American Indianand Alaskan Native, Asian, and Native Hawaiianor Other Pacific Islander). Additionally, the categoryof Other included 2.7% of the standardizationsample, consistent with the percentage includedin the U.S. Census and typically describedas individuals of mlxed origins.Two final SB5 stratification variables includedgeographic region (Northeast, Midwest,South, and West) and socioeconomic level, definedas <strong>edu</strong>cational attainment. For adults, <strong>edu</strong>cationalattainment was defined as the number ofyears of completed <strong>edu</strong>cation; for children underage 18, <strong>edu</strong>cational attainment was defined as thenumber of years of <strong>edu</strong>cation completed by parentsor guardians. Although not included as stratificationvariables, community size, type of schoolattended, and special <strong>edu</strong>cation or clinical treatmentwere recorded and included in the SB5technical manual. Additionally, 11% of the SB5normative sample attended parochial or privateschools and 6.8% received special services. Approximately2% of the sample were identified asintellectually gifted students. Finally, the technicalmanual reports a series of studies in which 1,365students receiving special <strong>edu</strong>cation or clinicalservice were oversampled. Although the numberof students included in each of these separatestudies was relatively small, their resulting scoreprofiles were typical for their special <strong>edu</strong>cationclassification (e.g., learning disabled, attentiondeficit disorder) providing a promising base forfuture research that exa~ines the characteristics ofexceptional populations. This future research willalso extend the important, but preliminary, findingspresented in the technical manual that wereconducted on test items for possible gender, ethnic,religious, and socioeconomic test bias.Like the SB4~ when over- or underrepresentationofindividuals occurred in particular normativecategories, the imbalance was adjustedthrough a weighting proc<strong>edu</strong>re. Although this is acommon practice for many current psychologicaltests, the practice can magnify sampling error.This approach introduces error that consists ofsystematic bias, in addition to naturally occurringrandom error, thus, the sample is less representativeof the true target population. In this approachone individual's prome is given more weight torepresent a larger proportion of minority promesin the sample.Reliability. The SB5 technical manual providesconsiderable evidence in support of the reliabilityof scores from the instrument. Internalconsistency reliability coefficients ranged from .95to .98 for IQscores and from .90 to .92 for eachof the five Factor Index scores. Spearman-Browncorrected, split-half reliabilities are also reportedfor each of the subtests, 1(1. and Factor Indexscores by age. Again, all reliability coefficientswere quite high and appropriate for an instrumentof this magnitude. As would be expected due toincreased length, Full Scale IQreliability exceededFactor Index reliability, which in turn exceededindividual subtest reliability. Subtest reliabilitieswere also strong with an average of .84 to .89reported for the 10 individual subtests.Standard errors of measurement are also reportedfor IO§ and Factor Indexes across age levels.The overall SEMs of the SB5 across age levels are arespectable 2.30 for Full Scale 1(1.3.26 for Nonverbal1(1. and 3.05 for Verbal IQ The technicalmanual also does a nice job ofdescribing the conceptof SEM as well as appropriate suggestions for interpretation,including the use of confidence intervals.Additionally, the technical manual reportsthat Rasch modeling techniques, a one-parameterlogistic item response theory (IRT) model, wereused to estimate item difficulty, examinee ability(based on the Rasch W metric), and test precision(information and standard errors at each abilitylevel). Using ,the Rasch model, items from previouseditions, all previous SB4 items, and newlycreated SB5 items were formed to create a calibrateditem bank. Items were in turn formed intothe five cognitive index scales. Roid reports in the2003 interpretive manual (p. 20) that "Each scaleshowed excellent fit to the one-parameter Raschmodel." However, the specific criteria for fit arenot reported. Although the Rasch model certainlyis theoretically preferred in its model simplicityand its resultant unit weighted items, the criterionthat all items must be equally discriminating isquite stringent for ability tests. In reporting thetest information curves of rehited change-sensitivescores (CSS), Roid writes "the SB5 CSS providehigh levels ofprecision (high information) throughoutthe average age-equivalent range of the test981


