Gene set enrichment analysis with topGO
Gene set enrichment analysis with topGO
Gene set enrichment analysis with topGO
- No tags were found...

You also want an ePaper? Increase the reach of your titles
YUMPU automatically turns print PDFs into web optimized ePapers that Google loves.
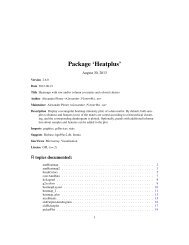
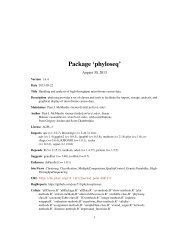
GO:0008150biological_process1.0000050 / 315GO:0065007biological regulatio...0.3236440 / 236GO:0009987GO:0050789GO:0071840cellular processregulation of biolog...cellular component o...1.000000.275900.6506350 / 31539 / 22128 / 213GO:0007049GO:0051301GO:0050794GO:0071841GO:0016043cell cyclecell divisionregulation of cellul...cellular component o...cellular component o...0.344289.91e−070.116450.538180.5887633 / 20515 / 14237 / 20925 / 20128 / 212GO:0022402cell cycle process1.0000029 / 193GO:0051726regulation of cell c...0.2683914 / 116GO:0071842cellular component o...0.4761525 / 200GO:0022403cell cycle phase0.0003128 / 190GO:0010564regulation of cell c...0.0010210 / 98GO:0006996organelle organizati...0.8328821 / 191GO:0000278mitotic cell cycle0.0011228 / 192GO:0000279M phase0.0205124 / 186GO:0048285organelle fission1.0000018 / 177GO:0000087M phase of mitotic c...0.0205124 / 186GO:0000280nuclear division1.0000018 / 177GO:0007067mitosis2.96e−0818 / 177Figure 2: The subgraph induced by the top 5 GO terms identified by the elim algorithm for scoring GO terms for<strong>enrichment</strong>. Rectangles indicate the 5 most significant terms. Rectangle color represents the relative significance,ranging from dark red (most significant) to bright yellow (least significant). For each node, some basic informationis displayed. The first two lines show the GO identifier and a trimmed GO name. In the third line the raw p-valueis shown. The forth line is showing the number of significant genes and the total number of genes annotated tothe respective GO term.
List of 6$ 068724: chr [1:5] "GO:0005488" "GO:0003774" "GO:0001539" "GO:0006935" ...$ 119608: chr [1:6] "GO:0005634" "GO:0030528" "GO:0006355" "GO:0045449" ...$ 049239: chr [1:13] "GO:0016787" "GO:0017057" "GO:0005975" "GO:0005783" ...$ 067829: chr [1:16] "GO:0045926" "GO:0016616" "GO:0000287" "GO:0030145" ...$ 106331: chr [1:10] "GO:0043565" "GO:0000122" "GO:0003700" "GO:0005634" ...$ 214717: chr [1:7] "GO:0004803" "GO:0005634" "GO:0008270" "GO:0003677" ...The object returned by readMappings is a named list of character vectors. The list names give the genesidentifiers. Each element of the list is a character vector and contains the GO identifiers annotated to thespecific gene. It is sufficient for the mapping to contain only the most specific GO annotations. However,<strong>topGO</strong> can also take as an input files in which all or some ancestors of the most specific GO annotations areincluded. This redundancy is not making for a faster running time and if possible it should be avoided.The user can read the annotations from text files or they can build an object such as geneID2GO directlyinto R. The text file format required by the readMappings function is very simple. It consists of one line foreach gene <strong>with</strong> the following syntax:gene_IDGO_ID1, GO_ID2, GO_ID3, ....Reading GO-to-genes mappings from a file is also possible using the readMappings function. However, itis the user responsibility to know the direction of the mappings. The user can easily transform a mappingfrom gene-to-GOs to GO-to-genes (or vice-versa) using the function inverseList:> GO2geneID str(head(GO2geneID))List of 6$ GO:0000122: chr "106331"$ GO:0000139: chr [1:6] "133103" "111846" "109956" "161395" ...$ GO:0000166: chr [1:10] "067829" "157764" "100302" "074582" ...$ GO:0000186: chr "181104"$ GO:0000209: chr "159461"$ GO:0000228: chr "214717"4.4 Predefined list of interesting genesIf the user has some a priori knowledge about a <strong>set</strong> of interesting genes, he can test the <strong>enrichment</strong> of GOterms <strong>with</strong> regard to this list of interesting genes. In this scenario, when only a list of interesting genes isprovided, the user can use only tests statistics that are based on gene counts, like Fisher’s exact test, Z scoreand alike.To demonstrate how custom annotation can be used this section is based on the toy data<strong>set</strong>, the geneID2GOdata, from Section 4.3. The gene universe in this case is given by the list names:> geneNames head(geneNames)Since for the available genes we do not have any measurement and thus no criteria to select interesting genes,we randomly select 10% genes from the gene universe and consider them as interesting genes.> myInteresting<strong>Gene</strong>s geneList names(geneList) str(geneList)Factor w/ 2 levels "0","1": 1 1 1 1 1 1 1 1 1 1 ...- attr(*, "names")= chr [1:100] "068724" "119608" "049239" "067829" ...
The geneList object is a named factor that indicates which genes are interesting and which not. It shouldbe straightforward to compute such a named vector in a real case situation, where the user has his ownpredefined list of interesting genes.We now have all the elements to construct a <strong>topGO</strong>data object.To build the <strong>topGO</strong>data object, we will use the MF ontology. The mapping is given by the geneID2GO listwhich will be used <strong>with</strong> the annFUN.gene2GO function.> GOdata GOdata------------------------- <strong>topGO</strong>data object -------------------------Description:-Ontology:- MF100 available genes (all genes from the array):- symbol: 068724 119608 049239 067829 106331 ...- 10 significant genes.89 feasible genes (genes that can be used in the <strong>analysis</strong>):- symbol: 068724 119608 049239 067829 106331 ...- 10 significant genes.GO graph (nodes <strong>with</strong> at least 1 genes):- a graph <strong>with</strong> directed edges- number of nodes = 233- number of edges = 280------------------------- <strong>topGO</strong>data object -------------------------One important point to notice is that not all the genes that are provided by geneList, the initial geneuniverse, can be annotated to the GO. This can be seen by comparing the number of all available genes,the genes present in geneList, <strong>with</strong> the number of feasible genes. We are therefore forced at this point torestrict the gene universe to the <strong>set</strong> of feasible genes for the rest of the <strong>analysis</strong>.The summary on the GO graph shows the number of GO terms and the relations between them of thespecified GO ontology. This graph contains only GO terms which have at least one gene annotated to them.4.5 Using the genes scoreIn many cases the <strong>set</strong> of interesting genes can be computed based on a score assigned to all genes, for examplebased on the p-value returned by a study of differential expression. In this case, the <strong>topGO</strong>data object canstore the genes score and a rule specifying the list of interesting genes. The advantage of having both the
scores and the procedure to select interesting genes encapsulated in the <strong>topGO</strong>data object is that the usercan choose different types of tests statistics for the GO <strong>analysis</strong> <strong>with</strong>out modifying the input data.A typical example for the ALL data<strong>set</strong> is the study where we need to discriminate between ALL cells deliveredfrom either B-cell or T-cell precursors.> y table(y)There are 95 B-cell ALL samples and 95 T-cell ALL samples in the data<strong>set</strong>. A two-sided t-test can by appliedusing the function getPvalues (a wraping function for the mt.teststat from the multtest package). Bydefault the function computes FDR (false discovery rate) adjusted p-value in order to account for multipletesting. A different type of correction can be specified using the correction argument.> geneList topDiff<strong>Gene</strong>s x sum(x)With all these steps done, the user can now build the <strong>topGO</strong>data object. For a short description of thearguments used by the initialize function see Section 4.4> GOdata
6.1 Defining and running the testThe main function for running the GO <strong>enrichment</strong> is getSigGroups() and it takes two arguments. The firstargument is an instance of class <strong>topGO</strong>data and the second argument is an instance of class groupStats orany of its descendents.To better understand this principle consider the following example. Assume we decided to apply the classicalgorithm. The two classes defined for this algorithm are classicCount and classicScore. If an objectof this class is given as a argument to getSigGroups() than the classic algorithm will be used. ThegetSigGroups() function can take a while, depending on the size of the graph (the ontology used), so bepatient.The groupStats classesNext we show how an instance of the groupStats class can represent a gene <strong>set</strong> and how the test statisticis performed.We compute the <strong>enrichment</strong> of cellular lipid metabolic process (GO:0044255) term using Fisher’s exact test.In order to do this we need to define the gene universe, to obtain the genes annotated to GO:0044255, andto define the <strong>set</strong> of significant genes.> goID gene.universe go.genes sig.genes my.group contTable(my.group)sig notSiganno 26 153notAnno 292 3187> runTest(my.group)[1] 0.005573167The slot testStatistic contains the function (or to be more precise, the method) which computes the teststatistic. We used the GOFisherTest function which is available in the <strong>topGO</strong> package and as the name statesit implements Fisher’s exact test. The user can define his own test statistic function and then apply it usingthe preferred algorithm. The function, however, should use the methods defined for the groupStats classto access the data encapsulated in such an object. (For example a function which computes the Z score canbe easily implemented using as an example the GOFisherTest method.)The runTest method is defined for the groupStats class and its used to run/compute the test statistic,by calling the testStatistic function. The value returned by the runTest method in this case is thevalue returned by GOFisherTest method, which is the Fisher’s exact test p-value. The contTable method,showed in the example above, is only defined for the classes based on gene counts and its used to compilethe two-dimensional contingency table based on the object.To show how the same interface is used for the classes based on gene counts we next build an instance forthe elimCount class. We randomly select 25% of the annotated genes as genes that should be removed.> <strong>set</strong>.seed(123)> elim.genes
elim.group contTable(elim.group)sig notSiganno 21 114notAnno 292 3187> runTest(elim.group)[1] 0.005355873We see that the interface accounts for the genes that need to be eliminated, once the object is instantiated.The same mechanism applies for the other hierarchy of classes (the score based and expression based classes),except that each hierarchy has its own specialised methods for computing statistics from the data.Please note that the groupStats class or any descendent class does not depend on GO, and an object ofsuch a class can be instantiated using any gene <strong>set</strong>.Performing the testAccording to the mechanism described above, one first defines a test statistic for the chosen algorithm,meaning that an instance of object specific for the algorithm is constructed in which only the test statisticmust be specified, and then calls a generic function (interface) to run the algorithm.According to this mechanism, one first defines a test statistic for the chosen algorithm, in this case classic andthen runs the algorithm (see the second line). The slot testStatistic contains the test statistic function.In the above example GOFisherTest function which implements Fisher’s exact test and is available in the<strong>topGO</strong> package was used. A user can define his own test statistic function and then apply it using the classicalgorithm. (For example a function which computes the Z score can be implemented using as an example theGOFisherTest method.)> test.stat resultFisher resultFisherDescription: GO <strong>analysis</strong> of ALL data; B-cell vs T-cell Object modified on: 13 Apr 2011Ontology: BP'classic' algorithm <strong>with</strong> the 'Fisher test' test3116 GO terms scored: 99 terms <strong>with</strong> p < 0.01Annotation data:Annotated genes: 3658Significant genes: 318Min. no. of genes annotated to a GO: 5Nontrivial nodes: 2268To use the Kolmogorov-Smirnov (KS) test one needs to provide the gene-wise scores and thus we need toinstantiate an object of a class which is able to deal of the scores. Such a class is the classicScore class,see Figure 4 which will let us run the classic algorithm.> test.stat resultKS
The mechanism presented above for classic also hold for elim and weight. The user should pay attentionto the compatibility between the chosen class and the function for computing the test statistic, since noincompatibility test are made when the object is instantiated. For example the weight algorithm will notwork <strong>with</strong> classes based on gene-wise scores. To run the elim algorithm <strong>with</strong> KS test one needs to type:> test.stat resultElim test.stat resultWeight
esultFis weight01.fisher weight01.t elim.ks weight.ks whichTests()[1] "fisher" "ks" "t" "globaltest" "sum" "ks.ties"> whichAlgorithms()[1] "classic" "elim" "weight" "weight01" "lea" "parentchild"There is no advantage of using the runTest() over getSigGroups() except that it is more user friendly and itgives cleaner code. However, if the user wants to define his own test statistic or implement a new algorithmbased on the available groupStats classes, then it would be not possible to use the runTest function.Finally, the function can pass extra arguments to the initialisation method for an groupStats object. Thus,one can specify different cutoffs for the elim method, or arguments for the weight method.7 Interpretation and visualization of resultsThis section present the available tools for analysing and interpreting the results of the performed tests.Both getSigGroups and runTest functions return an object of type <strong>topGO</strong>result, and most of the followingfunctions work <strong>with</strong> this object.7.1 The <strong>topGO</strong>result objectThe structure of the <strong>topGO</strong>result object is quite simple. It contains the p-values or the statistics returned bythe test and basic informations on the used test statistic/algorithm. The information stored in the <strong>topGO</strong>dataobject is not carried over this object, and both of these objects will be needed by the diagnostic tools.Since the test statistic can return either a p-value or a statistic of the data, we will refer them as scores!To access the stored p-values, the user should use the function score. It returns a named numeric vector,were the names are GO identifiers. For example, we can look at the histogram of the results of the Fisher’sexact test and the classic algorithm.By default, the score function does not warranty the order in which the p-values are returned, as we cansee if we compare the resultFis object <strong>with</strong> the resultWeight object:> head(score(resultWeight))GO:0009968 GO:0031330 GO:0045588 GO:0031331 GO:0046504 GO:00423100.6754813639 0.7673603278 0.0007303655 1.0000000000 1.0000000000 1.0000000000
pvalFis head(pvalFis)GO:0000003 GO:0000018 GO:0000038 GO:0000041 GO:0000060 GO:00000750.99168089 0.34705231 0.00295901 0.71389516 0.63279594 0.46656129> hist(pvalFis, 50, xlab = "p-values")Histogram of pvalFisFrequency0 200 400 600 8000.0 0.2 0.4 0.6 0.8 1.0p−valuesHowever, the score method has a parameter, whichGO, which takes a list of GO identifiers and returns thescores for these terms in the specified order. Only the scores for the terms found in the intersection betweenthe specified GOs and the GOs stored in the <strong>topGO</strong>result object are returned. To see how this work letscompute the correlation between the p-values of the classic and weight methods:> pvalWeight head(pvalWeight)GO:0000003 GO:0000018 GO:0000038 GO:0000041 GO:0000060 GO:00000750.9995232 1.0000000 1.0000000 0.7674111 0.6327959 0.6931562> cor(pvalFis, pvalWeight)[1] 0.4871206Basic information on input data can be accessed using the geneData function. The number of annotatedgenes, the number of significant genes (if it is the case), the minimal size of a GO category as well as thenumber of GO categories which have at least one significant gene annotated are listed:> geneData(resultWeight)Annotated Significant NodeSize SigTerms3658 318 5 22687.2 Summarising the resultsWe can use the GenTable function to generate a summary table <strong>with</strong> the results from one or more testsapplied to the same <strong>topGO</strong>data object. The function can take a variable number of <strong>topGO</strong>result objectsand it returns a data.frame containing the top topNodes GO terms identified by the method specified <strong>with</strong>the orderBy argument. This argument allows the user decide which p-values should be used for ordering theGO terms.
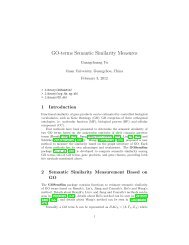
GO.ID Term Annotated Significant Expected Rank in classic classic KS weight1 GO:0050852 T cell receptor signaling pathway 71 18 6.17 5 2.2e-05 0.00069 2.2e-052 GO:0050857 positive regulation of antigen receptor-... 6 5 0.52 7 2.7e-05 4.9e-05 2.7e-053 GO:0030101 natural killer cell activation 7 5 0.61 8 8.7e-05 0.00315 8.7e-054 GO:0022028 tangential migration from the subventric... 5 4 0.43 12 0.00026 0.00573 0.000265 GO:0045086 positive regulation of interleukin-2 bio... 6 4 0.52 24 0.00073 0.01295 0.000736 GO:0045588 positive regulation of gamma-delta T cel... 6 4 0.52 25 0.00073 0.01295 0.000737 GO:0030217 T cell differentiation 55 18 4.78 1 3.7e-07 8.4e-05 0.000908 GO:0033077 T cell differentiation in thymus 26 8 2.26 36 0.00116 0.00105 0.001169 GO:0016126 sterol biosynthetic process 16 6 1.39 40 0.00156 0.00032 0.0015610 GO:0021795 cerebral cortex cell migration 7 4 0.61 41 0.00159 0.01467 0.0015911 GO:0042102 positive regulation of T cell proliferat... 22 7 1.91 46 0.00190 0.02569 0.0019012 GO:0032787 monocarboxylic acid metabolic process 86 17 7.48 34 0.00092 0.01003 0.0019813 GO:0045987 positive regulation of smooth muscle con... 8 4 0.70 52 0.00296 0.00101 0.0029614 GO:0002763 positive regulation of myeloid leukocyte... 18 6 1.56 56 0.00310 0.07439 0.0031015 GO:0010453 regulation of cell fate commitment 9 4 0.78 65 0.00496 0.09346 0.0049616 GO:0042472 inner ear morphogenesis 14 5 1.22 68 0.00499 0.11912 0.0049917 GO:0006107 oxaloacetate metabolic process 5 3 0.43 73 0.00570 0.05985 0.0057018 GO:0019987 negative regulation of anti-apoptosis 5 3 0.43 74 0.00570 0.03795 0.0057019 GO:0048339 paraxial mesoderm development 5 3 0.43 75 0.00570 0.04614 0.0057020 GO:0051930 regulation of sensory perception of pain 5 3 0.43 76 0.00570 0.06810 0.00570Table 3: Significance of GO terms according to different tests.> allRes goID print(showGroupDensity(GOdata, goID, ranks = TRUE))GO:0050852 (23)0.0030.0020.001Density● ●●● ●●● ● ● ●complementary (756)●0.0000.0030.0020.0010.000●●●● ●● ●●●●●●●● ●●● ● ●●●●● ●●●● ● ●●●●●●●●●●●● ● ●●●●●●● ●●●●●−200 0 200 400 600 800<strong>Gene</strong>'s rankFigure 5: Distribution of the gene’ rank from GO:0050852, compared <strong>with</strong> the null distribution.
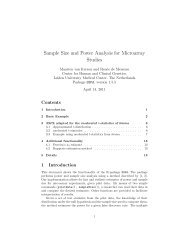
We can see in Figure 5 that the genes annotated to GO:0050852 have low ranks (genes <strong>with</strong> low p-value ofthe t-test). The distribution of the ranks is skewed on the left side compared <strong>with</strong> the reference distributiongiven by the complementary gene <strong>set</strong>. This is a nice example in which there is a significant difference in thedistribution of scores between the gene <strong>set</strong> and the complementary <strong>set</strong>, and we see from Table 3 that thisGO is found as significantly enriched by all methods used.In the above example, the genes <strong>with</strong> a p-value equal to 1 were omitted. They can be included using thevalue FALSE for the rm.one argument in the showGroupDensity function.Another useful function for analysing terms of interest is print<strong>Gene</strong>s. The function will generate a table<strong>with</strong> all the genes/probes annotated to the specified GO term. Various type of identifiers, the gene nameand the p-values/statistics are provided in the table.> goID gt showSigOfNodes(GOdata, score(resultFis), firstSigNodes = 5, useInfo = "all")> showSigOfNodes(GOdata, score(resultWeight), firstSigNodes = 5, useInfo = "def")> printGraph(GOdata, resultFis, firstSigNodes = 5, fn.prefix = "tGO", useInfo = "all",+ pdfSW = TRUE)> printGraph(GOdata, resultWeight, firstSigNodes = 5, fn.prefix = "tGO", useInfo = "def",+ pdfSW = TRUE)In the plots, the significant nodes are represented as rectangles. The plotted graph is the upper inducedgraph generated by these significant nodes. These graph plots are used to see how the significant GO termsare distributed in the hierarchy. It is a very useful tool to realize behaviour of various <strong>enrichment</strong> methodsand to better understand which of the significant GO terms are really of interest.We can emphasise differences between two methods using the printGraph function:
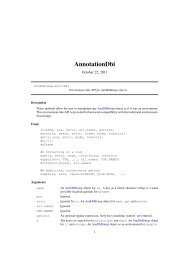
GO:0001775GO:0008150biological_process1.000000318 / 3658GO:0032502GO:0032501GO:0023052GO:0065007developmental proces...multicellular organi...signalingbiological regulatio...0.8700550.8277300.7932270.91660987 / 1096113 / 1384104 / 1267194 / 2356GO:0048856GO:0007275GO:0009987GO:0002376GO:0050789GO:0050896anatomical structure...multicellular organi...cellular processimmune system proces...regulation of biolog...response to stimulus0.9409330.9421460.6114190.0801670.8287510.59578874 / 98076 / 1005297 / 342359 / 572187 / 2236159 / 1847GO:0048731GO:0048869GO:0050794GO:0051716GO:0002682GO:0006955GO:0048583GO:0048518system developmentcellular development...cell activationregulation of cellul...cellular response to...regulation of immune...immune responseregulation of respon...positive regulation ...0.8141810.1157840.0013820.7864750.5832360.0146570.0722370.0398400.94209172 / 89863 / 63040 / 287179 / 2130120 / 139539 / 31842 / 38867 / 63378 / 1029GO:0048513GO:0002520GO:0045321GO:0050865GO:0007165GO:0050776GO:0002684GO:0048584organ developmentimmune system develo...leukocyte activationregulation of cell a...signal transductionregulation of immune...positive regulation ...positive regulation ...0.7881760.0003730.0019340.0004570.7298500.0110650.0047400.04691449 / 61729 / 17430 / 20123 / 12798 / 117830 / 22630 / 21335 / 304GO:0048534GO:0046649GO:0002694GO:0007166GO:0002764GO:0050778hemopoietic or lymph...lymphocyte activatio...regulation of leukoc...cell surface recepto...immune response−regu...positive regulation ...0.0005950.0006070.0003600.4949350.0046920.00185727 / 16229 / 17923 / 12557 / 65021 / 13325 / 157GO:0030097GO:0030154GO:0042110GO:0051249GO:0002768GO:0002253hemopoiesiscell differentiationT cell activationregulation of lympho...immune response−regu...activation of immune...0.0003550.0932192.21e−050.0001470.0009680.00309727 / 15763 / 62126 / 12723 / 11818 / 9422 / 137GO:0002521leukocyte differenti...1.80e−0523 / 104GO:0050863regulation of T cell...2.12e−0521 / 91GO:0002757immune response−acti...0.00390621 / 131GO:0030098lymphocyte different...8.35e−0619 / 73GO:0002429immune response−acti...0.00074218 / 92GO:0030217T cell differentiati...3.66e−0718 / 55GO:0050851antigen receptor−med...0.00064718 / 91GO:0050852T cell receptor sign...2.15e−0518 / 71Figure 6: The subgraph induced by the top 5 GO terms identified by the classic algorithm for scoring GO termsfor <strong>enrichment</strong>. Boxes indicate the 5 most significant terms. Box color represents the relative significance, rangingfrom dark red (most significant) to light yellow (least significant). Black arrows indicate is-a relationships andred arrows part-of relationships.> printGraph(GOdata, resultWeight, firstSigNodes = 10, resultFis, fn.prefix = "tGO",+ useInfo = "def")> printGraph(GOdata, resultElim, firstSigNodes = 15, resultFis, fn.prefix = "tGO",+ useInfo = "all")
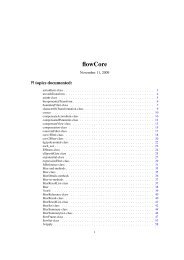
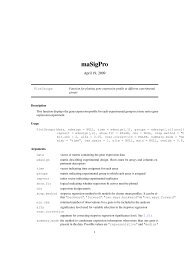
GO:0051674localization of cellGO:0048870cell motilityGO:0016477cell migrationGO:0051179localizationGO:0021885forebrain cell migra...GO:0006928cellular component m...GO:0030900forebrain developmen...GO:0022029telencephalon cell m...GO:0021537telencephalon develo...GO:0022028tangential migration...GO:0021988olfactory lobe devel...GO:0021772olfactory bulb devel...GO:0048856anatomical structure...GO:0007399nervous system devel...GO:0007417central nervous syst...GO:0007420brain developmentGO:0040011locomotionGO:0048731system developmentGO:0048513organ developmentGO:0007275multicellular organi...GO:2000026regulation of multic...GO:0032501multicellular organi...GO:0051239regulation of multic...GO:0002520immune system develo...GO:0048534hemopoietic or lymph...GO:0030097hemopoiesisGO:0032502developmental proces...GO:0051094positive regulation ...GO:0045597positive regulation ...GO:0050793regulation of develo...GO:0045595regulation of cell d...GO:0048869cellular development...GO:0030154cell differentiationGO:0002521leukocyte differenti...GO:0030098lymphocyte different...GO:0045619regulation of lympho...GO:0045621positive regulation ...GO:0051249regulation of lympho...GO:0051251positive regulation ...GO:0045321leukocyte activationGO:0046649lymphocyte activatio...GO:0045580regulation of T cell...GO:0045582positive regulation ...GO:0030217T cell differentiati...GO:0001775cell activationGO:0050865regulation of cell a...GO:0002694regulation of leukoc...GO:0030101natural killer cell ...GO:0050870positive regulation ...GO:0009987cellular processGO:0002696positive regulation ...GO:0050863regulation of T cell...GO:0045586regulation of gamma−...GO:0042492gamma−delta T cell d...GO:0045588positive regulation ...GO:0008150biological_processGO:0050794regulation of cellul...GO:0048522positive regulation ...GO:0050867positive regulation ...GO:0042110T cell activationGO:0046629gamma−delta T cell a...GO:0046643regulation of gamma−...GO:0046645positive regulation ...GO:0065007biological regulatio...GO:0007154cell communicationGO:0010646regulation of cell c...GO:0010647positive regulation ...GO:0050789regulation of biolog...GO:0048518positive regulation ...GO:0023052signalingGO:0023056positive regulation ...GO:0023051regulation of signal...GO:0002376immune system proces...GO:0002682regulation of immune...GO:0002684positive regulation ...GO:0009966regulation of signal...GO:0009967positive regulation ...GO:0050857positive regulation ...GO:0050854regulation of antige...GO:0051716cellular response to...GO:0007165signal transductionGO:0007166cell surface recepto...GO:0048583regulation of respon...GO:0002768immune response−regu...GO:0002429immune response−acti...GO:0050851antigen receptor−med...GO:0050852T cell receptor sign...GO:0050896response to stimulusGO:0048584positive regulation ...GO:0002764immune response−regu...GO:0002757immune response−acti...GO:0006955immune responseGO:0050776regulation of immune...GO:0050778positive regulation ...GO:0002253activation of immune...Figure 7: The subgraph induced by the top 5 GO terms identified by the weight algorithm for scoring GO termsfor <strong>enrichment</strong>. Boxes indicate the 5 most significant terms. Box color represents the relative significance, rangingfrom dark red (most significant) to light yellow (least significant). Black arrows indicate is-a relationships andred arrows part-of relationships.
8 Session InformationThe version number of R and packages loaded for generating the vignette were:• R version 2.13.0 (2011-04-13), x86_64-unknown-linux-gnu• Locale: LC_CTYPE=en_US.UTF-8, LC_NUMERIC=C, LC_TIME=en_US.UTF-8, LC_COLLATE=C,LC_MONETARY=C, LC_MESSAGES=en_US.UTF-8, LC_PAPER=en_US.UTF-8, LC_NAME=C, LC_ADDRESS=C,LC_TELEPHONE=C, LC_MEASUREMENT=en_US.UTF-8, LC_IDENTIFICATION=C• Base packages: base, data<strong>set</strong>s, grDevices, graphics, grid, methods, stats, utils• Other packages: ALL 1.4.7, AnnotationDbi 1.14.0, Biobase 2.12.0, DBI 0.2-5, GO.db 2.5.0,RSQLite 0.9-4, Rgraphviz 1.30.0, SparseM 0.88, genefilter 1.34.0, graph 1.30.0, hgu95av2.db 2.5.0,lattice 0.19-23, multtest 2.8.0, org.Hs.eg.db 2.5.0, <strong>topGO</strong> 2.4.0, xtable 1.5-6• Loaded via a namespace (and not attached): MASS 7.3-12, annotate 1.30.0, splines 2.13.0,survival 2.36-5, tools 2.13.0ReferencesAckermann, M. and Strimmer, K. (2009). A general modular framework for gene <strong>set</strong> <strong>enrichment</strong> <strong>analysis</strong>.BMC Bioinformatics, 10:47. 10.1186/1471-2105-10-47.Alexa, A., Rahnenführer, J., and Lengauer, T. (2006). Improved scoring of functional groups from geneexpression data by decorrelating go graph structure. Bioinformatics (Oxford, England), 22:1600–1607.10.1093/bioinformatics/btl140.Chiaretti, S., et al. (2004). <strong>Gene</strong> expression profile of adult T-cell acute lymphocytic leukemia identifiesdistinct sub<strong>set</strong>s of patients <strong>with</strong> different response to therapy and survival. Blood, 103(7):2771–2778.Consortium, G. O. (2001). Creating the <strong>Gene</strong> Ontology Resource: Design and Implementation. GenomeResearch, 11:1425–1433. Cold Spring Harbor Laboratory Press.Draghici, S., Sellamuthu, S., and Khatri, P. (2006). Babel’s tower revisited: a universal resource forcross-referencing across annotation databases. Bioinformatics (Oxford, England), 22:btl372v1–2939.10.1093/bioinformatics/btl372.Goeman, J. J. and Bühlmann, P. (2007). Analyzing gene expression data in terms of gene <strong>set</strong>s: methodologicalissues. Bioinformatics (Oxford, England), 23:980–987. 10.1093/bioinformatics/btm051.Grossmann, S., Bauer, S., Robinson, P. N., and Vingron, M. (2007). Improved detection of overrepresentationof gene-ontology annotations <strong>with</strong> parent child <strong>analysis</strong>. Bioinformatics, 23:3024. 10.1093/bioinformatics/btm440.Yon Rhee, S., Wood, V., Dolinski, K., and Draghici, S. (2008). Use and misuse of the gene ontologyannotations. Nature reviews. <strong>Gene</strong>tics, advanced online publication:509–515. 10.1038/nrg2363.