Development of a Computer Model to Optimize Recharge ...
Development of a Computer Model to Optimize Recharge ...
Development of a Computer Model to Optimize Recharge ...

You also want an ePaper? Increase the reach of your titles
YUMPU automatically turns print PDFs into web optimized ePapers that Google loves.
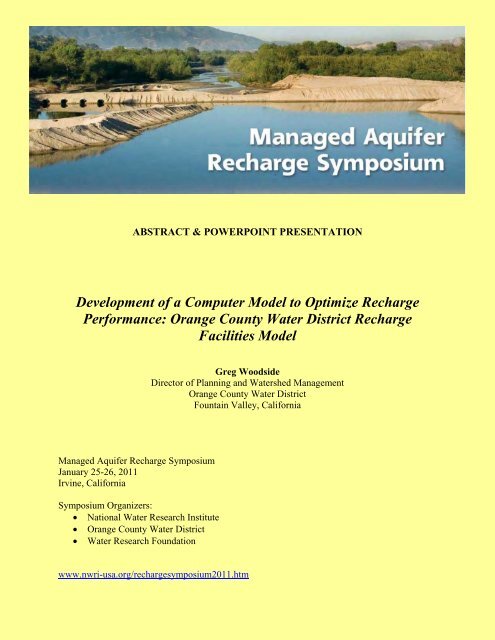
ABSTRACT & POWERPOINT PRESENTATION<br />
<strong>Development</strong> <strong>of</strong> a <strong>Computer</strong> <strong>Model</strong> <strong>to</strong> <strong>Optimize</strong> <strong>Recharge</strong><br />
Performance: Orange County Water District <strong>Recharge</strong><br />
Facilities <strong>Model</strong><br />
Managed Aquifer <strong>Recharge</strong> Symposium<br />
January 25-26, 2011<br />
Irvine, California<br />
Symposium Organizers:<br />
• National Water Research Institute<br />
• Orange County Water District<br />
• Water Research Foundation<br />
Greg Woodside<br />
Direc<strong>to</strong>r <strong>of</strong> Planning and Watershed Management<br />
Orange County Water District<br />
Fountain Valley, California<br />
www.nwri-usa.org/rechargesymposium2011.htm
<strong>Development</strong> <strong>of</strong> a <strong>Computer</strong> <strong>Model</strong> <strong>to</strong> <strong>Optimize</strong> <strong>Recharge</strong> Performance –<br />
OCWD <strong>Recharge</strong> Facilities <strong>Model</strong><br />
Greg Woodside (OCWD), Adam Hutchinson (OCWD), Craig Miller (OCWD)<br />
Marcelo Regina<strong>to</strong> (CH2M HILL), Terry Foreman (CH2M HILL)<br />
The Orange County Water District (OCWD) developed a groundwater recharge<br />
operation model for the District’s 1,100 acres <strong>of</strong> surface recharge facilities. The<br />
computer model was developed as water resources planning <strong>to</strong>ol <strong>to</strong> estimate the<br />
<strong>to</strong>tal water percolated through the spreading basins and <strong>to</strong> evaluate system<br />
performance under different future inflow scenarios and different system<br />
configurations.<br />
The OCWD surface recharge facilities are located in the cities <strong>of</strong> Anaheim and<br />
Orange in southern California. The primary source <strong>of</strong> recharge water is the Santa<br />
Ana River (SAR) below Prado Dam in Riverside County. Other replenishment water<br />
sources include purified water from the Groundwater Replenishment System<br />
(GWRS) and water purchased from Metropolitan Water District <strong>of</strong> Southern<br />
California. The recharge facilities include over 20 recharge basins, two inflatable<br />
dams, pipelines <strong>to</strong> divert water from the SAR, pump stations <strong>to</strong> dewater basins, and<br />
conveyance systems.<br />
Several fac<strong>to</strong>rs influence the recharge rate on each recharge basin. The recharge<br />
rate decays through time mainly as a function water quality, primarily the amount <strong>of</strong><br />
fine-grained sediment in the water entering the basin. Different water sources and<br />
scheduled cleaning <strong>of</strong> the basins make a significant impact on the recharge capacity<br />
<strong>of</strong> the system and its operation. Other fac<strong>to</strong>rs that impact the recharge capacity are<br />
the physical capabilities <strong>to</strong> divert, convey, and s<strong>to</strong>re water and a complex chain <strong>of</strong><br />
operational rules through the system.<br />
The model was constructed using Goldsim s<strong>of</strong>tware, a general simulation s<strong>of</strong>tware<br />
for dynamically modeling complex systems. The model runs on a desk<strong>to</strong>p personal<br />
computer using a graphical user interface. It simulates Prado Dam operations,<br />
Santa Ana River flow, each recharge facility, and the District’s pumping stations and<br />
pipelines that convey recharge water. The rate <strong>of</strong> percolation in each recharge<br />
facility and amount <strong>of</strong> water in s<strong>to</strong>rage is accounted for in the model using<br />
equations that define the change in percolation through time. The model also<br />
provides a complete water balance <strong>of</strong> the system. A time step <strong>of</strong> one day is used in<br />
the model.<br />
One <strong>of</strong> the most challenging aspects in developing the model was capturing the logic<br />
for basin cleaning in the model. When the recharge rate in a particular basin<br />
declines <strong>to</strong> a certain minimum level, inflow <strong>to</strong> the basin is terminated and the water is<br />
pumped out <strong>to</strong> another basin <strong>to</strong> allow cleaning <strong>of</strong> the basin. The logic <strong>of</strong> where the<br />
pumped water is conveyed and subsequently percolated and properly accounting for<br />
these operational conditions required careful description <strong>of</strong> a series <strong>of</strong> operating
ules in the model. The model accounts for the cleaning time, maximum initial<br />
percolation, and recharge rate decline <strong>of</strong> each basin.<br />
The model has been used successfully <strong>to</strong> evaluate potential changes in recharge<br />
that would occur if the District were <strong>to</strong> construct improvements <strong>to</strong> the recharge<br />
system, such as removing sediment from Santa Ana River water, new recharge<br />
facilities are constructed, existing facilities are improved, or increased s<strong>to</strong>rage is<br />
achieved at Prado Dam.
<strong>Development</strong> <strong>of</strong> a <strong>Computer</strong> <strong>Model</strong> <strong>to</strong><br />
<strong>Optimize</strong> <strong>Recharge</strong> Performance:<br />
OCWD <strong>Recharge</strong> Facilities <strong>Model</strong><br />
Greg Woodside, Adam Hutchinson, Craig Miller/OCWD<br />
Terry Foreman, Marcelo Regina<strong>to</strong>/CH2M HILL<br />
Managed Aquifer <strong>Recharge</strong> Symposium<br />
January 26, 2011
Summary <strong>of</strong> OCWD <strong>Recharge</strong><br />
System in Anaheim and Orange<br />
► 30 recharge facilities<br />
�<br />
Approx. 1,100 wetted acres<br />
► 5 points <strong>of</strong> diversion from SAR<br />
► SAR water, local run<strong>of</strong>f, GWRS water,<br />
imported water<br />
► 5 pump stations <strong>to</strong> facilitate basin cleaning<br />
► Pump station <strong>to</strong> pump water <strong>to</strong> Santiago<br />
Basins<br />
► 26,000 acre-feet <strong>of</strong> s<strong>to</strong>rage capacity
►<br />
►<br />
Purpose <strong>of</strong> <strong>Model</strong><br />
Optimization <strong>of</strong> recharge and cleaning<br />
activities<br />
Planning <strong>to</strong>ol <strong>to</strong> determine how much<br />
additional water could be recharged if new<br />
facilities are built, existing facilities are<br />
improved, or Prado s<strong>to</strong>rage program is<br />
modified
Little Warner<br />
Warner Basin<br />
Warner System<br />
Conrock<br />
Weir Pond #4<br />
Huckleberry
Anaheim-Kraemer<br />
Anaheim Kraemer-Miller Miller System<br />
Anaheim Lake<br />
Kraemer Basin<br />
Miller Basin
►<br />
►<br />
►<br />
►<br />
►<br />
<strong>Model</strong> Approach<br />
Define operational rules<br />
Specify SAR, GWR System, MWD, local inflows<br />
Demand driven model<br />
� Demand = percolation capacity<br />
<strong>Model</strong> based on GoldSim s<strong>of</strong>tware<br />
�<br />
�<br />
GoldSim originally developed by Golder Inc<br />
Now owned by GoldSim Technology Group<br />
Route water based on percolation capacity and<br />
available supply<br />
� Includes pipeline and pumping system capacities
►<br />
<strong>Model</strong> Approach (cont.)<br />
Percolation primarily defined by equations:<br />
�<br />
�<br />
Exponential percolation decay as function <strong>of</strong> previous<br />
accumulated percolation (Q t ) with a Depth/MaxDepth<br />
coefficient (developed for basins with sufficient his<strong>to</strong>rical<br />
data)<br />
Q<br />
=<br />
Depth<br />
Depth<br />
Max<br />
( d<br />
( −Qt<br />
× b)<br />
+<br />
c)<br />
Linear percolation decay as a function <strong>of</strong> days since last<br />
cleaning<br />
×<br />
e
Basin Percolation (cfs)<br />
140<br />
120<br />
100<br />
80<br />
60<br />
40<br />
20<br />
Santiago Basin<br />
► Percolation defined as function <strong>of</strong> water<br />
surface elevation<br />
Santiago Basins Percolation Lookup Table<br />
0<br />
140 160 180 200 220 240 260 280<br />
Santiago Basin Elevation (ft msl)
Review <strong>of</strong> <strong>Model</strong> Results<br />
► Compare model results <strong>to</strong> his<strong>to</strong>rical data<br />
► Good comparison <strong>of</strong> model results <strong>to</strong><br />
his<strong>to</strong>rical data indicates model can replicate<br />
past performance<br />
► Helps determine validity <strong>of</strong> model
Percolation rate (cfs)<br />
140<br />
120<br />
100<br />
80<br />
60<br />
40<br />
20<br />
0<br />
10/9/2004<br />
12/9/2004<br />
2/9/2005<br />
4/9/2005<br />
6/9/2005<br />
8/9/2005<br />
10/9/2005<br />
12/9/2005<br />
2/9/2006<br />
4/9/2006<br />
Warner Basin Percolation<br />
Equation <strong>Development</strong><br />
His<strong>to</strong>rical 10 day moving Average <strong>Model</strong> Equation<br />
6/9/2006<br />
8/9/2006<br />
10/9/2006<br />
12/9/2006<br />
2/9/2007<br />
4/9/2007<br />
6/9/2007<br />
8/9/2007<br />
10/9/2007<br />
12/9/2007<br />
2/9/2008<br />
4/9/2008<br />
6/9/2008<br />
8/9/2008
Percolation rate (cfs)<br />
140<br />
120<br />
100<br />
80<br />
60<br />
40<br />
20<br />
0<br />
12/8/2002<br />
1/8/2003<br />
2/8/2003<br />
3/8/2003<br />
4/8/2003<br />
5/8/2003<br />
6/8/2003<br />
7/8/2003<br />
8/8/2003<br />
9/8/2003<br />
10/8/2003<br />
11/8/2003<br />
12/8/2003<br />
1/8/2004<br />
Anaheim Lake Percolation<br />
Equation <strong>Development</strong><br />
His<strong>to</strong>rical 10 day moving Average <strong>Model</strong> Equation<br />
2/8/2004<br />
3/8/2004<br />
4/8/2004<br />
5/8/2004<br />
6/8/2004<br />
7/8/2004<br />
8/8/2004<br />
9/8/2004<br />
10/8/2004<br />
11/8/2004<br />
12/8/2004<br />
1/8/2005<br />
2/8/2005<br />
3/8/2005<br />
4/8/2005<br />
5/8/2005<br />
6/8/2005<br />
7/8/2005<br />
8/8/2005<br />
9/8/2005<br />
10/8/2005
Percolation rate (cfs)<br />
140<br />
120<br />
100<br />
80<br />
60<br />
40<br />
20<br />
0<br />
1/9/2003<br />
3/9/2003<br />
5/9/2003<br />
7/9/2003<br />
9/9/2003<br />
11/9/2003<br />
1/9/2004<br />
3/9/2004<br />
5/9/2004<br />
7/9/2004<br />
9/9/2004<br />
11/9/2004<br />
Kraemer Basin Percolation<br />
Equation <strong>Development</strong><br />
His<strong>to</strong>rical 10 day moving avg Equation1<br />
1/9/2005<br />
3/9/2005<br />
5/9/2005<br />
7/9/2005<br />
9/9/2005<br />
11/9/2005<br />
1/9/2006<br />
3/9/2006<br />
5/9/2006<br />
7/9/2006<br />
9/9/2006<br />
11/9/2006<br />
1/9/2007<br />
3/9/2007<br />
5/9/2007<br />
7/9/2007<br />
9/9/2007<br />
11/9/2007<br />
1/9/2008
400<br />
350<br />
300<br />
250<br />
cfs 200<br />
150<br />
100<br />
50<br />
0<br />
7/1/2002<br />
10/1/2002<br />
1/1/2003<br />
4/1/2003<br />
7/1/2003<br />
10/1/2003<br />
<strong>Model</strong> vs. His<strong>to</strong>rical Percolation<br />
(Warner, Anaheim, Kraemer, Miller, Burris and Santiago Basins)<br />
1/1/2004<br />
4/1/2004<br />
7/1/2004<br />
Hist_Perc [cfs] <strong>Model</strong>_Perc [cfs]<br />
10/1/2004<br />
1/1/2005<br />
4/1/2005<br />
7/1/2005<br />
10/1/2005<br />
1/1/2006<br />
4/1/2006<br />
7/1/2006<br />
10/1/2006<br />
1/1/2007<br />
4/1/2007<br />
7/1/2007<br />
10/1/2007<br />
1/1/2008<br />
4/1/2008
ac-ft<br />
25000<br />
20000<br />
15000<br />
10000<br />
5000<br />
0<br />
7/1/2002<br />
10/1/2002<br />
1/1/2003<br />
4/1/2003<br />
7/1/2003<br />
<strong>Model</strong> vs. His<strong>to</strong>rical S<strong>to</strong>rage<br />
Includes only Warner, Anaheim, Kraemer, Miller, Burris and Santiago Basins<br />
10/1/2003<br />
1/1/2004<br />
4/1/2004<br />
His<strong>to</strong>rical_S<strong>to</strong>rage [af] <strong>Model</strong>_S<strong>to</strong>rage [af] Scen1<br />
7/1/2004<br />
10/1/2004<br />
1/1/2005<br />
4/1/2005<br />
7/1/2005<br />
10/1/2005<br />
1/1/2006<br />
4/1/2006<br />
7/1/2006<br />
10/1/2006<br />
1/1/2007<br />
4/1/2007<br />
7/1/2007<br />
10/1/2007<br />
1/1/2008<br />
4/1/2008
On-Going On Going Use <strong>of</strong> <strong>Model</strong><br />
► Evaluation <strong>of</strong> benefits <strong>of</strong> sediment removal<br />
�<br />
�<br />
Increased percolation performance with sediment<br />
removal<br />
Evaluate increased s<strong>to</strong>rmwater capture and<br />
recharge<br />
► Evaluation <strong>of</strong> benefits <strong>of</strong> potential new<br />
recharge facilities<br />
► Potential incorporation <strong>of</strong> optimization<br />
module