The Missing Jolt - Journal of 9/11 Studies
The Missing Jolt - Journal of 9/11 Studies
The Missing Jolt - Journal of 9/11 Studies

You also want an ePaper? Increase the reach of your titles
YUMPU automatically turns print PDFs into web optimized ePapers that Google loves.
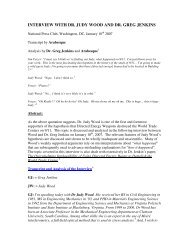
Graeme MacQueenTony SzambotiApril 22, 2009*<strong>The</strong> <strong>Missing</strong> <strong>Jolt</strong>:A Simple Refutation <strong>of</strong> the NIST-Bazant Collapse HypothesisIn its Final Report on the Collapse <strong>of</strong> the World Trade Center Towers, the National Institute <strong>of</strong>Standards and Technology summarizes its three year study and outlines its explanation <strong>of</strong> thetotal collapse <strong>of</strong> WTC 1 and WTC 2. [1]Readers <strong>of</strong> the report will find that the roughly $20 million expended on this effort have resultedin an explanation <strong>of</strong> the total collapse <strong>of</strong> these buildings that is so vague it barely qualifies as ahypothesis. But it does have one crucial feature <strong>of</strong> a hypothesis: it is, in principle, falsifiable. Infact, it is easy to demonstrate that it is false.In this paper we will, concentrating on the North Tower, <strong>of</strong>fer a refutation that is:• easy to understand but reasonably precise• capable <strong>of</strong> being stated briefly• verifiable by any reader with average computer skills and a grasp <strong>of</strong> simple mathematics.NIST’s Hypothesis <strong>of</strong> Total Collapse:Three essential elements <strong>of</strong> NIST’s hypothesis <strong>of</strong> total collapse are made explicit in the FinalReport and the companion volumes <strong>of</strong> the study:1. Because <strong>of</strong> damage to stories 93 to 98, and especially because <strong>of</strong> column buckling due to fire,the top 12 stories <strong>of</strong> the North Tower (99-<strong>11</strong>0) plus the ro<strong>of</strong> were, in effect, separated from therest <strong>of</strong> the Tower and began to behave as a unit. [2]2. This “rigid block” <strong>of</strong> 12 stories plus the ro<strong>of</strong> began to move. First it tilted, and then it abruptlyfell onto the stories beneath it. [3]3. <strong>The</strong> fall <strong>of</strong> the rigid block caused such damage to the lower structure that “global collapsebegan.”[4]<strong>The</strong> rigidity <strong>of</strong> the upper block <strong>of</strong> stories is crucial to this explanation. If the upper block were tobreak, disintegrate or flow on impact it would certainly not threaten the 92 intact floors beneathit.In addition, the rigid block had to fall onto the rest <strong>of</strong> the building. Although this seems obvious,the NIST authors are <strong>of</strong>ten shy about saying it. We hear about the rigid block’s “descent.”[5] Wehear <strong>of</strong> tilting and “downward movement.”[6] We have to look carefully to find the NISTauthors using the language <strong>of</strong> falling. Whatever the reasons for their reticence, it is clear that itwill not do for the upper block to ease itself onto the building beneath it, with a gradual creaking<strong>of</strong> buckled columns and sagging floors. If this were to happen, why would the structure beneathcollapse?<strong>Journal</strong> <strong>of</strong> 9<strong>11</strong> <strong>Studies</strong> 1January 2009/Volume 24
<strong>The</strong>re was nothing special about the weight <strong>of</strong> the upper block, rigid or otherwise. <strong>The</strong> lower part<strong>of</strong> the Tower had held up this weight without difficulty since 1970. <strong>The</strong> lower block had 283cold steel columns, with less than 30% <strong>of</strong> their total load capacity being utilized for gravityloads, because <strong>of</strong> the factors <strong>of</strong> safety designed into the structure and the need to withstand highwinds—and gravity loads were essentially the only loads the columns would have been subjectto on a day such as 9/<strong>11</strong> with little wind. <strong>The</strong> lower block was not weak, nor (excluding stories93-98) was it damaged by plane impact or fire. <strong>The</strong> weight <strong>of</strong> the upper block posed no threat toit. If there were to be a threat, it had to come from the momentum <strong>of</strong> the upper block. Butmomentum is a product <strong>of</strong> mass and velocity, and since the upper block could not increase itsmass it had to increase, if it were to become a threat, its velocity. Since NIST’s theory assumesthe only energy at play at this stage <strong>of</strong> events was gravitational, the upper block had to fall, andthe greater its velocity the greater its momentum. <strong>The</strong> longer and the less impeded its fall, thegreater would be its impact on the lower structure. So it is no surprise that the NIST authors,however shy they are about affirming it, eventually come out in favour <strong>of</strong> the falling <strong>of</strong> the upperblock. [7]Zdenek Bazant and Yong Zhou, with whose September 13, 2001 back-<strong>of</strong>-the-envelope theory(with subsequent revisions and additions) NIST largely agrees, have never hesitated to say thatthe upper block fell. [8] Bazant has likewise been frank about the need for severe impact as theupper and lower structures met: he believes the impact may have been powerful enough to havebeen recorded by seismometers. [9] In his view, collapse initiation <strong>of</strong> the lower structure required“one powerful jolt.”[10] Of course, if there was a powerful jolt to the lower structure there mustalso have been a powerful jolt to the upper falling structure, in accord with Newton’s Third Law.In order to keep a sense <strong>of</strong> reality as we discuss NIST’s theory it may be useful to label the threeinteracting parts <strong>of</strong> the North Tower, as they are pictured by NIST, as RB-12+, DS-6 and RB-92.Where RB stands for rigid block, DS stands for damaged structure, and the numbers followingthe letters refer to the number <strong>of</strong> stories in each structure. <strong>The</strong> upper block comprised the 12stories <strong>of</strong> 99-<strong>11</strong>0 as well as the ro<strong>of</strong> structure with antenna and hat truss; the intermediate areawas damaged by plane impact and fire and was six stories high (93-98 inclusive); and the lowerblock was rigid and comprised, in addition to subterranean levels, the first 92 stories <strong>of</strong> thebuilding.<strong>The</strong>se designations actually underestimate the contrast between RB-12+ and RB-92, because thelatter was not only largely undamaged by fire but was more massive per story. It was alsostronger: the Tower’s columns tapered as they ascended. [<strong>11</strong>] Yet the fall <strong>of</strong> RB-12+, we aresupposed to believe, put a catastrophic end to DS-6 and RB-92.What NIST essentially says, agreeing with Bazant, is that the lighter and weaker part initially fellwith a powerful jolt onto the heavier and stronger part, which could not withstand its momentum,and that this caused a progressive collapse to initiate smashing the lower block to bits all the wayto the ground.<strong>The</strong> NIST Final Report does not tell us what happened to RB-12+ after its impact with the twostructures beneath it. Did it fall through them all the way to the ground (that is, to the rubble heapon the ground), maintaining considerable mass and rigidity the whole time--as Bazant argued in2001 and has continued to argue? [12]<strong>Journal</strong> <strong>of</strong> 9<strong>11</strong> <strong>Studies</strong> 2January 2009/Volume 24
On this the NIST authors are silent.NIST also does not tell us how far RB-12+ fell before its impact with intact structure. Did it fallone story (roughly 12 feet), or several stories? We are left in the dark. Once again Bazant comesto the rescue. It fell “at least one story,” he says. [13]To his credit, Bazant is willing to state the essential elements <strong>of</strong> the hypothesis. If this hypothesisis to hold any water at all there must be substantial impact: RB-12+ has a lot <strong>of</strong> work to do, so ithad better fall at least one story.As we will show, for the purposes <strong>of</strong> the present refutation it does not matter whether RB-12+fell one story, six stories, or somewhere in between.<strong>The</strong> Necessary <strong>Jolt</strong>:As Bazant has said, when the top part fell and struck the stories beneath it, there had to be apowerful jolt. While a jolt entails acceleration <strong>of</strong> the impacted object it requires deceleration <strong>of</strong>the impacting object. Even a hammer hitting a nail decelerates, and if the hammer is striking astrong, rigid body fixed to the earth its deceleration will be abrupt and dramatic.Although NIST does not explicitly speak, like Bazant, <strong>of</strong> a “jolt”, and may therefore be thoughtto evade this paper’s refutation, it is impossible for NIST to escape the implications <strong>of</strong> its ownassertions. <strong>The</strong> NIST report speaks <strong>of</strong> a strong, rigid structure (the upper structure or rigid block)falling freely onto another strong, rigid structure (the intact part <strong>of</strong> the building below thedamaged area): the jolt cannot be avoided. [14]This was a necessary jolt. Without it the required work could not have been done.Testing for Deceleration:If a jolt occurred there would have been high short-term deceleration <strong>of</strong> the upper block. Whynot simply check for this deceleration? It is not difficult. We will:• examine a video clip <strong>of</strong> the North Tower’s collapse• find a point on the upper block <strong>of</strong> the North Tower, the progress <strong>of</strong> which can beobserved and measured in the early stages <strong>of</strong> the collapse• plot the progress <strong>of</strong> this point on a graph• check for evidence <strong>of</strong> decelerationWe have chosen a well known video clip <strong>of</strong> the collapse associated with French film maker,Etienne Sauret. [15] <strong>The</strong> Sauret clip has advantages over many others. It is a single, continuoussequence with no changes in camera angle and no zooming in and out. <strong>The</strong>re is a very slight shiftin the camera position relative to distant objects caused by a trembling <strong>of</strong> the camera severalseconds prior to the collapse, but this is irrelevant to us since all our measurements are takenafter the shift. <strong>The</strong> camera is very steady throughout the time we are making our measurements,as we can confirm by measuring the position <strong>of</strong> the picture frame relative to stationary objects. Inaddition, the image <strong>of</strong> the north face <strong>of</strong> the North Tower is exceptionally clear in these images.<strong>Journal</strong> <strong>of</strong> 9<strong>11</strong> <strong>Studies</strong> 3January 2009/Volume 24
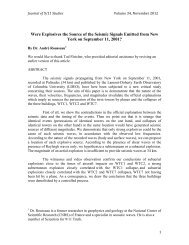
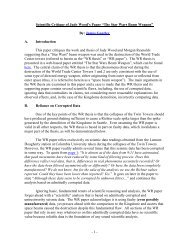
Here is how we proceed: [16]1. We save the Sauret footage to our hard drive.2. We break the 1 minute, 56.53 second clip into 3497 equal segments or “frames.” Each frameis approximately 0.033 seconds in length (33 thousandths <strong>of</strong> a second).3. We find two points associated with the ro<strong>of</strong> <strong>of</strong> the upper block <strong>of</strong> the North Tower whoseprogress we can measure. Two points are necessary since neither one is consistently visiblebut one <strong>of</strong> the two is always visible. <strong>The</strong> point whose fall we shall use in our computations isat the tip <strong>of</strong> a white device on the ro<strong>of</strong>. (<strong>The</strong> distance between this point and the upper frameis called Distance A in Figure 1 below.) <strong>The</strong> other point is located at the interface <strong>of</strong> theupper white section <strong>of</strong> the ro<strong>of</strong> and the lower dark section. (<strong>The</strong> distance between this pointand the upper frame is called Distance B in Figure 1.) <strong>The</strong> difference between Distance Band Distance A is approximately 28 pixels. Where the white device on the upper right-handcorner <strong>of</strong> the ro<strong>of</strong> is obscured by smoke, measurements <strong>of</strong> the ro<strong>of</strong> interface have been takenand the position <strong>of</strong> the device has been obtained by subtracting 28.4. We choose a set <strong>of</strong> frames that stretches from Frame 929, before the discernible beginning <strong>of</strong>the ro<strong>of</strong>’s fall, to the last frame in which our point can be recognized before it disappears intothe dust cloud, Frame 1024.5. We measure the number <strong>of</strong> pixels separating the white device from the fixed upper edge <strong>of</strong>the video frame, computing the position <strong>of</strong> the device when necessary by measuring theposition <strong>of</strong> the ro<strong>of</strong> interface. We take one measurement at each five frames in the progress<strong>of</strong> the Tower’s collapse, ending up with 20 points.6. Our measurement stretches from 30.93 seconds into the clip to 34.1 seconds into the clip,giving us a total interval <strong>of</strong> 3.17 seconds.7. We find that during this interval the white device on the ro<strong>of</strong> has fallen a distance representedby 130 pixels.8. In order to get an approximation <strong>of</strong> the real distances at issue; we find a known verticaldistance on the north face <strong>of</strong> the North Tower. (<strong>The</strong> Tower’s proportions have been distortedas it has been rendered into frame-by-frame format. See Appendix A for a description <strong>of</strong> ourmethod <strong>of</strong> determining the known vertical distance and the ratio <strong>of</strong> pixels to feet.) Wediscover that in our frame-by-frame version <strong>of</strong> the Sauret video 1 pixel = 0.88 feet. We nowknow that the point on the ro<strong>of</strong> has fallen approximately <strong>11</strong>4.4 feet. <strong>The</strong> figure is not precise--there are the effects <strong>of</strong> foreshortening to consider (the ro<strong>of</strong> and device are higher than thecamera and the upper block, as it moves downward, tilts away from us)--but the figures areclose enough for our purpose because we are looking for changes in acceleration over time,not exact velocity values.<strong>Journal</strong> <strong>of</strong> 9<strong>11</strong> <strong>Studies</strong> 4January 2009/Volume 24
Figure 1: Sauret Video: Representative Frame with Key Points for Measuring the Ro<strong>of</strong>’s FallDistanceBDistanceA9. We know thatd = ½ × g × t 2where d stands for distance, g stands for acceleration due to gravity, which is 32.174 ft./s 2 at sealevel, and t stands for time. Using this formula, we discover that a freely falling object wouldtravel 161.6 feet in the time it took the ro<strong>of</strong> to drop <strong>11</strong>4.4 feet.10. We create two graphs. In the first the ro<strong>of</strong>’s descent is given in pixels. In the second thero<strong>of</strong>’s fall is given in feet.<strong>Journal</strong> <strong>of</strong> 9<strong>11</strong> <strong>Studies</strong> 5January 2009/Volume 24
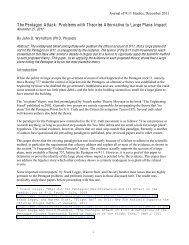
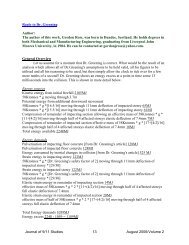
Figure 3: <strong>The</strong> Ro<strong>of</strong> Fall: DistanceRo<strong>of</strong> Fall DistanceDistance (feet)1401201008060402000 0.5 1 1.5 2 2.5 3 3.5Time (sec)Data:Time (sec.)Ro<strong>of</strong> Fall Distance (ft.)0.000 0.000.167 0.880.334 1.760.500 3.520.667 5.280.834 7.921.000 <strong>11</strong>.441.167 14.961.334 20.241.500 25.521.667 32.561.834 38.722.000 45.762.167 53.682.334 62.482.500 71.282.667 80.962.834 91.523.000 102.963.167 <strong>11</strong>4.40<strong>Journal</strong> <strong>of</strong> 9<strong>11</strong> <strong>Studies</strong> 7January 2009/Volume 24
Knowing the distance the ro<strong>of</strong> fell, in equal time intervals, from our measurements, we can nowdetermine its actual velocity, at each measured point through its fall, using symmetricdifferencing. <strong>The</strong> equation isV n = (D n+1 - D n-1 ) / (T n+1 – T n-1 )where V = velocityD = distanceT = timen = point in questionData:Time (sec) Ro<strong>of</strong> Fall Distance (ft.) Velocity (ft./sec)0.0000 0.00 0.000.1667 0.88 5.280.3334 1.76 7.920.5000 3.52 10.560.6667 5.28 13.200.8334 7.92 18.481.0000 <strong>11</strong>.44 21.121.1667 14.96 26.391.3334 20.24 31.681.5000 25.52 36.961.6667 32.56 39.591.8334 38.72 39.602.0000 45.76 44.882.1667 53.68 50.152.3334 62.48 52.812.5000 71.28 55.452.6667 80.96 60.712.8334 91.52 66.013.0000 102.96 68.65It may be noticed that the last point measured at 3.167 seconds is left <strong>of</strong>f <strong>of</strong> the data table aboveand the velocity graph below. <strong>The</strong> reason for this is that each point the velocity is found forneeds to have a point ahead <strong>of</strong> it as well as behind it, so this method cannot calculate the velocityfor the last point measured. As it is known that the measurements were taken every five frameswith a 30 frame per second video, the actual time can be resolved fairly precisely. <strong>The</strong> use <strong>of</strong>four places for time increments, <strong>of</strong> 0.1667 seconds between measurements, in the velocitycalculation above, is done for accuracy.<strong>Journal</strong> <strong>of</strong> 9<strong>11</strong> <strong>Studies</strong> 8January 2009/Volume 24
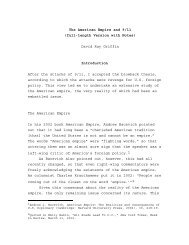
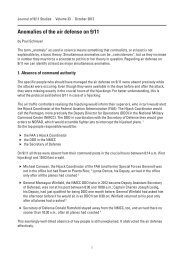
Below is a graph <strong>of</strong> the actual velocity <strong>of</strong> the ro<strong>of</strong> at each measurement point over the same timeframe in which the distance was measured.Figure 4: <strong>The</strong> Ro<strong>of</strong> Velocity807060Regression analysis (least squares curve fit)y = 22.81xR 2 = 0.9961Velocity (ft./sec)504030201000 0.5 1 1.5 2 2.5 3 3.5Time (sec)<strong>The</strong> velocity <strong>of</strong> the ro<strong>of</strong> increases in a relatively linear way and is 68.65 ft./s after 3.00 seconds,which is about 71% <strong>of</strong> the free fall velocity <strong>of</strong> 96.52 ft./s for this fall time. At the actualmeasured distances and calculated velocities, the initial fall through one story would have takenplace in approximately 1.0 second.If the upper block, RB-12+, were rigid, as Bazant and NIST claim, the powerful jolt, required byBazant to generate an impulsive load and explain the collapses <strong>of</strong> the Twin Towers, would showitself as an abrupt negative deviation in the otherwise positively sloped and virtually linearvelocity graph.For readers unfamiliar with the concept <strong>of</strong> an impulsive load, the impulse-momentum changeequation is shown below and essentially shows that the change in momentum with respect totime provides the force involved in a collision.mivi− mfvForce =ΔtfΔv= mΔt= maAs stated earlier, it is only the velocity that changes with respect to the duration <strong>of</strong> the impulse,as the mass <strong>of</strong> an object is constant at all times everywhere in the universe. A change in velocitywith respect to time is defined as either an acceleration or deceleration, depending on whether itis positive or negative. This acceleration or deceleration is then multiplied by the mass <strong>of</strong> theimpacting object and provides the force involved in the collision, so the impulse equationultimately reduces to the well known relation F = ma.<strong>Journal</strong> <strong>of</strong> 9<strong>11</strong> <strong>Studies</strong> 9January 2009/Volume 24
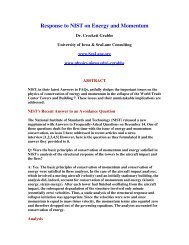
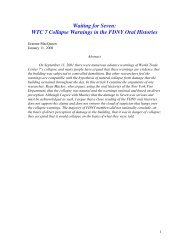
Figure 5: Ro<strong>of</strong> Velocity Curve with a hypothetical 31g decelerationVelocity (ft./sec)80706050403020100Actual measured velocityPre-impact velocity recovery700 msec31g impulse with abrupt negative slope and velocity loss0 0.5 1 1.5 2 2.5 3 3.5Time (sec)<strong>The</strong> fact that a 31g impulse requires a deceleration <strong>of</strong> 997.4 ft./s 2 is unassailable, and it does notmatter whether the collision is elastic or inelastic. With a velocity reduction <strong>of</strong> 17.38 ft./s and a997.4 ft./s 2 deceleration, the duration <strong>of</strong> this impulse would have been 17 milliseconds. Thisrapid deceleration associated with the 31g impulse would necessarily show itself as an abruptnegative slope change in the velocity curve.We have shown the curve starting upward again after the impact, on the generous assumptionthat the impacting object (the upper block) is now free to accelerate. We have also only chartedwhat the effect on the velocity would have been for an initiating impulse between the first tw<strong>of</strong>loors to collide.<strong>The</strong> measurements <strong>of</strong> the ro<strong>of</strong>’s actual fall do not show any abrupt negative change in velocity,so it appears that there was no impulse and thus no amplified load. It seems that Dr. Bazant wassimply theorizing that there had to be one to make sense <strong>of</strong> the collapse in a natural way. It isalso important to note here that Dr. Bazant was <strong>of</strong>f by a factor <strong>of</strong> ten in his calculation <strong>of</strong> thestiffness <strong>of</strong> the columns, with his 71 GN/m estimate. [8] <strong>The</strong> actual stiffness, calculated hereusing the actual column cross sections, is approximately 7.1 GN/m. (see Appendices B and C)[19][20] This error caused Dr. Bazant to significantly overestimate the potential amplifyingeffect <strong>of</strong> the impulse or jolt, which he claims occurred after a one story fall <strong>of</strong> the upper block.In an effort to refute the argument put forth in this paper, some may claim that plasticdeformation <strong>of</strong> the lower stories <strong>of</strong> the upper block could have created a crush wave below theupper block and kept the ro<strong>of</strong> from experiencing a discernable impulse. If that were true then theimpulse durations would have increased dramatically, absorbing the energy over a longer period<strong>of</strong> time and eliminating any significant amplification <strong>of</strong> the upper block’s weight. But withoutthe amplification <strong>of</strong> the upper block’s weight why would the lower block have collapsed?<strong>The</strong>re are those who might argue that the tilt <strong>of</strong> the upper block to the south could have kept an<strong>Journal</strong> <strong>of</strong> 9<strong>11</strong> <strong>Studies</strong> <strong>11</strong>January 2009/Volume 24
impulse from being discernable—that there may have been impulses on the south face or furtherinside the Tower, in the central core, that were not visible on the north face. Impulses at theselocations could not have caused the collapse <strong>of</strong> the north face <strong>of</strong> the Tower and its cornercolumns in the observed vertical manner. <strong>The</strong> corner columns <strong>of</strong> the east and west faces, inconjunction with the columns <strong>of</strong> the north face, formed a structural channel (a stiff structuralelement with support in two orthogonal directions) and, barring planned demolition, would havecollapsed as observed only if they were struck impulsively, in a vertical manner by the upperblock.In reality, the upper block could not have tolerated the potential 31g impulse theorized byDr. Bazant. To get this overload he claims was possible, all <strong>of</strong> the mass <strong>of</strong> the upper block wouldhave had to participate, and if it did so it would have come apart completely.Perhaps the impulse was <strong>of</strong> a lower value but still high enough to cause an overload <strong>of</strong> the lowerstructure and bring about global collapse? Consider a velocity graph with a 6g deceleration, verylikely the minimum load amplification necessary to overcome the reserve capacity <strong>of</strong> theperimeter columns, which had a minimum factor <strong>of</strong> safety <strong>of</strong> 5.00 to 1.Figure 6: Ro<strong>of</strong> Velocity Curve with a hypothetical 6g decelerationVelocity (ft./sec)80706050403020100Actual measured velocityPre-impact velocity recovery800 msec6g impulse with abrupt negative slope and velocity loss0 0.5 1 1.5 2 2.5 3 3.5Time (sec)A 6g impulse requires a deceleration <strong>of</strong> 193 ft./s 2 . With a velocity reduction <strong>of</strong> 17.38 ft./s and a193 ft./s 2 deceleration, the duration <strong>of</strong> this impulse would have been 90 milliseconds. As thegraph shows, there would still be a quite obvious abrupt negative slope change, which is not seenin the velocity curve determined from the measured data.<strong>The</strong> measurements were taken every five frames, or 167 milliseconds apart. <strong>The</strong> recovery to thepre-impact velocity is shown to occur in the dashed graphs in the approximate times <strong>of</strong> 700milliseconds for the 31g case and 800 milliseconds for the 6g case. In both cases there are fourdata points taken well within this recovery window, so it is apparent that a negative change in thevelocity <strong>of</strong> the ro<strong>of</strong> would have been captured if an impulse had indeed occurred.<strong>Journal</strong> <strong>of</strong> 9<strong>11</strong> <strong>Studies</strong> 12January 2009/Volume 24
Findings:As the figures and graphs above clearly show, any impulsive load would have required a highdeceleration, which would have shown itself very prominently in the velocity curve derived fromthe measured data. <strong>The</strong> fact that no such negative change exists in the ro<strong>of</strong>’s actual velocitycurve reveals that no major interruption or significant abrupt deceleration, and therefore noamplified load, could have occurred during the fall <strong>of</strong> the upper block. How can this be? If RB-12+ fell with a jolt on the rest <strong>of</strong> the building after a 12 foot drop (one story), the deceleration, asshown above, would have revealed itself clearly, and if RB-12+ fell more than one story, thedeceleration would have been even more dramatic. If RB-12+ fell 72 feet—all the way throughthe six damaged stories—we would see powerful evidence <strong>of</strong> a jolt during the measured <strong>11</strong>4.4foot fall <strong>of</strong> the ro<strong>of</strong>. It would be dramatic precisely because the velocity and therefore themomentum would be high, and any change more discernable. But there is no evidence <strong>of</strong> majorimpact and deceleration either early or late.In the main, these findings confirm the earlier research <strong>of</strong> Dr. Frank Legge. [18] In 2006 Legge,using a different video clip and measurement technique, carried out detailed measurements <strong>of</strong> thefall <strong>of</strong> the ro<strong>of</strong> <strong>of</strong> the North Tower and calculated its acceleration rate. Although his purposeswere different from ours, he discovered similarly smooth curves. <strong>The</strong>re is no more trace <strong>of</strong>deceleration in his graphs than in ours.What happened to RB-12+ during its fall? It would appear, based on the Sauret video and othervideo recordings <strong>of</strong> the event, that a substantial portion <strong>of</strong> the bottom <strong>of</strong> RB-12+, along with DS-6, was violently destroyed amidst clouds <strong>of</strong> ejected matter at the same time the top portion <strong>of</strong>RB-12+, containing the ro<strong>of</strong>top, was falling. Since the clouds <strong>of</strong> matter in the videos obscuremany details <strong>of</strong> the event, it is easy to see why someone might try to make the case that the fall<strong>of</strong> the upper portion <strong>of</strong> the rigid block was accompanied by a fall <strong>of</strong> its lower portion. But we donot see a fall <strong>of</strong> its lower portion: we simply see violent destruction in the vicinity <strong>of</strong> the lowerportion and fall <strong>of</strong> the upper portion.To repeat: if RB-12+ had fallen as a rigid block, there would be impact, and the impact wouldhave caused abrupt interference with the fall <strong>of</strong> its upper part, including the ro<strong>of</strong>. No suchinterruption has occurred, and therefore no such impact has taken place. Evidently, the violentdestruction that occurred--presumably through planted explosives or other means <strong>of</strong> demolition--effectively destroyed the structural integrity <strong>of</strong> the lower part <strong>of</strong> the upper block as well as DS-6,permitting the upper block to fall at speed while meeting minimal resistance and experiencingneither major impact nor abrupt deceleration.Conclusions:We have tracked the fall <strong>of</strong> the ro<strong>of</strong> <strong>of</strong> the North Tower through <strong>11</strong>4.4 feet, (approximately 9stories) and we have found that it did not suffer severe and sudden impact or abruptdeceleration. <strong>The</strong>re was no jolt. Thus there could not have been any amplified load. In theabsence <strong>of</strong> an amplified load there is no mechanism to explain the collapse <strong>of</strong> the lower portion<strong>of</strong> the building, which was undamaged by fire. <strong>The</strong> collapse hypothesis <strong>of</strong> Bazant and the authors<strong>of</strong> the NIST report has not withstood scrutiny.<strong>Journal</strong> <strong>of</strong> 9<strong>11</strong> <strong>Studies</strong> 13January 2009/Volume 24
NOTESThanks are <strong>of</strong>fered to members <strong>of</strong> the discussion forum <strong>of</strong> Scholars for 9/<strong>11</strong> Truth & Justice,especially to Alfons, who initiated the discussion and provided a number <strong>of</strong> interesting ideas.Thanks are also due to Zoran Bilanovic for a critical reading <strong>of</strong> the paper and to Paul Bouvet forearly s<strong>of</strong>tware advice. Crucial s<strong>of</strong>tware assistance was obtained from Joe Terrien, who gavefreely <strong>of</strong> his time and expertise. We are enormously grateful to Civil Engineering Pr<strong>of</strong>essorRobert Korol for help with the calculations in the appendices. All measurements, calculations,and conclusions are the sole responsibility <strong>of</strong> the authors.1. NIST NCSTAR 1. Federal Building and Fire Safety Investigation <strong>of</strong> the World Trade CenterDisaster. Final Report on the Collapse <strong>of</strong> the World Trade Center Towers. National Institute <strong>of</strong>Standards and Technology, U.S. Department <strong>of</strong> Commerce, September 2005.http://wtc.nist.gov/NISTNCSTAR1Collapse<strong>of</strong>Towers.pdf2. <strong>The</strong>re is some ambiguity in the NIST study on which stories are included in the upper rigidblock, but the analysis given in this paper appears to represent NIST’s best estimate. See, e.g.,NIST NCSTAR 1, p. 150-151.3. NIST NCSTAR 1, p. 151.4. NIST NCSTAR 1, p. 151.5. NIST NCSTAR 1, p. xxxviii.6. NIST NCSTAR 1, p.151.7. NIST NCSTAR 1, 145 (“the falling building section”); 146 (“the falling building mass,” “thefalling mass”). See also the companion volume: NIST NCSTAR 1-6. Federal Building and FireSafety Investigation <strong>of</strong> the World Trade Center Disaster. Structural Fire Response and ProbableCollapse Sequence <strong>of</strong> the World Trade Center Towers. National Institute <strong>of</strong> Standards andTechnology, U.S. Department <strong>of</strong> Commerce, September 2005, p. liv (“the building section beganto fall downward”) and p. 156 (“the building section began to fall vertically”).http://wtc.nist.gov/oct05NCSTAR1-6index.htm8. Bazant, Zdenek and Yong Zhou, “Why Did the World Trade Center Collapse?—SimpleAnalysis”. <strong>Journal</strong> <strong>of</strong> Engineering Mechanics, vol. 128, no. 1 (Jan. 2002), p. 2-6 See also theAddendum to this article in the same journal, vol. 128, no. 3 (March 2002), p. 369-370.http://www.civil.northwestern.edu/people/bazant/PDFs/Papers/405.pdfNote: when we refer in the article to Bazant, we include his co-authors.For NIST’s reference to the Bazant paper, see NIST NCSTAR 1-6, p. 323.<strong>Journal</strong> <strong>of</strong> 9<strong>11</strong> <strong>Studies</strong> 14January 2009/Volume 24
9. Bazant, Zdenek and Jie-Liang Le, Frank Greening, David Benson, “Collapse <strong>of</strong> the WorldTrade Center Towers: What Did and Did Not Cause It?” Structural Engineering Report No. 07-05/C605c. Department <strong>of</strong> Civil and Environmental Engineering, Northwestern University. May27, 2007. Revised December 15, 2007. p. <strong>11</strong>.http://www.civil.northwestern.edu/people/bazant/PDFs/Papers/00%20WTC%20Collapse%20-%20What%20did%20%26%20Did%20Not%20Cause%20It%20-%20Revised%206-22-07.pdfJim H<strong>of</strong>fman challenged Bazant’s claim some time ago in his article “Seismic Records <strong>of</strong> theTwin Towers’ Destruction: Clarifying the Relationship Between Seismic Evidence andControlled Demolition <strong>The</strong>ories.” Version 0.9, Oct. 31, 2006.http://9<strong>11</strong>research.wtc7.net/essays/demolition/seismic.html#evidence_<strong>of</strong>10. Addendum, Bazant and Zhou, 2002, p. 369.<strong>11</strong>. See Gregory Urich, “Analysis <strong>of</strong> the Mass and Potential Energy <strong>of</strong> World Trade CenterTower 1.” <strong>Journal</strong> <strong>of</strong> 9/<strong>11</strong> <strong>Studies</strong>, vol. 18 (Dec. 2007).http://www.journal<strong>of</strong>9<strong>11</strong>studies.com/See also NIST NCSTAR 1-1. Federal Building and Fire Safety Investigation <strong>of</strong> the World TradeCenter Disaster. Design, Construction, and Maintenance <strong>of</strong> Structural and Life Safety Systems.National Institute <strong>of</strong> Standards and Technology, U.S. Department <strong>of</strong> Commerce, September2005.http://wtc.nist.gov/oct05NCSTAR1-1index.htm12. Bazant and Zhou, 2002; Bazant et al, 2007.13. Bazant et al, 2007, p. 1.14. <strong>The</strong> following four points commit NIST to impact and jolt:(a) NIST speaks <strong>of</strong> the core <strong>of</strong> the building as consisting <strong>of</strong> three sections, which correspondclosely to the sections we have spoken <strong>of</strong> when discussing the building as a whole:“At this point, the core <strong>of</strong> WTC 1 could be imagined to be in three sections. <strong>The</strong>re was a bottomsection below the impact floors that could be thought <strong>of</strong> as a strong, rigid box, structurallyundamaged and at almost normal temperatures. <strong>The</strong>re was a top section above the impact andfire floors that was also a heavy, rigid box. In the middle was the third section, partially damagedby the aircraft and weakened by heat from the fires.” (NIST NCSTAR 1, p. 79)(b) <strong>The</strong> section <strong>of</strong> the building above the damage zone NIST calls a “rigid block.” This rigidblock first manifests its independent movement when it tilts to the south. (“<strong>The</strong> section <strong>of</strong> thebuilding above the impact zone (near the 98 th floor), acting as a rigid block, tilted…” NISTNCSTAR 1, p. 201.) NIST also refers to this rigid block with terms such as “upper section,”“building section above the impact zone,” “building mass,” “upper building section” and“structural block.” See NIST NCSTAR 1, pp. 83, 195, 196, 201<strong>Journal</strong> <strong>of</strong> 9<strong>11</strong> <strong>Studies</strong> 15January 2009/Volume 24
(c) NIST acknowledges that this rigid block then falls. NIST says that “the building sectionbegan to fall downward,” “the building section began to fall vertically.” Indeed, we are told thatthis falling rigid block goes through all or part <strong>of</strong> the damaged area “essentially in free fall.”(“Since the stories below the level <strong>of</strong> collapse initiation provided little resistance to thetremendous energy released by the falling building mass, the building section above came downessentially in free fall, as seen in videos.”) See NIST NCSTAR 1-6, pp. 416, 238; NISTNCSTAR 1, p. 196.(d) After falling through all or part <strong>of</strong> the damaged area <strong>of</strong> the tower, the rigid block or fallingbuilding mass encounters “intact structure.” (“<strong>The</strong> potential energy released by the downwardmovement <strong>of</strong> the large building mass far exceeded the capacity <strong>of</strong> the intact structure below toabsorb that through energy <strong>of</strong> deformation.”) See NIST NCSTAR 1, p. 196. This “intactstructure,” has, <strong>of</strong> course, already been referred to as including the core <strong>of</strong> the building,described as “a strong, rigid box, structurally undamaged and at almost normal temperatures.”15. A version <strong>of</strong> the Sauret video clip can be found at:http://www.youtube.com:80/watch?v=xGA<strong>of</strong>wkAOloFor our purposes we have used the footage from Etienne Sauret’s film, “WTC: the first 24hours.”16. Readers wanting to get a rough approximation <strong>of</strong> the measurements in this paper withoutexpense may acquire from the internet the s<strong>of</strong>tware, Vdownloader:http://www.s<strong>of</strong>tpedia.com/progDownload/VDownloader-Download-51327.htmlOnce the on-line version <strong>of</strong> the Sauret video clip (see note 15) is downloaded it can be brokeninto 0.033 second frames using VirtualDub:http://www.virtualdub.org/A pixel measurement device (several are available free or for a minimal charge on the Internet)can be used for measurements.For our paper we found we were able to get more accurate measurements by ripping the Sauretvideo (from the DVD) using DVD Decrypter. <strong>The</strong>n the raw video files were converted to mpeg2using Xilis<strong>of</strong>t Video Converter 3.<strong>The</strong> converted files were then imported into Adobe PremierePro CS3. <strong>The</strong> timestamp was added and the entire segment was exported as a still framesequence in .gif format.For pixel measurements, we used Screen Calipers:http://iconico.com/caliper/17. Bazant and Zhou, 2002, p. 3.18. Frank Legge, “9/<strong>11</strong>-Evidence for Controlled Demolition: a Short List <strong>of</strong> Observations.”<strong>Journal</strong> <strong>of</strong> 9/<strong>11</strong> <strong>Studies</strong>, vol.1 (June 2006).http://www.journal<strong>of</strong>9<strong>11</strong>studies.com/articles/<strong>Journal</strong>_2_Evidence_for_demolition_20.pdf<strong>Journal</strong> <strong>of</strong> 9<strong>11</strong> <strong>Studies</strong> 16January 2009/Volume 24
19. <strong>The</strong> cross sectional areas <strong>of</strong> the central core columns on each story were released by NIST in2007 and are publicly available. This information can be found athttp://wtcmodel.wikidot.com/nist-core-column-data20. <strong>The</strong> exterior column cross sectional area for each story was determined using the WTC1mass analysis cited in reference [<strong>11</strong>], which gives the total mass <strong>of</strong> the columns on each story.Knowing the length <strong>of</strong> the columns and the density <strong>of</strong> steel, the area could be determined.21. See Section 2.6 on pages 5 through 7 <strong>of</strong> the below link for an explanation <strong>of</strong> column crosssection classifications for resistance to local buckling.http://www.nottingham.ac.uk/civeng/H23S07/Design%20<strong>of</strong>%20SHS.pdf* This paper has been revised to use symmetric differencing to calculate instantaneous velocity. <strong>The</strong> initial methodused the equations <strong>of</strong> motion to calculate velocity, which are only valid with constant acceleration, causingsmoothing <strong>of</strong> the data and inflation <strong>of</strong> the pre-impact velocity. Since the energy requirements do not change, theactual lower pre-impact velocity results in a larger percentage <strong>of</strong> kinetic energy drained at impact with acorrespondingly more dramatic change in velocity.An arithmetic error in the velocity reduction calculation on page 26 was also corrected.AUTHORSGraeme MacQueen received his Ph.D. in Asian religion and literature from Harvard University.Now retired, he taught at McMaster University in Canada for almost thirty years. He wasfounding Director <strong>of</strong> McMaster’s Centre for Peace <strong>Studies</strong> and directed peace-building projectsin several war zones, including Sri Lanka and Afghanistan. He is a member <strong>of</strong> Scholars for 9/<strong>11</strong>Truth & Justice.Tony Szamboti received his Bachelor’s degree in Mechanical Engineering from VillanovaUniversity. Prior to that he worked as a machinist and tool engineer in industry, and as an aircraftmechanic in the U.S. Navy. Since 1990 he has worked as a design engineer in industry,performing structural and thermal design, analysis, and testing to ensure survivability <strong>of</strong> antennasand equipment for use on ships, aircraft, spacecraft, and communication towers. He is a member<strong>of</strong> Scholars for 9/<strong>11</strong> Truth & Justice and Architects & Engineers for 9/<strong>11</strong> Truth.<strong>Journal</strong> <strong>of</strong> 9<strong>11</strong> <strong>Studies</strong> 17January 2009/Volume 24
APPENDIX ADETERMINING THE PIXEL-FOOT RATIO FOR THE SAURET VIDEO1. In order to correct any possible vertical distortion <strong>of</strong> the image <strong>of</strong> the North Tower that mightaffect our measurements (such distortions are common), we decided to find a vertical distance onthe north face <strong>of</strong> the Tower that can be measured accurately in pixels. We took a measurementfrom a horizontal line <strong>of</strong> damage caused by the plane to a line on the ro<strong>of</strong> <strong>of</strong> the NT, where theupper white part <strong>of</strong> the ro<strong>of</strong> meets a darker, lower part <strong>of</strong> the building.2. We then chose five excellent still photos <strong>of</strong> the North Tower. <strong>The</strong> perspective from which theywere taken seemed unlikely to create severe foreshortening effects. <strong>The</strong>se photographs are fromthe NIST report (NIST NCSTAR 1.5A, Chapter 8), and are grouped conveniently on the forensicwebsite “WTC Demolition Analysis” found at:http://www.sharpprintinginc.com/9<strong>11</strong>/index.php?module=photoalbum&PHPWS_Album_id=20&PHPWS_Photo_op=view&PHPWS_Photo_id=909<strong>The</strong> photographs were taken at different times and by several different photographers, and theyare reproduced below with added red arrows showing the two distances measured.Our aim was to measure, in pixels, the horizontal distance x and then the vertical distance y sothat we could work out the ratio <strong>of</strong> x to y. If consistency could be found, we could be confidentthat we had the correct ratio. <strong>The</strong>n, knowing the value <strong>of</strong> x (the width <strong>of</strong> the tower) in feet, wecould determine the value, in feet, <strong>of</strong> y.3. Here are the measurements made for the original five photos, marked A, B, C, D, and E. (Notethat the measurements will be different on the photos as reproduced below, but the proportionswill remain constant.)Photo x y x:y ratioA 231 pixels 2<strong>11</strong> pixels 1: .91B 373 pixels 340 pixels 1: .91C 379 pixels 354 pixels 1: .93D 373 pixels 343 pixels 1: .92E 327 pixels 302 pixels 1: .924. <strong>The</strong>re is little variation in the figures found for the ratio <strong>of</strong> x: y. <strong>The</strong> average is 1:92, whichcorresponds to the ratio in what is arguably the photograph with the least apparent distortionfrom foreshortening, photo D,5. Various figures, from 207 to 210 feet, have been suggested for the external width <strong>of</strong> theTowers. We chose 210 feet as our best estimate. <strong>The</strong> figure is from NIST NCSTAR 1, p. 5. Seealso Gregory Urich, “Analysis <strong>of</strong> the Mass and Potential Energy <strong>of</strong> World Trade Center Tower1” (<strong>Journal</strong> <strong>of</strong> 9/<strong>11</strong> <strong>Studies</strong>), p. 8. Bear in mind that the perimeter columns were covered ininsulation and aluminum cladding, which added to their external dimensions.<strong>Journal</strong> <strong>of</strong> 9<strong>11</strong> <strong>Studies</strong> 18January 2009/Volume 24
6. This means that the value <strong>of</strong> the vertical distance measured (y) is 210 x .92 = 193.2 feet.7. Measuring y in our frame-by-frame version <strong>of</strong> the Sauret video we found it to be 220 pixels.<strong>The</strong> ratio <strong>of</strong> pixels to feet for vertical measurements in this version <strong>of</strong> the Sauret video is: 1 pixel= 0.88 feet.A<strong>Journal</strong> <strong>of</strong> 9<strong>11</strong> <strong>Studies</strong> 19January 2009/Volume 24
BC<strong>Journal</strong> <strong>of</strong> 9<strong>11</strong> <strong>Studies</strong> 20January 2009/Volume 24
DE<strong>Journal</strong> <strong>of</strong> 9<strong>11</strong> <strong>Studies</strong> 21January 2009/Volume 24
APPENDIX BCORE AND PERIMETER COLUMN CROSS SECTIONS ON THE 97 TH STORYCORE COLUMNS97 TH story Yield Flange Flange Web Web Cross sectionalstrength width thickness height thickness areaColumn No. Designation (ksi) (in.) (in.) (in.) (in.) (in. 2 )501 14WF426F42 42 16.695 3.033 12.624 1.875 124.942502 14WF264F42 42 16.025 1.938 12.624 1.205 77.325503 14WF264F42 42 16.025 1.938 12.624 1.205 77.325504 14WF246F36 36 16.945 1.813 12.624 1.125 75.645505 14WF219F36 36 15.825 1.623 12.624 1.005 64.055506 14WF287F42 42 16.13 2.093 12.624 1.31 84.058507 14WF264F42 42 16.025 1.938 12.624 1.205 77.325508 14WF426F42 42 16.695 3.033 12.624 1.875 124.942601 12WF106F42 42 12.23 0.986 10.908 0.62 30.881602 14WF150F36 36 15.515 1.128 12.624 0.695 43.776603 14WF158F36 36 15.55 1.188 12.624 0.73 46.162604 12WF106F36 36 12.23 0.986 10.908 0.62 30.881605 12WF120F36 36 12.32 1.108 10.908 0.71 35.046606 14WF150F36 36 15.515 1.128 12.624 0.695 43.776607 14WF142F36 36 15.5 1.063 12.624 0.68 41.537608 12WF106F36 36 12.23 0.986 10.908 0.62 30.881701 12WF161F42 42 12.515 1.486 10.908 0.905 47.066702 14WF176F36 36 15.64 1.313 12.624 0.82 51.422703 14WF103F36 36 14.575 0.813 12.624 0.495 29.948704 14WF53F50 50 8.062 0.658 12.624 0.37 15.280705 14WF43F45 45 8 0.528 12.624 0.308 12.336706 14WF<strong>11</strong>1F36 36 14.62 0.873 12.624 0.54 32.343707 14WF167F36 36 15.6 1.248 12.624 0.78 48.784708 12WF161F42 42 12.515 1.486 10.908 0.905 47.066801 12WF161F42 42 12.515 1.486 10.908 0.905 47.066802 14WF176F36 36 15.64 1.313 12.624 0.82 51.422803 12WF133F42 42 12.365 1.238 10.908 0.756 38.862804 12WF79F36 36 12.08 0.736 10.908 0.47 22.909805 14WF<strong>11</strong>1F42 42 14.62 0.873 12.624 0.54 32.343806 14WF167F36 36 15.6 1.248 12.624 0.78 48.784807 14WF167F42 42 15.6 1.248 12.624 0.78 48.784<strong>Journal</strong> <strong>of</strong> 9<strong>11</strong> <strong>Studies</strong> 22January 2009/Volume 24
901 12WF120F36 36 12.32 1.108 10.908 0.71 35.046902 14WF150F36 36 15.515 1.128 12.624 0.695 43.776903 14WF193F36 36 15.71 1.438 12.624 0.89 56.417904 12WF92F36 36 12.155 0.856 10.908 0.645 27.845905 12WF99F36 36 12.19 0.921 10.908 0.56 28.562906 14WF142F36 36 15.5 1.063 12.624 0.68 41.537907 14WF150F36 36 15.515 1.128 12.624 0.695 43.776908 12WF120F36 36 12.32 1.108 10.908 0.71 35.0461001 14WF426F42 42 16.695 3.033 12.624 1.875 124.9421002 14WF264F42 42 16.025 1.938 12.624 1.205 77.3251003 14WF342F36 36 16.365 2.468 12.624 1.545 100.2821004 14WF219F36 36 15.825 1.623 12.624 1.005 64.0551005 14WF202F36 36 15.75 1.503 12.624 0.93 59.0851006 14WF314F42 42 16.235 2.283 12.624 1.415 91.9921007 14WF287F36 36 16.13 2.093 12.624 1.31 84.0581008 14WF426F42 42 16.695 3.033 12.624 1.875 124.942Total area (in. 2 ) = 2,621.657PERIMETER COLUMNS<strong>The</strong> perimeter columns were uniform in cross section on a given floor. While their exact crosssections have not been made publicly available they are discernable due to their height, number,material density, and total weight per floor being known. <strong>The</strong> NIST NCSTAR 1-3D report statesthat “As the elevation in the building increased, the thickness <strong>of</strong> the plates in the columnsdecreased, but the plates were always at least 0.25 thick”.<strong>The</strong> height <strong>of</strong> a floor <strong>of</strong> perimeter columns in WTC 1 can be calculated by dividing the buildingheight <strong>of</strong> 1,368 feet by <strong>11</strong>0 stories to get a height <strong>of</strong> 12.44 feet or 149.24 inches per story.<strong>The</strong> weight <strong>of</strong> the 236 perimeter columns at the 97 th story was approximately 78.71 tons or157,420 lbs..Dividing the weight by the 0.283 lbs./in. 3 density <strong>of</strong> steel and the number <strong>of</strong> columns gives avolume for each column <strong>of</strong> 2,357 in. 3 .Dividing this volume by the 149.24 inch height <strong>of</strong> each floor gives a cross sectional area for eachcolumn <strong>of</strong> 15.79 in. 2 .With 236 columns this gives a total cross sectional area for the perimeter columns at the 97 thstory <strong>of</strong> 3,726 in. 3 .As the perimeter columns can be approximated as 14 inch square columns, the wall thickness canbe estimated. For the 97 th story it would be approximately 0.289 inches. This comports well withthe NIST statement that the plate thickness was never less than 0.25 inches thick, and since the97 th story was 13 floors down from the top <strong>of</strong> the building it appears reasonable.<strong>Journal</strong> <strong>of</strong> 9<strong>11</strong> <strong>Studies</strong> 23January 2009/Volume 24
APPENDIX CCALCULATION OF THE AXIAL STIFFNESS OF THE COLUMNS FROM THE 97 THSTORY DOWN TO GROUND LEVEL IN THE TOWERS<strong>The</strong> axial stiffness <strong>of</strong> a structural column can be determined knowing the modulus <strong>of</strong> elasticity <strong>of</strong>its material, the cross sectional area, and the length <strong>of</strong> the column, with the equation K = AE/L.<strong>The</strong> problem for determining this for the tower columns below the 97 th story is that the crosssectional areas change with elevation. One way to estimate the cross section is to use a median,which we will do here using the cross sectional area <strong>of</strong> the columns at the 55 th story since it is themidpoint in the tower above ground level.<strong>The</strong> core column cross sectional area at the 55 th story was 8,777 in. 2 and the perimeter columncross sectional area 10,784 in. 2 giving a total column cross sectional area <strong>of</strong> 19,561 in. 2 at the55 th floor.Steel was used for all <strong>of</strong> the columns and the modulus <strong>of</strong> elasticity <strong>of</strong> steel is 30 x 10 6 psi.<strong>The</strong> length <strong>of</strong> the columns from the 97 th story down to ground level was 149.24 inches per storymultiplied by 97 stories, giving a length <strong>of</strong> 14,476 inches.Using K = AE/L = (19,561 in. 2 )(30 x 10 6 psi)/14,476 inches, the stiffness is found to be40,538,132 lb./in. or 7.1 GN/m.While one could make the case that the stiffness used should have been that from the 97 th storydown to the foundation, and considering the six sub-levels, the stiffness in that case would benearly the same. <strong>The</strong> median floor in that case would be the 52 nd story and the columns on thatfloor were only slightly larger in cross section than those on the 55 th , which would be <strong>of</strong>fset inthe calculation by the additional length <strong>of</strong> the six sub-level floors.<strong>Journal</strong> <strong>of</strong> 9<strong>11</strong> <strong>Studies</strong> 24January 2009/Volume 24
APPENDIX DCALCULATION OF VELOCITY CHANGES DUE TO ENERGY DRAINS DURING THECOLLISION OF THE UPPER AND LOWER BLOCKSIt is assumed that there are 3 parts to the energy dissipation from the collision for a given story.<strong>The</strong>se are:1) Uniform elastic spring action compression in the core and perimeter columns.2) Compressive plastic yielding <strong>of</strong> core and perimeter columns in columns <strong>of</strong> the 97 th and99 th stories.3) Plastic hinging action (buckling) <strong>of</strong> all columns, in the two stories.1) Calculations show that an average spring constant for the tower columns is 40,500 kips/in or7.1 GN/m, i.e. if the columns were <strong>of</strong> uniform cross section over the <strong>11</strong>0 stories <strong>of</strong> thebuilding, and using values found at mid-height for the 55 th story. If the cross sections wereuniform the tops <strong>of</strong> the columns <strong>of</strong> the 97 th story would axially compress elastically 19.84 in.However, the column sections are not uniform, since the cross sections get smaller withincreasing height, as one would expect with decreasing load. Thus the 97 stories <strong>of</strong> columnscan only be shown to compress elastically the amount consistent with the least crosssectional area, i.e. those <strong>of</strong> the 97 th story. To calculate the maximum resistance <strong>of</strong>fered by thecore and perimeter columns in the 97 th story we need to take into account the fact that somecolumns are very stocky while some have thin elements that will buckle locally before theyyield. All 47 core columns plus 236 perimeter columns are categorized into classes 1, 2, 3and 4 (with 4 being the thinnest-walled and 1 being the sturdiest), where class 4 columns donot reach yield before local buckling occurs. [21] Approximately half <strong>of</strong> the core columnswere 36 ksi yield strength with the remaining half at 42 ksi or above, resulting in an averageyield strength <strong>of</strong> approximately 40 ksi. 14 <strong>of</strong> the core columns are class 4 and weconservatively use 50% yield resistance before buckling for these columns. With theremaining 33 columns being given 40 ksi credit, we get a total core column load resistance <strong>of</strong>94,900 kips. <strong>The</strong> 236 perimeter columns at the 97 th story are considered class 4, but all havea yield strength <strong>of</strong> 65 ksi. Using the 1/2 factor and multiplying by the total area <strong>of</strong> perimetercolumns we get 121,600 kips. <strong>The</strong> total sustainable load, before plastic deformation occurs,for the 97 th story columns = 216,500 kips. As expected, the columns <strong>of</strong> the 55 th story have asignificantly larger overall cross section and their sustainable load, before plasticdeformation occurs, is 821,600 kips. <strong>The</strong> elastic displacement <strong>of</strong> the tops <strong>of</strong> the 97 th storycolumns can then be found using the ratio <strong>of</strong> (216.5/821.6) times 19.84 inches = 5.22 inches.Using the equation E = ½Kx 2 , the elastic energy absorbed by axial deformation <strong>of</strong> thecolumns can be calculated using the figures above as ½ (40,500 kips/in.)(5.22 in.) 2 =552,000 in-k. (Note: in-k is an accepted abbreviation for in-kip).2) <strong>The</strong> 216,500 kip elastic strain limit value, that was used to calculate the elastic axial strainenergy above, is also used to calculate the plastic axial strain energy. When the columns as agroup reach their elastic limit, many will be able to sustain the value <strong>of</strong> A x Fy, i.e. crosssectional area times the yield stress. <strong>The</strong> thinner walled columns will not. A 3% axial strainlimit is commonly assumed for class 1 sections, and lesser proportional amounts for classes2, 3 and 4. Taking an average between 3 and zero (zero for class 4 since they will bucklelocally before reaching yield), we get 1.5% strain. <strong>The</strong> shortening <strong>of</strong> a column in a given<strong>Journal</strong> <strong>of</strong> 9<strong>11</strong> <strong>Studies</strong> 25January 2009/Volume 24
story will thus be the height <strong>of</strong> the column <strong>of</strong> 149 inches times 0.015 = 2.24 inches. Itfollows that the axial plastic energy is 216,500 kips x 2.24 inches = 485,000 in-k.3) After the 2.24 inch plastic strain occurs, rather than continuing to squash like a pancake, thecolumns will deform by forming plastic hinges at the top, bottom and at mid-height withinthe story and then buckle. <strong>The</strong> energy dissipation here is calculated in the same manner usedin the Bazant model, in which the total rotations summed at the three locations = 2 pi. <strong>The</strong>rewill be fully plastic moments for the stockier sections that can maintain M p for severaldegrees <strong>of</strong> rotation before the bending capacity diminishes. For the less stocky columns(classes 2 and 3) M p is initially reached and then degradation sets in. For the class 4 thinwalledcolumns, M p is never reached, but a value <strong>of</strong> 0.5 M p is likely. Finally, a scissors shapewill occur in all columns <strong>of</strong> the 97 th story with the 98 th floor squashing the space between itand the 97 th floor slab with a corresponding energy drain <strong>of</strong> 2,103,000 in-k.Adding these up, a total energy drain <strong>of</strong> 552,000 + 485,000 + 2,103,000 = 3,140,000 in-k isrealized. However, this is only a part <strong>of</strong> the energy drain that needs to be considered. Since thelower columns <strong>of</strong> the upper block would be subject to equal but opposite forces, these columnswould also be expected to suffer axial elastic and plastic deformation and buckling. <strong>The</strong> forcesapplied to the upper block will, in fact, be exerted on the columns <strong>of</strong> the 99 th story, at the bottom<strong>of</strong> the upper block. With the forces being equal and opposite, the total damage to the structure <strong>of</strong>the upper block, if calculated, would show an equivalent total energy drain to that occurring inthe structure <strong>of</strong> the lower block. However, here we are only quantifying the energy required todeform and buckle the columns on the 99 th story, as we did for only the columns on the 97 th story<strong>of</strong> the lower block. Since the 99 th story columns had 93% <strong>of</strong> the size <strong>of</strong> the columns on the 97 thstory, they result in 93% <strong>of</strong> the energy drain found for the columns on the 97 th story, with thedifference being accounted for by stress wave propagation to points further up in the upper blockstructure.<strong>The</strong> total amount <strong>of</strong> energy dissipation for the columns on both the 97 th and 99 th stories is thus1.93 times that for the 97 th story and it calculates as 1.93 x 3,140,000 in-k = 6,060,000 in-k.As shown earlier, the weight <strong>of</strong> the upper 12 stories plus the ro<strong>of</strong> had a value <strong>of</strong> 69,303 kips andthe velocity determined by the regression analysis, at 1 second into the collapse and just prior toimpact, is V 1 = 22.81 ft./s. <strong>The</strong> kinetic energy <strong>of</strong> the upper 12 stories plus the ro<strong>of</strong>, dropping aheight <strong>of</strong> <strong>11</strong>.44 feet to the 98 th floor slab below, can be found using the equation ½MV 1 2 , whilealso dividing the weight by the acceleration due to gravity to get mass. A value <strong>of</strong> 6,725,860 in-kis found for the kinetic energy <strong>of</strong> the upper block, at the time <strong>of</strong> impact <strong>of</strong> the 99 th and 98 th storyfloor slabs. <strong>The</strong> after impact velocity V 2 can be found by subtracting the dissipated energy fromthe kinetic energy just prior to impact and solving the equation below for velocity.6,725,860 in-k - 6,060,000 in-k = ½MV 22<strong>The</strong> value <strong>of</strong> V 2 is 7.18 ft./s, reflecting a velocity reduction <strong>of</strong> 15.63 ft./s due to the threecalculated energy drains <strong>of</strong> axial elastic deformation, axial plastic deformation, and plastic hingebuckling <strong>of</strong> the columns on the 97 th and 99 th stories.<strong>Journal</strong> <strong>of</strong> 9<strong>11</strong> <strong>Studies</strong> 26January 2009/Volume 24
APPENDIX ECALCULATION OF VELOCITY REDUCTION DUE TOCONSERVATION OF MOMENTUM<strong>The</strong> upper block consists <strong>of</strong> the 99 th through <strong>11</strong>0 th stories plus the ro<strong>of</strong> with an approximateweight <strong>of</strong> 69,303 kips, the mass <strong>of</strong> which we will designate as M ( = 2,152 k-slugs). <strong>The</strong>measured velocity <strong>of</strong> the upper block, when it contacts the floor slab <strong>of</strong> the 98 th story, was 22.81ft./s (based on a height between floor slabs <strong>of</strong> h = <strong>11</strong>.44 feet), which we will designate here asV 1.If the masses <strong>of</strong> the 98 th story columns and floor slab are added to the original mass <strong>of</strong> the fallingupper block, the new mass becomes 13/12M.A velocity drop will occur due to conservation <strong>of</strong> momentum and can be found using theequationM x V 1 = 13/12M x V 1 ′As mass drops out <strong>of</strong> the equation we are left with12/13V 1 = V 1 ′Knowing V 1 from the actual measurements and solving we find the new velocity V 1 ′ = 21.06 ft./sreflecting a reduction in velocity due to conservation <strong>of</strong> momentum <strong>of</strong> 1.75 ft./s.<strong>Journal</strong> <strong>of</strong> 9<strong>11</strong> <strong>Studies</strong> 27January 2009/Volume 24