MATHS 181: Elementary Probability and Statistics (3)
MATHS 181: Elementary Probability and Statistics (3)
MATHS 181: Elementary Probability and Statistics (3)
Create successful ePaper yourself
Turn your PDF publications into a flip-book with our unique Google optimized e-Paper software.
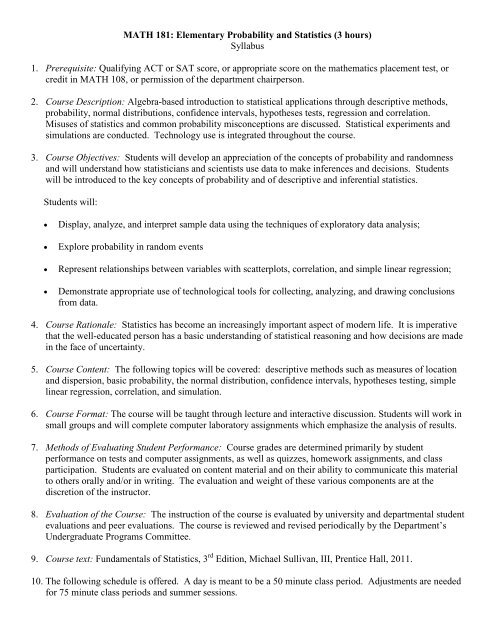
MATH <strong>181</strong>: <strong>Elementary</strong> <strong>Probability</strong> <strong>and</strong> <strong>Statistics</strong> (3 hours)Syllabus1. Prerequisite: Qualifying ACT or SAT score, or appropriate score on the mathematics placement test, orcredit in MATH 108, or permission of the department chairperson.2. Course Description: Algebra-based introduction to statistical applications through descriptive methods,probability, normal distributions, confidence intervals, hypotheses tests, regression <strong>and</strong> correlation.Misuses of statistics <strong>and</strong> common probability misconceptions are discussed. Statistical experiments <strong>and</strong>simulations are conducted. Technology use is integrated throughout the course.3. Course Objectives: Students will develop an appreciation of the concepts of probability <strong>and</strong> r<strong>and</strong>omness<strong>and</strong> will underst<strong>and</strong> how statisticians <strong>and</strong> scientists use data to make inferences <strong>and</strong> decisions. Studentswill be introduced to the key concepts of probability <strong>and</strong> of descriptive <strong>and</strong> inferential statistics.Students will:• Display, analyze, <strong>and</strong> interpret sample data using the techniques of exploratory data analysis;• Explore probability in r<strong>and</strong>om events• Represent relationships between variables with scatterplots, correlation, <strong>and</strong> simple linear regression;• Demonstrate appropriate use of technological tools for collecting, analyzing, <strong>and</strong> drawing conclusionsfrom data.4. Course Rationale: <strong>Statistics</strong> has become an increasingly important aspect of modern life. It is imperativethat the well-educated person has a basic underst<strong>and</strong>ing of statistical reasoning <strong>and</strong> how decisions are madein the face of uncertainty.5. Course Content: The following topics will be covered: descriptive methods such as measures of location<strong>and</strong> dispersion, basic probability, the normal distribution, confidence intervals, hypotheses testing, simplelinear regression, correlation, <strong>and</strong> simulation.6. Course Format: The course will be taught through lecture <strong>and</strong> interactive discussion. Students will work insmall groups <strong>and</strong> will complete computer laboratory assignments which emphasize the analysis of results.7. Methods of Evaluating Student Performance: Course grades are determined primarily by studentperformance on tests <strong>and</strong> computer assignments, as well as quizzes, homework assignments, <strong>and</strong> classparticipation. Students are evaluated on content material <strong>and</strong> on their ability to communicate this materialto others orally <strong>and</strong>/or in writing. The evaluation <strong>and</strong> weight of these various components are at thediscretion of the instructor.8. Evaluation of the Course: The instruction of the course is evaluated by university <strong>and</strong> departmental studentevaluations <strong>and</strong> peer evaluations. The course is reviewed <strong>and</strong> revised periodically by the Department’sUndergraduate Programs Committee.9. Course text: Fundamentals of <strong>Statistics</strong>, 3 rd Edition, Michael Sullivan, III, Prentice Hall, 2011.10. The following schedule is offered. A day is meant to be a 50 minute class period. Adjustments are neededfor 75 minute class periods <strong>and</strong> summer sessions.
11.Section Topic Days1.1 The Practice of <strong>Statistics</strong> 11.2Observational Studies v. Designed Experiments11.3Simple R<strong>and</strong>om Sampling1.4 Other Effective Sampling Methods 11.51.6Bias in samplingDesign of Experiments12.1 Organizing Qualitative Data 12.2 Organizing Quantitative Data 13.1 Measures of Central Tendency 13.2 Measures of Dispersion 13.3 Measures of Central Tendency & Dispersion from Grouped Data 13.4 Measures of Position & Outliers 13.5 Five-Number Summary & Boxplots 14.1 Scatter Diagrams <strong>and</strong> Correlation 14.2 Least-Squares Regression 14.3 Coefficient of Determination 15.1 <strong>Probability</strong> Rules 15.2 Addition Rule & Complements 15.3 Independence & the Multiplication Rule 15.4 Conditional <strong>Probability</strong> & the General Multiplication Rule 15.5 Counting Techniques 15.6 Putting It Together: Which Method Do I Use? 16.1 Discrete R<strong>and</strong>om Variables 16.2 Binomial <strong>Probability</strong> Distribution 27.1 Properties of the Normal Distribution 17.2 St<strong>and</strong>ard Normal Distribution 17.3Applications of the Normal Distribution17.4Assessing Normality7.5 Normal Approximation to the Binomial <strong>Probability</strong> Distribution 18.1 Distribution of the Sample Mean 18.2 Distribution of the Sample Proportion 19.1 The Logic in Constructing Confidence Intervals for a Population Mean When the Population St<strong>and</strong>ard 1Deviation is Known9.2 Confidence Intervals for a population Mean When the Population St<strong>and</strong>ard Deviation is Unknown 19.39.4Confidence Intervals for a Population ProportionPutting it Together: Which Procedure Do I Use?110.1Language of Hypothesis Testing110.2Hypothesis Tests for a Population Mean – Population St<strong>and</strong>ard Deviation Known10.3 Hypothesis Tests for a Population Mean – Population St<strong>and</strong>ard Deviation Unknown 110.410.511.111.2Hypothesis Tests for a Population ProportionPutting It Together: Which Method Do I Use?Inference about Two Means: Dependent SamplesInference about Two Means: Independent Samples1112.1Goodness-of-Fit Test112.2Tests for Independence & the Homogeneity of Proportions12.3 Testing the Significance of the Least-Squares Regression Model 112.4 Confidence <strong>and</strong> Prediction Intervals 139 daysReview3 daysExams3 daysTotal[January 2001, Pierce, E. Bremigan, Umbach; October 2005, Pierce; October 2010, Bergs; October 2012, UPC: R. Pierce, Chair]45 days


