Brief tutorial on Gantt charts
Brief tutorial on Gantt charts
Brief tutorial on Gantt charts

Create successful ePaper yourself
Turn your PDF publications into a flip-book with our unique Google optimized e-Paper software.
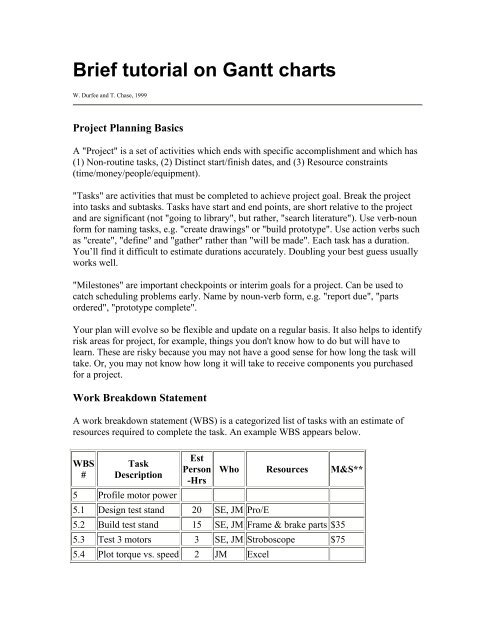
<str<strong>on</strong>g>Brief</str<strong>on</strong>g> <str<strong>on</strong>g>tutorial</str<strong>on</strong>g> <strong>on</strong> <strong>Gantt</strong> <strong>charts</strong>W. Durfee and T. Chase, 1999Project Planning BasicsA "Project" is a set of activities which ends with specific accomplishment and which has(1) N<strong>on</strong>-routine tasks, (2) Distinct start/finish dates, and (3) Resource c<strong>on</strong>straints(time/m<strong>on</strong>ey/people/equipment)."Tasks" are activities that must be completed to achieve project goal. Break the projectinto tasks and subtasks. Tasks have start and end points, are short relative to the projectand are significant (not "going to library", but rather, "search literature"). Use verb-nounform for naming tasks, e.g. "create drawings" or "build prototype". Use acti<strong>on</strong> verbs suchas "create", "define" and "gather" rather than "will be made". Each task has a durati<strong>on</strong>.You’ll find it difficult to estimate durati<strong>on</strong>s accurately. Doubling your best guess usuallyworks well."Milest<strong>on</strong>es" are important checkpoints or interim goals for a project. Can be used tocatch scheduling problems early. Name by noun-verb form, e.g. "report due", "partsordered", "prototype complete".Your plan will evolve so be flexible and update <strong>on</strong> a regular basis. It also helps to identifyrisk areas for project, for example, things you d<strong>on</strong>'t know how to do but will have tolearn. These are risky because you may not have a good sense for how l<strong>on</strong>g the task willtake. Or, you may not know how l<strong>on</strong>g it will take to receive comp<strong>on</strong>ents you purchasedfor a project.Work Breakdown StatementA work breakdown statement (WBS) is a categorized list of tasks with an estimate ofresources required to complete the task. An example WBS appears below.WBS#TaskDescripti<strong>on</strong>5 Profile motor powerEstPers<strong>on</strong>-Hrs5.1 Design test stand 20 SE, JM Pro/EWho Resources M&S**5.2 Build test stand 15 SE, JM Frame & brake parts $355.3 Test 3 motors 3 SE, JM Stroboscope $755.4 Plot torque vs. speed 2 JM Excel
(**M&S = Materials & Supplies)<strong>Gantt</strong> Chart Basics<strong>Gantt</strong> <strong>charts</strong> are a project planning tool that can be used to represent the timing of tasksrequired to complete a project. Because <strong>Gantt</strong> <strong>charts</strong> are simple to understand and easy toc<strong>on</strong>struct, they are used by most project managers for all but the most complex projects.In a <strong>Gantt</strong> chart, each task takes up <strong>on</strong>e row. Dates run al<strong>on</strong>g the top in increments ofdays, weeks or m<strong>on</strong>ths, depending <strong>on</strong> the total length of the project. The expected timefor each task is represented by a horiz<strong>on</strong>tal bar whose left end marks the expectedbeginning of the task and whose right end marks the expected completi<strong>on</strong> date. Tasksmay run sequentially, in parallel or overlapping.As the project progresses, the chart is updated by filling in the bars to a lengthproporti<strong>on</strong>al to the fracti<strong>on</strong> of work that has been accomplished <strong>on</strong> the task. This way,<strong>on</strong>e can get a quick reading of project progress by drawing a vertical line through thechart at the current date. Completed tasks lie to the left of the line and are completelyfilled in. Current tasks cross the line and are behind schedule if their filled-in secti<strong>on</strong> is tothe left of the line and ahead of schedule if the filled-in secti<strong>on</strong> stops to the right of theline. Future tasks lie completely to the right of the line.In c<strong>on</strong>structing a <strong>Gantt</strong> chart, keep the tasks to a manageable number (no more than 15 or20) so that the chart fits <strong>on</strong> a single page. More complex projects may require subordinate<strong>charts</strong> which detail the timing of all the subtasks which make up <strong>on</strong>e of the main tasks.For team projects, it often helps to have an additi<strong>on</strong>al column c<strong>on</strong>taining numbers orinitials which identify who <strong>on</strong> the team is resp<strong>on</strong>sible for the task.Often the project has important events which you would like to appear <strong>on</strong> the projecttimeline, but which are not tasks. For example, you may wish to highlight when aprototype is complete or the date of a design review. You enter these <strong>on</strong> a <strong>Gantt</strong> chart as"milest<strong>on</strong>e" events and mark them with a special symbol, often an upside-down triangle.Using Excel to Make <strong>Gantt</strong> ChartsA sample <strong>Gantt</strong> chart (.pdf format) made using Microsoft Excel appears in the figure,which accompanies this document. If today's date were May 13, Task A would be behindschedule, Task B ahead and Task C right <strong>on</strong> schedule. The events marked by fat dots aremilest<strong>on</strong>es.<strong>Gantt</strong> <strong>charts</strong> made with Excel are easy to update and maintain. Here's how to do it.On a piece of scrap paper, make a list of tasks and assign each task tentative start andstop dates (or durati<strong>on</strong>s) and the people resp<strong>on</strong>sible for the task. Also list important
milest<strong>on</strong>es and their dates. If you have more than 15 or 20 tasks, split your project intomain tasks and subtasks, then make an overall <strong>Gantt</strong> chart for the main tasks and separate<strong>Gantt</strong> <strong>charts</strong> for the subtasks which make up each main task.Decide what resoluti<strong>on</strong> to use in the timeline. For projects of three m<strong>on</strong>ths or less, usedays, for l<strong>on</strong>ger projects use weeks or m<strong>on</strong>ths, and for very short project use hours. Forthese instructi<strong>on</strong>s, we will assume you have chosen a resoluti<strong>on</strong> of days.Fire up Excel. Under Page Setup, select landscape orientati<strong>on</strong>, and then select the opti<strong>on</strong>sto center the chart horiz<strong>on</strong>tally and vertically <strong>on</strong> the page. Also under Page Setup,activate the "fit to <strong>on</strong>e page" butt<strong>on</strong>. (Note that if the text comes out too small, you mayhave to print your chart <strong>on</strong> two pages and paste together. Even better, adjust theresoluti<strong>on</strong> of your date scale or drop less important tasks to make your chart fitcomfortably <strong>on</strong> <strong>on</strong>e page.) Still under Page Setup, set header and footer to be blank. (It'sbetter to write the title right <strong>on</strong> the spreadsheet rather than use the header for the title.Finally, under Page Setup, turn off the opti<strong>on</strong> to print gridlines.Set up the cells. You can use the sample (found elsewhere <strong>on</strong> this web page) as a guide.Use the border command to draw boxes around the appropriate cells. Enter yourscheduling data. To make the gray bars which indicate length of task, select theappropriate cells, then the fill command (<strong>on</strong>e of the butt<strong>on</strong>s near the top).As the project progresses, fill in the gray bars with black to denote the fracti<strong>on</strong> of a taskthat is complete.Project Management PackagesYou can also create <strong>Gantt</strong> <strong>charts</strong> using a project management computer package. Asample chart made using Microsoft Project appears below. Project is the most widelyused scheduling tool for small projects.
Additi<strong>on</strong>al notes <strong>on</strong> <strong>Gantt</strong> ChartsHere are some feedback comments given after a first round of Design Projects <strong>Gantt</strong><strong>charts</strong> was submitted. Check against your <strong>Gantt</strong> chart before publishing:General Notes <strong>on</strong> the first <strong>Gantt</strong> <strong>charts</strong> submitted:1. C<strong>on</strong>sider using MS Project.2. Customize to your particular project. For example, if you are c<strong>on</strong>structing aprototype, show shop time3. If ordering parts, do so as so<strong>on</strong> as the BOM is complete. Getting parts can take 2weeks, sometimes l<strong>on</strong>ger.4. Add presentati<strong>on</strong> prep task(s), report prep task(s)5. Add project title, list of team members.6. C<strong>on</strong>sider adding topics such as "C<strong>on</strong>cept selected"7. Show a c<strong>on</strong>cept design phase, a detailed design phase and a test phase for theproject.8. Should show more detail <strong>on</strong> design tasks, less detail <strong>on</strong> reports/documentati<strong>on</strong>/presentati<strong>on</strong> tasks. Should have about 3/4 design tasks, 1/4documentati<strong>on</strong>/presentati<strong>on</strong> related tasks.