KZWja
KZWja
KZWja
- No tags were found...

Create successful ePaper yourself
Turn your PDF publications into a flip-book with our unique Google optimized e-Paper software.
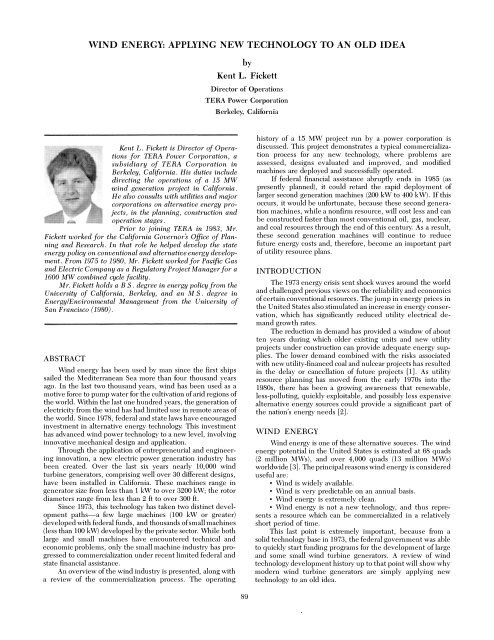
WIND ENERGY: APPLYING NEW TECHNOLOGY TO AN OLD IDEAbyKent L. FickettDirector of OperationsTERA Power CorporationBerkeley, CaliforniaKent L. Fickett is Director of Operationsfor TERA Power Corporation, asubsidiary of TERA Corporation inBerkeley, California. His duties includedirecting the operations of a 15 MWwind generation project in California.He also consults with utilities and majorcorporations on alternative energy projects,in the planning, construction andoperation stages.Prior to joining TERA in 1983, Mr.Fickett worked for the California Governor's Office of Planningand Research. In that role he helped develop the stateenergy policy on conventional and alternative energy development.From 1975 to 1980, Mr. Fickett worked for Pacifw Gasand Electric Company as a Regulatory Project Manager for a1600 MW combined cycle facility.Mr. Fickett holds a B.S. degree in energy policy from theUniversity of California, Berkeley, and an M.S. degree inEnergy/Environmental Management from the University ofSan Francisco (1980).ABSTRACTWind energy has been used by man since the first shipssailed the Mediterranean Sea more than four thousand yearsago. In the last two thousand years, wind has been used as amotive force to pump water for the cultivation of arid regions ofthe world. Within the last one hundred years, the generation ofelectricity from the wind has had limited use in remote areas ofthe world. Since 1978, federal and state laws have encouragedinvestment in alternative energy technology. This investment ·has advanced wind power technology to a new level, involvinginnovative mechanical design and application.Through the application of entrepreneurial and engineeringinnovation, a new electric power generation industry hasbeen created. Over the last six years nearly 10,000 windturbine generators, comprising well over 30 different designs,have been installed in California. These machines range ingenerator size from less than 1 kW to over 3200 kW; the rotordiameters range from less than 2 ft to over 300 ft.Since 1973, this technology has taken two distinct developmentpaths-a few large machines (100 kW or greater)developed with federal funds, and thousands of small machines(less than 100 kW) developed by the private sector. While bothlarge and small machines have encountered technical andeconomic problems, only the small machine industry has progressedto commercialization under recent limited federal andstate financial assistance.An overview of the wind industry is presented, along witha review of the commercialization process. The operatinghistory of a 15 MW project run by a power corporation isdiscussed. This project demonstrates a typical commercializationprocess for any new technology, where problems areassessed, designs evaluated and improved, and modifiedmachines are deployed and successfully operated.If federal financial assistance abruptly ends in 1985 (aspresently planned), it could retard the rapid deployment oflarger second generation machines (200 kW to 400 kW). If thisoccurs, it would be unfortunate, because these second generationmachines, while a nonfirm resource, will cost less and canbe constructed faster than most conventional oil, gas, nuclear,and coal resources through the end of this century. As a result,these second generation machines will continue to reducefuture energy costs and, therefore, become an important paitof utility resource plans.INTRODUCTIONThe 1973 energy crisis sent shock waves around the worldand challenged previous views on the reliability and economicsof certain conventional resources. The jump in energy prices inthe United States also stimulated an increase in energy conservation,which has significantly reduced utility electrical demandgrowth rates.The reduction in demand has provided a window of aboutten years during which older existing units and new utilityprojects under construction can provide adequate energy supplies.The lower demand combined with the risks associatedwith new utility-financed coal and nulcear projects has resultedin the delay or cancellation of future projects [1]. As utilityresource planning has moved from the early 1970s into the1980s, there has been a growing awareness that renewable,less-polluting, quickly exploitable, and possibly less expensivealternative energy sources could provide a significant part ofthe nation's energy needs [2].WIND ENERGYWind energy is one of these alternative sources. The windenergy potential in the United States is estimated at 68 quads(2 million MWs), and over 4,000 quads (13 million MWs)worldwide [3]. The principal reasons wind energy is considereduseful are:• Wind is widely available.• Wind is very predictable on an annual basis.• Wind energy is extremely clean.• Wind energy is not a new technology, and thus representsa resource which can be commercialized in a relativelyshort period of time.This last point is extremely important, because from asolid technology base in 1973, the federal government was ableto quickly start funding programs for the development of largeand some small wind turbine generators. A review of windtechnology development history up to that point will show whymodern wind turbine generators are simply applying newtechnology to an old idea.89
90PROCEEDINGS OF THE FOURTEENTH TURBOMACHINERY SYMPOSIUMDEVELOPMENT HISTORY OF WIND ENERGYTECHNOLOGYThe development history of wind energy is basically areview of improvements in blade design. Since the PersianPanemones of 200 B.C. (Figure 1), two principal factors havelimited its use worldwide: limits in blade design, which haverestricted machine efficiency, and the economics of other energyresources. The importance of blade design becomes veryclear after a review of the equation for conversion of the kineticenergy of the wind to power.whereP =powerp = air densityA = area swept by rotor in square feetV = wind speed in miles per hour [5](1)As the eighteenth and nineteenth centuries advanced, theinvention of the steam engine, along with the shift from anagrarian to an industrial society, changed the economics ofwind power. The invention of cheaper, more efficient, andmore reliable steam energy technology created the first constraintto the use of wind power. By the 1800s, the number ofwind machines in Europe had diminished to under twothousand. Ironically, it was in the 1800s that wind power firstgained major influence in the United States [5].Westward expansion into the more remote, arid parts ofthe United States demanded technology to pump water. In theearly 1800s, the first American wind machines were developedfor this purpose. These metal, multiblade machines were notvery efficient, but their slow speeds and blade mass producedthe torque needed to lift water. It is estimated that by the mid-1800s wind provided 25 percent of non transportation energy.Hundreds of companies were producing thousands of waterpumpers with many different models derived from the samebasic theme. However, by the 1980s, the introduction ofcheaper and more efficient electrical pumping broughteconomic factors into play that reduced the use of wind powerin the United States, except in very remote rural areas [4].WindBlades_/Figure 1. Schematic View From Above of a PersianPanemone-Designed and Operated About 200 B.C.Because little can be done about air density or wind speedexcept locating a machine in a favorable site, most improvementsin the efficiency of wind machines have concentrated onthe blade design.The Persians' first vertical axis wind machine (Panemones),while useful, had limited efficiency because only half ofthe total blade or paddle area could be exposed to the wind at atime. By 100 A. D., the first horizontal axis applications were inuse around the Mediterranean Sea as water pumps. Usingsmall cloth sails as blades, these machines represented a stepforward in blade design, because the entire blade area wasexposed to the wind (4].Such advances in blade design first began to occur innorthern Europe in 1200 A. D. Brought back from the Mediterraneanby the Crusaders, these advances consisted of largercloth sails which converted wind energy into mechanical energyfor pumping water, grinding grain, and eventually runningsmall industrial facilities. Having developed machines capableof delivering up to 90 hp in strong winds, the Dutch andDanish made dramatic advances in the application of basichorizontal axis technology, so that by the seventeenth centuryover 25,000 windmills were in use in northern Europe (4].BLADE TECHNOLOGY EVOLVES-THEAIRFOILBy 1900, technological advances in Europe and theUnited States had set the stage for the next significant improvementin blade design, the application of a true airfoil.Prior to, and just after, World War I, development in aviationtechnology improved the wind machine blade efficiency. Windmachines, with fewer blades and reduced mass, allowed higherrotational speeds, which were better suited to the productionof electricity.Although wind turbine generators had become muchmore efficient in design, the economics of wood, oil, andnatural gas as fuels limited the use of wind power to designsunder 5 kW. Larger machine development was also constrainedby the cost of the increased mass needed to support largerblades. A few exceptions to these constraints on large machinedesign were:Denmark-Hundreds of medium-size machines (20-30kW) were deployed prior to 1914 to provide the Danish dairyindustry with remote power. These machines were refurbishedand used during World War II when other energy sources werescarce [2].Russia-In 1913, a 100 kW machine was built andoperated on the shore of the Black Sea. The machine ran for anumber of years in parallel with a 20 MW steam turbine somemiles away [2].The United States-The largest electrical generatingmachine developed prior to 1945 was installed at Grandpa'sKnob in Vermont in 1939. Constructed and operated by theSmith-Putnam Company, the 1250 kW machine producedintermittent power from 1939 to 1945. In 1945, a blade rootfailure caused the loss of one of the two 8-ton blades. Ironically,the problem had been foreseen and new blades had beendesigned, and were to be manufactured after World War II.However, the accident, combined with post-World War IIeconomics, did not justify repair and operation [6].During World War II, world oil shortages caused manycountries, such as Denmark, to reactivate and use old nonoperatingwind machines; however, economic factors changedafter the war and limited efforts to develop wind poweroccurred.During the period 1945-1973, the principal efforts to usewind power took place in Europe. The Danish built a 60 kW, a70 kW, and a 200 kW WTG, the latter running from 1958 to
WII\iD E,\TEHGY: APPLYING NEW TECHNOLOGY TO AN OLD IDEA911967, when it was shut off because of cheap oil prices. It wasplaced back into service from 1977-1979 for research purposes.The Germans built a two-bladed, teetered, 100 k\V unit thatran from 1957-1968, and the French built an 800 k\V unit thatran from 1958 until the mid-1960s, when a blade failed anddestroyed the machine [ 4].By 1973, post-World \Var II advances in separate technicaland engineering areas had provided the basic components formodern wind turbine generators. Principally, as the result ofadvances in helicopter rotor design and further advances inaerospace and wind tunnel applications, smaller, lighter, andmore efficient blades were developed that allowed a reductionin the overall machine mass. The development of epoxies,plastics, and fiberglass contributed to continued blade advances.For example, the use of wood-epoxy laminating wasfound to be good for blades up to 200 ft long, and was betterable to withstand the tremendous cyclic loads inherent in largemachine operation [7].MODERN TECHNOLOGY-REFINEIENT OFDESIGNSThe basic components of a modern horizontal axis windturbine generator arc shown in Figure 2-gcnerator (bothinduction and synchronous), transmission, brake (airfoil anddisk) and blades. In 197:3, with a solid teehnical base, theeconomies of generating energy from the wind was the criticalissue. The enrgy/eeonomie shake-up of the early 1970s triggeredextensive efforts to develop cost-eHective wind turbinegenerators.blades, unit costs are reduced. However, the use of two bladescreates serious engineering problems with respect to dynamicloading and resonance. As a major research project, the operationof the .MOD 0 provided technical review in the followingareas [5]:• Tests with utility grid interface• Tests in an isolated system connected to dieselengine/generator• Tests on blade dynamics, vibration, and fatigue• Development of sophisticated analytical tools to evaluateand predict loads on large rotating stmctures.The progression in large-scale wind turbine developmentfrom the MOD 0 to the :MOD 5 is shown in Figure :3 [8]. Thelarge machine research program prototypes are listed in Table 1[ 4]. The results of the large-scale work done by DOE/NASAcan best be summarized by the operating history of a PacificGas and Electric Company's (PGanclE) MOD 2, which isinstalled in Solano County, California, 10 miles northeast ofSan Francisco.GEARTRANSMISSIONBRAKEPrime controctorFirst Second ThirdGeneration Generation GenerationIf) 100 140 200125 200 320200 2000 3200Figure 3. Various Large Wind Turbine Generators DevelopedThmugh the Federal Assistance Program.Table 1. Federal Covermnent Large Machine Research Program[4].HIGH-SPEED SHAFTNASA R&DHAWT CAPACITY BUILT BYPROTOTYPEINSTALLED ATFIR.STTURNEDSLIP RINGMOD-O 100 kW@ 14.5 mph NASASandusky 1 OHSept., 1975BLADESTOWERMOD-O A 200 kW @ 18.3 mph(four machines)WestinghouseWestinghouseWestinghouseClayton, NMCulebra, PRBlock lsi., RlMarch, 1978Jan., 1979Oct., 1979WestinghouseOahu, HIMay, 1980Figure 2. Major Components of a Modern Horizontal Axis\Vind 1!trbine Generator-.MOD-I 2.0 MW @ 25.7 rnph G.E.Boone, NCSept., 1979Large 1\iachines\Vith a sense of national emergency, the United States'federal government (Department of Energy and NASA) spent250 million dollars beteween 1973 and 1980 on the developmentof wind energy [7]. The majority of that money went intothe development of the first modern large wind turbines. Thefirst of these machines, the .MOD(el) 0, was deployed by NASAat their Lewis Research Center near Sandusky, Ohio. This 100k\V unit had a rotor diameter of 12.5 feet, the second largestever built.The i\lOD 0 used two blades, principally because in largemachines (over 100k\V) the blades and hub assembly tend tobe the highest cost items. \Vith two blades rather than threeMOD-2 2.5 MW @ 19.5 mph Boeing(four machines)MOD-SA 6.2 MWMOD-SB 7.2 MWMOD 2BoeingBoeingBoeingG.E.BoeingGoldendale, WAGoldendale, WAGoldendale, WAMedicine Bow, WYdesign study onlydesign study onlyDec., 1980Feb., 1981May, 1981early 1982Built in 1981, the MOD 2 began operation in April 1982.Designed and built by an aerospace contractor, the MOD 2represents the state-of-the-art in large multi-megawatt wind
92PROCEEDINGS OF THE FOURTEENTH TURBOMACHINERY SYMPOSIUMturbine generators (Figure 4). Specific information on theMOD 2 dimensions is listed in Thble 2. Installed costs totaledover 12 million dollars or 4800/kW. Since beginning commercialoperation in November of 1982, the PGandE MOD 2 hasexperienced various problems which have reduced productionto 7000 MWhr, significantly below its theoretical limits [9].Figure 4. PGandE's 2.5 MW MOD 2, Solano County California,1985.Table 2. Information on PGandE's MOD 2 [7].0 Generator Capacity 2500 kW0 Generator Voltage 4160 V/115 kV0 Generator Speed 1800 RPM0 Rotor Length Tip-to-Tip 300 Feet0 Rotor Weight 94 Tons0 Rotor Speed 17.5 RPM0 Tip Speed 190 MPH0 Tower Height 200 Feetlikely limit the commercial development of large multimegawattwind turbines-cost, and the complexity of developmentof designing for a varied wind resource across large rotorareas.Even in mass production, without federal assistance thecosts to install and operate a MOD 2 type machine will not becompetitive with smaller wind machines. For comparativepurposes, the PGandE 2.5 MW MOD 2 cost $4800/kW installedand has produced 7000 MWhr in three years of operation.TERA Power Corporation has operated 50, 50-kWmachines (2. 5 MW) at an installed cost of about $3000/kW foronly two years and has produced 8.5 million kWhrs. Theprincipal reason for this better performance with smallermachines is availability. As will be discussed later, smallmachines have had a large number of problems, perhaps morethan PGandE's MOD 2. However, the number of machinesdeployed per megawatt improves availability and thus production.For example, each problem on the MOD 2 takes 2. 5 MWoffline. Similar problems on a smaller machine take only 0.05MW offline.The second issue of the effects of a site's vertical windresource on large blades poses tremendous uncertainty. Asmore data are collected, shifts in wind directions and speed atvarying heights are showing that many wind sites may belimited to machines that remain within the first 200 feet abovethe ground surface. Because of these issues, multi-megawatttechnology does not appear ready for commercialization. Smallmachine technology does appear to show promise.Small MachinesStarting in 1973, federally funded research on smallmachines took place mainly at the DOE Sandia Laboratories inAlbuquerque, New Mexico, and at DOE's Rocky Flats facility.Vertical Axis Machines. Sandia focused principally onvertical axis technology. Vertical axis machines represent animportant airfoil distinction because each blade section experiencesa constant angle of attack during one rotation, whereas inhorizontal axis machines, each section of blade experiences avaried angle of attack during one rotation [10]. With all majorcomponents on the ground (Figure 5), vertical axis machines0 Nacelle Weight 94 Tons0 Total Weight of WTG 314 Tons (Approx.)0 Cut-In Speed 14MPH0 Cut-Out Speed 60 MPH0 Electronic Controls MicroprocessorThis low output and capacity factor (16 percent in 1984)are attributed primarily to various unforeseen problems withthe machine that have occurred over the last two years. Theseinclude:• The need to install small metallic strips as vortex generatorsto improve the aerodynamic efficiency of the blades• Work on the variable pitch control system• Blade stress situations that were related to differing windspeeds and directions at various levels across the blade• Replacement of a cracked, low-speed shaft• Overheating of the main shaft bearing caused by poorstartup lubricationEven though these problems were serious, they havebeen solved and 1985 performance has improved significantlyover 1984. Ironically, while the PGandE machine has contributedvaluable research information, two factors, which haveindirectly come from its development and operation, will mostFigure 5. Typical Vertical Axis Machine.
WIND ENERGY: APPLYING NEW TECHNOLOGY TO AN OLD IDEA93held the potential for reduced maintenance costs. This advantageis discounted somewhat because the vertical axis machine,being close to the ground, has to deal with more turbulentwinds.Horizontal Axis Machines. The Rocky Flats R&D programprovided the basis for the development of many of the existingsmall horizontal axis machines in use today. Working with 1kW, 4 kW, 8 kW, 15 kW, and 40 kW capacity units, extensivetesting in extreme weather conditions was conducted [4].About 80 percent of the machines installed in California arehorizontal axis machines.Some of the major small machines designs in use today areshown in Figures 6 and 7. While the federal government hasfunded both large and small machine research, the privatesector has advanced the small machine to commercial status.Because of the significant economic incentives provided byCongress in 1978, private investment has surged. The PublicUtilities Regulatory and Power Plant Act of 1978 required allutilities to buy power from private generators at the utilities'avoided cost. That, in combination with large tax credits foralternate energy investment, has put over three billion dollarsinto California wind development since 1979 with almost all ofthat money going towards machines rated at under 150 kW[10]. This was principally due to the cost and perceived risk oflarge machines (six to ten million dollars for a MOD 2),compared to small machines (93,000 to 150,000 dollars for a 50kW machine).the leading position both in the United States, and the world.How the industry has grown since 1981 is shown in 'Thble 3[11]. Installed capacity is over 609 MW. This could possiblydouble by the end of 1985. The number of machines isapproaching 10,000, and each year the average price perinstalled kW has dropped, from $3, 113/kW in 1981 to$1,860/kW in 1984. Projects under construction in 1985 will besold to investors at a price range of $1350-$1700/kW.Table 3. Status of Wind Development in California [9]..!2M 1982 1983 1984Number of Turbines Installed 144 1,289 3,782 8,469(Cumulative)Number of MWs Installed 7 71 243 609(Cumulative)Average Size of Turbines (kW) 49 56 69 78Average Size of Projects (MW) .9 2.4 7 IIAverage Capital Cost (84$) 3,113/kW 2, 175/kW 1,900/kW I ,860/kWKilowatt Hours Generated 5 so 195(Millions)·I11090705030Such prices for wind generation compare very favorablywith other electric-generating resources available in Californiaor under consideration as future generation resources as shownin Tables 4 and 5 [1]. Competitive prices, short lead times forinstallation, and the use of third-party capital have led all majorutilities in California to adopt aggressive alternative energypolicies.10First GenerationSecond GenerationTable 4. Comparison of California Generation Alternatives1984 Constant Dollars [1].Height of blades ax1s (fl.)Rotor diameter (fl.)Rated (kw)30-80'23-56'17..s5kw60-105'60-100'100-340 kwFigure 6. Various Small to Medium Size Wind Turbine GeneratorsThat Have Been Developed Through Federal Assitanceand Private Investment.COST OF POWER CAPACITY COSTGENERATION RESOURCE SIZE (¢/kWh) ($/kW)NUCLEAR 2 X 1,200 MW 13.84¢ $5,546COALCalifornia 2 X BOO MW 11.71 2,692Non-California 2 X 8QQ MW 8.52 1,952Fluidiz!!!d Bed 2 X 500 MW 12.78 3,297OIL FIRED 500 MW 15.97 858COMBUSTION TURBINE 4 )( 75 MW 17.72459HYDROELECTRICSmall 5 MW 8.52 3,379Major 50 MW 10.65 3,308WIND ENERGY 400 x tOO kW 9.50 1,550Table 5. Comparison of California Generation Alternatives1990 Nominal Dollars [1].GENERATION RESOURCE CAPITAL COST ($/kW) COST OF POWER (¢/kWh)NUCLEAR $3,056 -5,492 14.9-23.0COAL 3,151 )9.8-24.9OIL 1,325 17.5-30.0Figure 7. Various Small Wind Turbine Generators That HaveBeen Developed Through Private Investment.CALIFORNIA PERSPECTIVEThe combination of high avoided cost, positive governmentregulation, and excellent wind resources located in lightlypopulated areas has placed California wind development inGAS 1,325 15.8-28.4GEOTHERMAL 1,096- ),612 15.4- )6.6HYDROELECTRIC 91 I -3,068 5.4-16.2WIND POWER 1,485-2,188 7.5-11.0Assumes power deliveries begin in 1990
WIND ENERGY: APPLYING NEW TECHNOLOGY TO AN OLD IDEA95financial institutions similar to real estate projects. The majorproblem that may occur will be the lack of extensive operationalexperience, particularly on later, improved scale-ups of smallmachines, to satisfy conservative lending institutions.WIND PROJECT DEVELOPMENT-ALTAMONTPASSSiting a Wind ProjectIn 1979, PGandE and the California Energy Commissionbegan to conduct wind energy assessment studies in northernCalifornia. Using historical information, they selected variouslocations to install anemometers to measure annual windspeeds. In Altamont Pass, these studies were conducted untillate 1981 and showed that Altamont Pass had an excellent windresource with an annual mean wind speed in the range of 15 to18.6 mph.At this point, private developers began to negotiate forleases with land owners and to place their own anemometerson various pieces of land to assess the local wind resource.Given the vastness of the areas (thousands of acres), limitedinformation was refined by going out on windy days to fly kites.While it may sound strange, kite-flying provides a fairly accuratemeans of assessing the affects of topography on local windcurrents. Such methods were used to determine specificmachine locations. Since in most major California wind areas,the wind blows in predominantly one direction, most machinesare oriented in rows perpendicular to the wind. Down-windspacing to avoid long-term rotor turbulence effects is usuallybetween five to seven rotor diameters. A typical Altamont Passwind farm with substation and parallel rows of machines isshown in Figure 12.Figure 12. A 'I!Jpical \tlnd Farm Layout with Substation andRows of Machines.The Wind ResourceThe wind resource of the Altamont Pass is very reliable.Every year starting in March, the combination of warmingtemperatures in the California Central Valley (high pressure)and cool arctic currents off the coast (low pressure) of California,create conditions that draw cool heavy moist air into SanFrancisco Bay and through the low passes of the Californiacoastal mountains. One such pass is the Altamont Pass nearLivermore, California.As spring progresses to summer, coastal water upwellingand temperatures in the high 90s and low 100s in CentralCalifornia increase wind movement. The classic annual cycle ofaverage monthly wind speed averages for Altamont Pass, alongwith a probability range for annual averages near TERA Power'sDelta Energy Project Site is shown in Figure 13. Duringthe summer months, monthly average wind speeds can rangefrom 20 mph to 30 mph with some 24 hour periods equalling 40mph. Peak gusts of 60 mph are not uncommon during certainweather cycles.fQ.0tl1 20Q.(/)0zw 10(!l..:0:w',./""''Probability Range(15,1-22.1mph)1981 AVERAGEWIND SPEED (18.6 mph)1---... ·y''---------"""'.-------1 /·71984¢;Y'SED (15.4 mph)::>\\ESiimatedwindspwdonsiiEIF M A M 0 N 0Figure 13. Typical Altamont Pass Annual Wind Cycle Shownwith 1981 and 1984 Wind Data from TERA Power CorporationsDelta Energy Project.On a daily basis, winds in the Altamont Pass typicallybegin in the middle to late afternoon, peak from midnight to sixa.m. and taper off by noon. While occurring on an averagebasis, this type of cycle does not happen every day. This pointsout one of wind power's major disadvantages, that it is a nonfirmresource for utility planning and as such cannot bedispatched.Wind Resource EngineeringSince 1981, considerable amounts of data have greatlyimproved the understanding of the wind resource on a macroscale,and the microeffects of topography and machine siting onmachine operations and performance. For example, TERAPower Corporation has installed a computerized projectmonitoring system that collects wind speed data from 132locations, at its 500 acre Delta Energy Project site, eleven atindependent locations and 121 at machine locations. The datafrom this system will expand the understanding of site-specificwind resource and machine interations, and improve sitingtechniques in the future.These types of data helped PGandE determine possiblecauses for operational problems with the MOD 2. Their extensivewind data collection found that wind shear, which is thechange in wind speed and direction at different elevations,significantly affected machine performance. On a large bladesuch as a Mod 2 (300 ft), different wind speeds in differentdirections create very complex loads on rotating equipment.At TERAs Delta site, turbulence close to the ground couldcreate long-term equipment fatigue on machines. The dataproduced by such wind resource evaluations are being factoredinto machine design and siting criteria so that long-term improvementsin performance with reduced maintenance costscan be realized.TERA POWER'S DELTA ENERGY PROJECTIn 1982, TERA Power Corporation installed the first fiveunits of its 200 wind turbine generators at the Delta EnergyProject. The project covers 500 acres of land which is leasedfrom the Department of Water Resources (DWR). DWR is astate utility which conveys water and power throughoutCalifornia. TERA sells power to DWR for use in its South BayPumping Plant, where the energy is used to pump water to theSanta Clara Valley (Silicon Valley).Since 1982, TERA has installed 145 machines, with anadditional 55 to be installed in 1985. The machines are downwindhorizontal axis machines rated at 50 kW at 30 mph. Themachines have a 54 foot rotor diameter, cut in at 14 mph and
96PROCEEDINGS OF THE FOURTEENTH TURBOMACHINERY SYMPOSIUMcan generate a peak capacity of 95 kW in 45 mph winds (Figure14). When completed, the Delta Energy Project will provide15 MW of peak capacity and approximately 40 million kW peryear of energy to the Department of Water Resources. As ofMay 1, 1985, the project has produced over 13 million kWhr,50 percent of that energy being produced since August 1984.Machine availability for the project was above 90 percent for1984.KilowattOutputT8070Figure 15. ESI Maintenance Crews on the Ground ConductingMajor Maintenance Work.Operational HistoryAnnual energy production since 1982 for the Delta EnergyProject is shown in Figure 16. Per machine production increased20 percent from 1983 to 1984. This improvementresulted from improvements in maintenance and operatingprocedures. Since 1982, a number of problems have beenencountered in the machines. As each problem has occurred,the user has worked with ESI to assess the problem anddevelop prudent analytical methods to solve the problem. Abrief, but more detailed review of the major problems andsolutions encountered over the past two years should providean example of the wind industry's technical maturing process,and why future larger machines should be more cost effective.100,000 ::r)>()I50,000 zm10 14 2030 60Wind Speed (mph) ..Figure 14. Power Curve for an ESI 54's Wind Turbine Generator.ConstructionWind energy project construction is simple compared toconventional power station construction which TERA Corporationhas managed in the past. Each machine requires a foundationof three 12 foot concrete piers. An 80 foot latticed tubulartower is bolted to the foundation and the machine and bladesare mounted on the towers (Figure 15). Each tower is hingedso that it can be raised and lowered by a crane for majormaintenance work. All electrical and control wire runs areunderground in conduits and are collected in a cinder-blockcontrol building. Each machine control panel is mountedinside the control building and wired. Each control buildinghandles eight to sixteen machines and has one or two padmounted500 or 750 KVA transformers used for step-up from480 V to 12.47 kV. Breakers at each control building range from800 amps to 1600 amps.A single three-phase pole line collects site generation anddelivers power to a substation onsite, where 12.47 kV isstepped down to the 4160 V power needed to run DWR'spumps. Installation of 85 machines and support facilities wasaccomplished in six months.>fl 1983 value has been extrapolated to reflect a full year's operation based on 6 months of actual operation.Figure 16. Annual Energy Production, TERA Power CorporationsDelta Energy Project.PROBLEMS AND SOLUTIONSThe problems and associated solutions that TERA Powerhas experienced with its ESI-54 machines are listed in Table 6.Problems are to be expected with any new product. In anycase, the manufacturer and TERA Power have responded tothe problem by applying well-balanced engineering, testing,and management methods. It is important to note that the ESI-54 machine was a predecessor to the ESI-80, a 250 kW ratedmachine at 30 mph. This second generation scale-up of theESI-54 has had all the improvements developed for the ESI-54incorporated into its commercial design. The ESI-80 is beingdeployed in 1985 at a cost of between $1100 to $1500/kW,depending on the site wind resource and substation needs.Cracked Transmission FeetProblem. In late 1983, small cracks were discovered ingearbox feet on machines that had run more than 3000 hours.ESI engineers responded by strain gauging the troubled areaand monitoring stress levels during various operating conditions.At the same time, a structural analysis was performed byusing both textbook strength-of-material equations and finite-
WIND ENERGY: APPLYING NEW TECHNOLOGY TO AN OLD IDEA97Table 6. Problems and Solutions Encountered by TERA PowerCorporation with the ESI 54 Wind Turbine Generator.PROBLEM ENCOUNTEREDSOLUTIONI) Cracked Transmission Feet a) Design Improvementb) Material Improvementc) Tip Brakes to Reduce Peak Loadsd) Low Power Brakinge) Soft Starting2) Tip Brake Nuisance Deployment a) Electromagnet Tip Mechanism3) Brake Failure a) Alternate Supplier of an IndustrialRated Brakeb) Reduce Braking Demands UsingActive Control of Tip Brakes4) Coupling Failure a) Proper Alignment SpQ ificationb) Accurate AI ignment Technique5) Insect Degraded Performance a) Use the Roughness Insensitive LS(I)Airfoil6)Lower than ProjectedPerformancea) Improved Availability Due to FixedProblemsb) Improved Airfoil Performance inVaried Environmental Conditionselement computer modelling of the foot with predicted loadsapplied. Since the gearbox supplier was responsible for thedesign of this custom housing for their standard gear package,the user had no previous analysis to fall back on.After the foot design was studied, it became clear that thecasting was poorly designed. The web that supported the footwas o/s in thick, while the main portion of the foot was a 1 l/2 inthick cantilevered beam. Since the web was thin, it cooledquickly during casting, forming a fine-grained structure. Thisled to a brittle material. A thicker web would have reducedstresses and improved material properties.Solution. The first, most obvious solution was to changethe foot design to reduce the stresses. A solid web was installedon all new gearboxes and the material was changed to a ductileiron casting. Since implementing this new design, there havebeen no problems. To prevent cracks from occurring on existingunits in the field, a torque bracket has been designed whichshares the torque loads and reduces the foot stresses to 30percent of their original values. This improvement on thelarger ESI 80 (250 kW) machines is shown in Figure 17.Tip Brake Nuisance DeploymentsProblem. The purpose of tip brakes is to slow down therotor speed in overspeed conditions. The first design used a tipbrake deployment mechanism which relied on a shear wire tobreak if centrifugal loads exceeded a safe limit (Figure 18).After deployment in the field, it was found that, in very highwinds, tip brakes would deploy even though no overspeed hadoccurred. Such deployments took machines out of servicewhen they were producing most of their power. The normalresetting of these tips required maintenance personnel to climbmachines in high wind and nighttime conditions.To study the problem, ESI designed a strain gauge transducerto measure loads acting directly on the shear wire. Aftermany hours of monitoring shear wire loads in various windconditions, it was discovered that a 20 Hz oscillating load wassuperimposed on the steady centrifugal load. The amplitude ofthis oscillating load was only a few percent of the steady load inmedium winds, while in high winds it increased to a peak-topeakvalue of 30 percent of steady shearing load. This wasenough to accelerate fatigue in the shear wire. Using accelerometersmounted in the blade, the source of this 20 Hzload was discovered to be a very minor edgewise accelerationin the blade, which excited the shear wire counterweight.These accelerations resulted in forces acting on the shear wire.Figure 17. Improved Transmission Feet on an ESI-80.Figure 18. Old Style Shear Wire Tip Brake or Vane.
98PROCEEDINGS OF THE FOURTEENTH TURBOMACHINERY SYMPOSIUMSolution. Use of an electromagnet to hold the tip vane inthe run position eliminated the counterweight, which wassensitive to inertia loads. It also resulted in a system which isinsensitive to fatigue. By killing power to the magnets, thesystems can be used actively as an aerodynamic brake for therelatively infrequent high power stops, which are the onlydemanding stops on the mechanical brake.By going to an electromagnetically held tip brake mechanism,nuisance deployments were solved, time-consumingmanual resets were eliminated, and brake loading in high windshutdowns was reduced (Figure 19). Using the electromagneticbraking has also indirectly solved braking problems outlinedlater in this paper. This system has been implemented on allnew ESI machines and is being retrofitted onto older units. Allparts are stainless steel except the magnet parts, which areplated. The vane is made of fiberglass for lightweight but stiffconstruction (Figure 20).Early Problem. The original brake on the 1982 and 1983ESI machines was a fluid disc brake. The brake was rated tostop the machine under full load; however, excessive wear on100 percent of the units in operation caused excessive maintenancecosts and downtime. After rechecking the originalanalyses to confirm the braking torque and braking energyrequired, and performing field tests, the 1nan 1facturer wasconfident that the specifications were correct.Solution. The original brake was replaced by a frictionplate brake after extensive proof testing. A test stand wasdesigned so the manufacturer could cycle the brake at maximumbraking energy once every two minutes for 1000 cycles.The friction surfaces were contaminated with grease to test lossof torque. All these tests demonstrated that this brake wasappropriately sized and truly rated for the specific loads.Field tests on operating machines proved to be consistentwith the proof test results. Even after thousands of operatinghours the brake demonstrated consistently less than 0.010 inwear.Later Problems. Following the transmission and brakeretrofits in late 1984, failures began in the high speed gearcarriers on a few machines. These failures occurred mostly atthe same location and resulted in the loss of drive train andprimary braking systems (Figure 21).Solution. To solve this problem, braking torques werereduced through the use of a low-speed braking system. Underprior operating conditions, air pressure was released instantaneouslyto apply the spring-loaded brake. With the newbraking system, air is gradually released in two stages so thatbraking torque loads are spread out.This solution, along with the addition of actively controlledtip brakes, has reduced the loads on the drive train andbrake. This type of braking has been implemented on both newESI-54 and ESI-80 machines with great success.Figure 19. New Electromagnetic Tip Brake AssemblyDeployed Position.Figure 21. High Speed Carrier Gear Failure.Figure 20. New Tip Brake in Operating Position.Brake FailureCoupling FailuresProblem. After several thousand hours of operation, about20 to 30 of machines' gear couplings wore excessively. Thecause was not obvious, because the coupling was rated for ninetimes the peak load being applied, and alignment was beingperformed to the manufacturer's written specification.Consultation with the manufacturer revealed that thealignment specifications printed in their literature were ambiguous.A well-defined specification showed that maintenancepersonnel had been allowing too broad a tolerance on theiralignment procedure. Another problem that occurred frequentlywas the loosening of the taper lock fittings and theslippage of the couplings along the shaft.Solution. To more accurately align the couplings, a methodwas employed that used two dial indicators and a graph.Alignment measurements were plotted accurately on the graphto within 0.001 in of parallel and angular alignment. Thismethod was far more accurate than the feeler gauge methodpreviously used. The final alignment could be plotted graphically,ensuring documentation of quality control. This method isnow universally used in production and in maintenance. Toeliminate any potential taper lock fitting slippage, a heat shrinkfit was substituted for the taper locks.
WIND ENERGY: APPLYING NEW TECHNOLOGY TO AN OLD IDEA99Insect Buildup on BladesProblem. The ESI-54 was designed with a relatively highperformance airfoil common to helicopter and gyrocopter design.This very common airfoil has been used on wind turbinesbecause its high lift and low drag guarantee peak performance.After initial operation of a large number of machines in 1983, itwas found that wind turbine performance was better thanpredicted until airborne insects built up along the leading edgeof the airfoil. After significant insect build up, machine performancedropped dramatically as shown in Figure 22.After some research, the manufacturer found that theairfoils performance was particularly sensitive to leading edgeroughness. Because the pressure (suction) acting on the leadingedge is very high compared to the trailing edge, any roughnesswould cause separation of the air passing over the leadingedge, destroying a large percentage of the total lift on theThis scale-up has occurred based on sound operating historyand design improvements. On TERA Power's Project, eachmonth of operation is seeing continued improvements onmachine performance and revenue generation. Availability isover 95 percent through April 1985 and no major problemshave occurred since mid 1984.The industry as a whole is struggling to make the transitionto larger cost-effective machines before the federal taxcredits disappear in late 1985. Those manufacturers and developersthat have a good track record of performance and ascaled-up product should succeed in producing power from thewind at a reasonable cost.As improvements on the second generation or mediumsize machines occur, utilities will begin to consider windprojects as viable investments. Using standard utility financingwith a 30 year levelized price, these machines can be installedand operated between 7.5 and 9.5 cents per kWhr in 1984dollars. With ever increasing fuel prices, using wind energy asa reliable part of this nation's electric generation resources willcontinue. The rate at which that occurs will depend primarilyon the acceptance by financial institutions of the possible risksgiven the limited operating history of the second generationmachines.2010 15 20 25WINDSPEED (MPH)Similar results are expectedfrom the ES154• Probable reduced power outputrange due to 1nsect accumulation30 35Figure 22. Effects of Insect Build-Up on Power Curve.airfoil. This pressure distribution, which is normally good forclean blade performance, adversely affects performance ondirty blades.Solution. Short-term, the blades were manually washedevery three to ten days. By 1986, existing blades will beretrofitted with a polyurethane coating which will allow highpressure water to wash blades from the ground. Long term, themanufacturer has found an airfoil which is insensitive to theeffects of insect accumulation or leading edge roughness. Thenew blade allows the pressure distribution to be flat fromleading to trailing edge, instead of relying on leading edgepressure to develop most of the lift. This assures that the bladewill stall from the trailing edge. This same airfoil has been usedin aircraft to improve wet-weather flying performance.This airfoil has been used on the ESI-80 and has proven tobe a great improvement over the ESI-54 dirty blade performance.Bug, oil, or dust build-up have not degraded performanceto any measurable extent on the ESI-80, while ESI-54scontinue to require periodic cleaning.CONCLUSIONAs of 1985, a number of small wind turbine generatorshave been scaled up to medium size machines (200-400 kW).4045REFERENCES1. California Energy Commission, "Affordable Electricity inan Uncertain World," California Energy Commission'sFifth Biennial Report, pp. 1-1, 1-2 (April 1985).2. Warne, D. F. and Calnan, P. G., "Generation of Electricityfrom the Wind," Institution of Electrical EngineersProceedings, 124 (11R), pp. 963-985 (1977).3. Gustavson, M. R., "Limits to Wind Power Utilization" 'Science, 204, (4388), pp. 13-17 (1979).4. Vosburgh, P. N., "Commercial Applications of Wind Power,"Van Nostrand Reinfold Company, Incorporated, pp.201-250 (1983).5. Divone, L. V., "Wind Power Test will Establish Role onUtility Systems," Public Power, 36, (2), pp. 34-37 (1978).6. Koeppl, G. W., Putnam's Power from the Wind, SecondEdition, New York, New York: Von Nostrand ReinholdCompany, Incorporated, pp. 10-16, 92 (1982).7. Chemical Week, 128, (19), pp. 76-79 (1981).8. EPRI Journal, "Going with the Wind," 5, (2), p. 11 (1980).9. Pepper, J. C., "Wind Development and the Pacific Gasand Electric Company," presentation to the AlternativeGeneration Technologies Conference, Long Beach California(March 1985).10. Eldridge, F. W., Wind Machines, Second Edition, NewYork, New York: Von Norstrand Reinfold Company, Incorported(1979).11. Batham, M., "Wind Energy as a Potential Electric SupplyComponent," California Energy Commission (March1985).12. Courtesy of U.S. Windpower, San Francisco, California(1985).
100PROCEEDINGS OF THE FOURTEENTH TURBOr..lACHINERY SYMPOSIUM