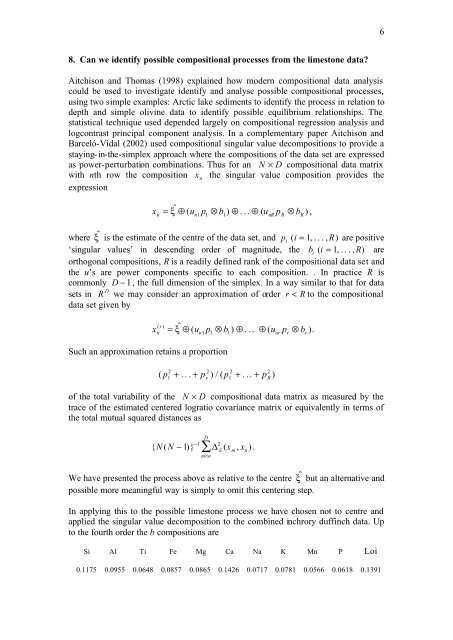
68. Can we identify possible compositional processes from the limestone data?<strong>Aitchison</strong> <strong>and</strong> <strong>Thomas</strong> (1998) explained how modern compositional data analysiscould be used to investigate identify <strong>and</strong> analyse possible compositional processes,using two simple examples: Arctic lake sediments to identify the process in relation todepth <strong>and</strong> simple olivine data to identify possible equilibrium relationships. Thestatistical technique used depended largely on compositional regression analysis <strong>and</strong>logcontrast principal component analysis. In a complementary paper <strong>Aitchison</strong> <strong>and</strong>Barceló-Vidal (2002) used compositional singular value decompositions to provide astaying-in-the-simplex approach where the compositions of the data set are expressedas power-perturbation combinations. Thus for an N × D compositional data matrixwith nth row the composition x nthe singular value composition provides theexpressionx = ξ$ ⊕ ( u1p1 ⊗ b1 ) ⊕ . .. ⊕ ( u p ⊗ b ) ,n n nR R Rwhere ξ $ is the estimate of the centre of the data set, <strong>and</strong> pi ( i = 1 , . . . , R)are positive‘singular values’ in descending order of magnitude, the bi ( i = 1 , . . . , R)areorthogonal compositions, R is a readily defined rank of the compositional data set <strong>and</strong>the u’s are power components specific to each composition. . In practice R iscommonly D − 1, the full dimension of the simplex. In a way similar to that for dataDsets in R we may consider an approximation of order r < R to the compositionaldata set given bySuch an approximation retains a proportionx ( r ) = $ ⊕ ( u p ⊗ b ) ⊕ . .. ⊕ ( u p ⊗ b ).nξn1 1 1nr r r2 2 2 2( p + .. . + p ) / ( p + . .. + p )1rof the total variability of the N × D compositional data matrix as measured by thetrace of the estimated centered logratio covariance matrix or equivalently in terms ofthe total mutual squared distances as−1 2{ N ( N − 1)} ∆ ( x , x ).D∑m
70.0675 0.0622 0.0788 0.0724 0.1254 0.1102 0.0560 0.0701 0.1460 0.0991 0.11230.0993 0.1111 0.1080 0.1028 0.0709 0.0807 0.0389 0.1190 0.0815 0.1076 0.08030.0674 0.0810 0.0899 0.0765 0.0422 0.1190 0.1011 0.0845 0.0899 0.1354 0.1132with successive degrees of approximation 0.46, 0.69, 0.84, 0.92.We note that in the first approximation the major relative increase is in Ca <strong>and</strong> to alesser extent Si. At the second approximation, both Mg <strong>and</strong> Ca show a relativeincrease <strong>and</strong> the increase in Mn seen earlier is also evident. At the thirdapproximation the main feature seems to be some relative depletion of Na, to arelative gain in K? And so on in a tentative interpretation.There are substantial statistical deficiencies in this area of compositional dataanalysis. For example at the various stages of approximation the near equality of asubset of components suggests that the corresponding subcomposition is stable forthat stage. But can we devise suitable statistical tests of such a subcompositionalstability hypothesis, Also although the singular value decomposition is identifyingorthogonal aspects of the process it may be that some other representation, say of thefirst two stages may provide a more enlightening view of the process. This would be arestructuring rather similar to the varimax technique in principal component analysis,but how should it be done compositionally? Again, suppose that the geologist suggestthat there may be two basic processes at work, possibly independently, a carbonate<strong>and</strong> a siliciclastic process. A possible method of modelling might then be to setx = $ ( u π ⊗ β ) ⊕ ( u π ⊗ β ) ⊕ p,n n1 1 1 n2 2 2where β1, β2are D-part compositions somehow representing carbonate <strong>and</strong>siliciclastic subcompositions, but how, π1, π2are parameters representing the extentof the carbonate <strong>and</strong> siliciclastic importance <strong>and</strong> requiring estimation, the ucoordinates again requiring to be determined <strong>and</strong> the p a composition, rather like theerror term in a regression analysis. It is obvious that there is much statistical researchremaining to be done in this important area of compositional data analysis. We arecurrently working in this area <strong>and</strong> will certainly report any new work atCODAWORK03.REFERENCES<strong>Aitchison</strong>, J., 1986, The Statistical Analysis of Compositional Data: Chapman <strong>and</strong>Hall, London. Reprinted in 2003 with additional material by The Blackburn Press.<strong>Aitchison</strong>, J., 1990, Relative variation diagrams for describing patterns of variabilityof compositional data: Math. Geology, v. 22, p. 487-512.<strong>Aitchison</strong>, J., 1997, The one-hour course in compositional data analysis orcompositional data analysis is easy, in Pawlowsky Glahn, V., ed., Proceedings of theThird Annual Conference of the International Association for Mathematical Geology:CIMNE, Barcelona, p. 3-35.


