You also want an ePaper? Increase the reach of your titles
YUMPU automatically turns print PDFs into web optimized ePapers that Google loves.
TABLE OF CONTENTSPageForeword................................................................................................................................ ivSECTION I1.0 LAND, PEOPLE AND CLIMATE................................................................................11.1 Location....................................................................................................................... 11.2 Area And Administrative Units............................................................................... 11.3 Climate ......................................................................................................................... 31.4 Vegetation................................................................................................................... 51.5 Demographic Characteristics ................................................................................... 61.6 Migration:.................................................................................................................. 181.7 Agro-Economic & Ecological Zones:................................................................... 191.8 Topography And Drainage System...................................................................... 24SECTION II2.0 THE REGION ECONOMY: ........................................................................................252.1 Introduction:............................................................................................................. 252.2 GDP and Per Capita GDP:........................................................................................ 272.3 Employment:............................................................................................................. 322.4 Agriculture ................................................................................................................ 352.4.1 Food and Cash Crop Production........................................................................ 352.4.4 Farm Implements:.................................................................................................. 472.4.6 Irrigation:................................................................................................................ 492.4.7 Food Adequacy:................................................................................................... 502.4.9 Livestock:............................................................................................................... 512.5 Natural Resources.................................................................................................... 562.5.1 Forestry:................................................................................................................. 562.5.2 Wildlife:.................................................................................................................. 602.5.3 Bee-Keeping:......................................................................................................... 602.5.4 Fishing Industry:................................................................................................... 612.5.6 Mining:................................................................................................................... 632.5.8 Industry Activities:............................................................................................... 65i
SECTION III3.0 ECONOMIC INFRASTRUCTURE: ..........................................................................683.1 Roads Network:........................................................................................................ 68Road Network Map- <strong>Ruvuma</strong> Region........................................................................ 703.2 Air Transport:........................................................................................................... 743.3 Marine Transport:.................................................................................................... 743.4 Communication Net Work: ..................................................................................... 743.5 Energy and Electricity:............................................................................................ 753.6 Alternative Sources of Power: ............................................................................... 76SECTION IV4.0 SOCIAL SERVICE SECTORS:................................................................................774.1 Education Sector:..................................................................................................... 774.1.1 Primary School Education:................................................................................... 774.1.2 Primary School Enrolment:................................................................................... 794.1.3 Education Facilities............................................................................................... 904.1.4 Secondary School Education.............................................................................. 934.1.5 Adult Education.................................................................................................... 964.1.6 Nursery Schools:................................................................................................... 994.2 HEALTH SECTOR...................................................................................................... 1004.2.1 Health Situation:.................................................................................................. 1004.2.2 Dispensaries ........................................................................................................ 1024.2.3 Health Centres:.................................................................................................... 1024.2.4 Hospital Services:............................................................................................... 1034.2.5 Life Expectancy at Birth ..................................................................................... 1064.2.6 Nutritional Status................................................................................................ 1074.2.7 Infant and Under Five Mortality Rates............................................................ 1094.2.8 Maternal Mortality Rate (MMR) ...................................................................... 1114.2.9 Immunization Coverage:..................................................................................... 1144.2.10 HIV - Infection and AIDS Disease:................................................................ 1164.3 WATER SECTOR..................................................................................................... 1164.3.1 Rural Water Supply ............................................................................................ 1174.3.2 Urban Water supply ........................................................................................... 118ii
SECTION V5.0 OTHER RELATED DEVELOPMENT ISSUES .................................................... 1255.1 Women In Development:...................................................................................... 1255.2 Youth In Development:......................................................................................... 1255.3 Cooperatives Development:................................................................................. 1265.4 Non Governmental Organizational Activities in the Region:......................... 1275.5 Investment Potential Sectors:.............................................................................. 1285.5.1 Agriculture:.......................................................................................................... 1285.5.2 Livestock:............................................................................................................. 1285.5.3 Natural Resources:.............................................................................................. 1295.5.4 Power Supply:...................................................................................................... 1295.5.5 Minerals:............................................................................................................... 1295.5.6 Industrial Activities:........................................................................................... 1305.5.7 Trade:.................................................................................................................... 130ANNEXESANNEX ASongea District Council: ............................................................................................. 115ANNEX BMbinga District Council:............................................................................................. 121ANNEX CTunduru District Council:........................................................................................... 129ANNEX DGENERAL INFORMATION ABOUT TANZANIA: ............................................. 135Area of Mainland <strong>Tanzania</strong> Area by Regions (Sq. Km):........................................ 135Population:.................................................................................................................... 136Land Use:...................................................................................................................... 137Arable Land:................................................................................................................. 137Lakes:............................................................................................................................. 137Mountain Summits (Metres Above Sea Level):...................................................... 137Climate:.......................................................................................................................... 138Social Services:............................................................................................................. 139National Parks:.............................................................................................................. 140iii
of high demand and a vital source of information to manypolicy makers, planners, researchers, donors and functionalmanagers.The Planning Commission has found it a worthwhile effort toextend the exercise to cover even more regions. Readers areinvited to make suggestions and constructive criticisms whichcan assist in improving the quality and effectiveness of futureProfiles.5. I would like to take this opportunity to acknowledge withthanks once again the financial support of the RoyalNorwegian Embassy which facilitated the preparation of the<strong>Ruvuma</strong> Region Socio-Economic Profile. I would also like tothank both the Planning Commission and <strong>Ruvuma</strong> RegionalPlanning Staff who put a lot of effort into ensuring thesuccessful completion of this task.Nassoro W. Malocho (MP)MINISTER OF STATEPLANNING AND PARASTATAL SECTOR REFORMDecember, 1997v
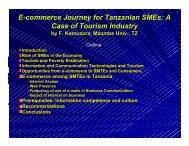
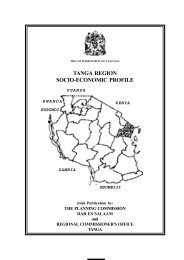
SECTION I1.0 LAND, PEOPLE AND CLIMATE1.1 LOCATION<strong>Ruvuma</strong> region is situated in the Southern part of the country. Theregion extends between latitudes 9 0 35' to 11 0 45' South ofEquator and longitudes 34 0 35' to 38 0 10' Meridian. <strong>Ruvuma</strong>Region borders the Republic of Mozambique in the South, LakeNyasa in the West and Iringa in the North-North East. It is alsobordered by Mtwara Region to the West.The lowlands in the Eastern part of the region are 300 metresabove sea-level while the Northern and Western parts ofLukumburu and Matengo mountains rise to the level of 2,000metres above sea level.1.2 AREA AND ADMINISTRATIVE UNITS<strong>Ruvuma</strong> region covers an area of 64,493 sq km. of which 54,839sq kms are arable land, 6,425 sq kms forests, and 29,79 sq kmsconsists of water surface. Administratively the region is dividedinto three 3 rural districts and one Township authority namely:-Mbinga, Songea Rural, Tunduru and Songea Urban. Table Ishows land coverage, number of divisions, wards and villages foreach district. It is observed in Table I that Songea Rural districtwith Land area of 33,825 Sq kms, equivalent to 52.4% of thetotal regional area is the largest district in the region followed byTunduru district.1
Fig. 2: Distribution of Area by District (Sq. Kms), <strong>Ruvuma</strong> Region, 199635000300002500020000150001000050000Songea (U) Mbinga Tunduru Songea (R)1.3 CLIMATE1.3.1 Temperature<strong>Ruvuma</strong> region has a mild temperature averaging 23 0 C.depending on altitude and season. The months of June, July andAugust are chilly with the temperatures dropping to 13 0 Cparticularly, within the areas surrounding Matengo Highlands inMbinga district. October and November are the hottest monthswith an average temperature of 30 0 C.1.3.2 RainfallExcept for bad years, the region experiences adequate rainfallannually. The rainfall pattern depicts one long season whichbegins in November and ends in May each year. The rainfallaverages between 800 mm and 1800 mm. The quantity of rainvaries from one district to another with Mbinga district recordingthe highest annual average rainfall of 1,225 mm. while Tunduru3
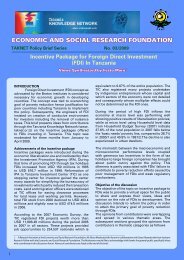
district gets the lowest rainfall which is normally less than 900mm per annum.1.3.3 HumidityThe mean humidity for <strong>Ruvuma</strong> region is relatively high especiallyduring the morning hours. The humidity is about 88 percentduring the day in the months of March while in the evening it maydrop down to 37 percent in the month of October as Table IIbelow depicts.TABLE II: AVERAGE TEMPERATURE AND RELATIVE HUMIDITY -SONGEA TOWN:MonthMaximum( 0 C)Climatic CategoryTemperature Humidity %Minimu ATm 9.00 a.m.( 0 C)AT3.00 p.m.RainfallJanuary 27.3 18.1 86 63 276.5February 27.3 18.2 87 63 220.3March 26.9 17.8 88 66 247.9April 26.0 17.1 87 64 115.7May 23.7 14.1 83 56 113.7June 24.6 11.6 78 50 0.7July 24.6 11.2 76 48 3.4August 27.0 12.1 71 44 0.4September 29.0 16.5 68 39 0.9October 29.0 16.5 67 37 7.8November 29.0 18.2 70 44 66.9December 28.0 18.0 82 58 211.5Average/Total 26.0 15.6 78.6 52.7 1265.7Source: Met. Department - Songea 1997.4
Fig. 3: Average Temperature (Max. ( 0 C) and Min. 0 C)) by Month, Songea Town302520151050MaximumMinimum1.4 VEGETATIONVegetation consists of woodland, bushland thicket and grasslands.The common vegetation in the arable land comprises plantedtrees, bamboos and shrubs. Miombo woodlands cover greaterpart of the region which includes some parts of Songea ruraldistrict, Tunduru and Mbinga. Areas surrounding MountMatogoro are covered by planted pines and eucalyptus trees.The typical trees found in the region fall under three speciesnamely, branchstegia, julbernardia and isoberlinia. The woodlands(Miombo) in the near past used to cover large area of <strong>Ruvuma</strong>region. However, much of the woodlands is currently beingdepleted through human activities such as firewood, timber,charcoal, tobacco curing and brick making. Consequently, the5
area covered by woodlands in the region is now declining. Thebushland is found in lower slopes. The occurrences of bushes area result of forest clearing, shifting cultivation, tobacco curing andtree cutting. The grasslands are generally common in lowlandsand plateau due to destructive human activities mentioned aboveas well as drainage and rainfall effects. The region should thrive toput in place an effective system for controlling wanton tree felling.1.5 DEMOGRAPHIC CHARACTERISTICS1.51 Ethnic GroupsThe main ethnic groups in <strong>Ruvuma</strong> region are Wamatengo,Wangoni, Wayao, Wanyasa, Wandendeule, Wamakua, Wapoto,Wamanda, Wanindi, Wamatambwe and Wabena. Wamatengoare the main ethnic group in Mbinga district, accounting for over60 percent of the district total population. The Wanyasa ,Wamanda and Wapoto reside along the shores of Lake Nyasatogether with a few Wangoni. Wangoni constitutes the majorethnic group in Songea Urban followed by Wandendeule,Wamanda, Wayao, Wamatengo and Wanyasa. Tunduru districthas Wayao as the main ethnic group. There are also within themWamakua, Wandendeule and Wamatambwe. In Songea ruraldistrict, Wangoni and Wandendeule residing in <strong>Ruvuma</strong> andNdendeule divisions are the predominant ethnic groups. Otherminor ethnic groups such as Wayao,Wabena and Wanindi occupyMuhukuru, Sasawala and Madaba divisions.1.5.2 The cultural AspectsTraditionally, the regional population is dominated by Wangoni,Wamatengo and Wayao who are basically cultivators.6
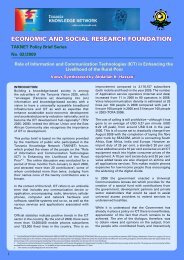
Subsistence crop cultivation is widely practised. Unlike mostregions in the country, livestock keeping is not a commoneconomic activity among various ethnic groups in the region.Shifting cultivation is widely practised in the region particularly inSongea and Tunduru Districts. Wamatengo in Mbinga district dopractice advanced cultivation method popularly known as"Ngoro". Maize for a long time has become the major food andcash crop in the region.1.5.3 Settlement patternLike in most other regions in the country settlement pattern wasdetermined by the Villagization Programme launched in 1973/74.Over 90% of the <strong>Ruvuma</strong> Region's population estimated at1,055,761 (1997) live in the existing 547 villages. Most of thevillages are located along the main roads or in areas which areaccessible by road. However, recently there have been atendency of few people going back to their old settlement. Onlyabout 5-8% of the population reside in the district headquarters,commonly known as "towns" or "trading centres".1.5.4 Population growth and distribution:Within <strong>Tanzania</strong>, <strong>Ruvuma</strong> is among the regions with smallpopulation and population density. The regional population hasincreased from 395,447 in 1967 to 783,327 in 1988, thus,doubling in two decades. As Table IV indicates the averageannual growth rate between 1978 and 1988 was 3.4%. Thisgrowth rate is higher than the national average of 2.8%. It isapparent that at this rate of growth, the regional population willdouble again in two decades. The rapid growth rate of thepopulation in the region could mainly be attributed to natural7
increase. The natural increase, is determined by high fertility rateand decline in death rate. The average household size in theregion is 5.3 which is higher than the national average of 5.2persons per family. The average household size has increasedover the years from 4.0 in (1967) to 5.3 in 1988 in line with theincrease in fertility rates. The fertility rate decreased from 8.7(1978) to 7.5 (1988) as Table IV indicates.TABLE IV: POPULATION, AVERAGE HOUSEHOLD SIZE, FERTILITY,GROWTH, AND CRUDE DEATH RATES IN RUVUMA REGIONYear Population1988AverageHouseholdFertilityRateAnnualGrowthCrudeDeath RatesizeRate1967 395,408 4.0 10.1 3.2 22.41978 564,113 5.2 8.7 3.2 20.71988 783,327 5.3 7.5 3.4 13.5Mainland<strong>Tanzania</strong>198823,174,336 5.2 6.7 2.8 14.7Source:Planning Commission Compiled Data Based on 1967,1978 and 1988 Census ReportFig. 4: Population Size for the Past Censuses, <strong>Ruvuma</strong> Region80000070000060000050000040000030000020000010000001967 1978 1988It is observed from Table V that the rate of population growthamong the rural districts of <strong>Ruvuma</strong> region is highest in Songea(3.4%) and lowest in Tunduru (2.3%).8
TABLE V: POPULATION SIZE AND GROWTH 1967-1997DistrictPopulation1967 1978 1988 1996EstimateAnnual Growthrate1967-78 1978-88Songea (U) 16,611 49,303 86,880 135,581 9.9 5.6Mbinga 144,059 196,167 271,845 349,582 2.8 3.2Tunduru 97,555 135,548 170,235 204,721 3.0 2.3Songea (R) 137,183 183,095 254,367 330,576 3.4Total 395,408 564,113 783,327 1,020,463.2 3.44Source: Population Census 1967, 1978 and 1988Fig. 5: Population Size by District (Population Censuses 1967,1978 and 1988), <strong>Ruvuma</strong> Region350000300000250000200000150000100000500000Songea (U) Mbinga Tunduru Songea (R)1967 1978 1988 1996 Estimate10
The rapid growth of the population in the region could also becaused by migration. It may be recalled that during the period ofLiberation War in 1960's and 1970's the region receivedsubstantial number of refugees from Mozambique. There havebeen also significant number of immigrants from the neighbouringregions.TABLE VI: POPULATION AND POPULATION GROWTH RATES FORIRINGA, MBEYA, RUVUMA AND RUKWA REGIONSRegion Population Census Population Growthrates1967 1978 1988 1967-78 1978-88Iringa 689,905 925,044 1,208,914 2.7 2.7Mbeya 753,765 1,079,864 1,476,199 3.3 3.1<strong>Ruvuma</strong> 395,447 561,575 783,327 3.2 3.4Rukwa 276,091 451,897 694,974 4.5 4.3Source: 1988 Population Census (Quoted in Iringa Region Socio-Economic Profile)Fig. 6 (a): Population Size for the Selected Regions, Iringa, Mbeya, <strong>Ruvuma</strong>and Rukwa in the Population Censuses 1967, 1978 and 1988.11
16000001400000120000010000008000006000004000002000000Iringa Mbeya <strong>Ruvuma</strong> Rukwa1967 1978 198812
Fig. 6 (b): Population Growth Rates for the Selected Regions, Iringa, Mbeya,<strong>Ruvuma</strong> and Rukwa from 1967-78 and 1978-884.54.03.53.02.52.01.51.00.50.0Iringa Mbeya <strong>Ruvuma</strong> Rukwa1967-78 1978-88Compared with other three regions, <strong>Ruvuma</strong> had the highestpopulation growth rate after Rukwa, (1978 and 1988 PopulationCensus results). However, Rukwa with the highest populationgrowth rate had the smallest population in all three census results(Iringa Region Socio-Economic Profile).1.5.5 Population Distribution by Sex:The 1988, Population Census revealed that the number ofwomen in the region outnumbered that of men by 5.1%. It isobserved from Table VII that household size is bigger in Songearural, followed by Tunduru, a rough indication of a highdependency ratio. A large number of people per household ispartly attributed to lack of knowledge in family planning and ofcourse the direct outcome of polygamy, and strong family tieswhich tend to bring people together.13
TABLE VII: POPULATION BY SEX AND HOUSEHOLD SIZEDistrictSongea(U)SexNumber ofHouseholds(1988)AverageHouseholdSizeMale Female Total42,734 44,146 86,880 18,379 4.7Mbinga 132,735 139,110 271,845 53,097 5.1Tunduru 81,788 88,447 170,235 31,806 5.3Songea( 124,181 130,186 254,367 43,592 5.8R)Total 381,438 401,889 783,327 146,874 5.3Source: 1988 Population censusFig. 7: Population Size by District and Sex, <strong>Ruvuma</strong> Region, 1988 Census.140,000120,000100,00080,00060,00040,00020,0000Songea (U) Mbinga Tunduru Songea(R)MaleFemale1.5.6 Population DensityAs Tables VIII indicate that <strong>Ruvuma</strong> Region is among the leastpopulous and sparsely populated regions in the country. Thepopulation density increased from 6 persons per sq km in 1978 to14
8 people per sq km in 1988. Currently (1997), the averagepopulation density is estimated at 16 persons/sq km. Thispopulation density is lower than the national density of 26 personsper sq km. Other regions which are sparsely populated include:Kigoma, Iringa, Arusha, Rukwa, Lindi, Tabora, Coast, Singidaand Morogoro.TABLE VIII: POPULATION DISTRIBUTION AND DENSITY BY EGION 1988Density per sq KmREGION LAND AREAKM2POPULATION1988 1978 1978Dar es Salaam 1393 1360850 976.0 270 843Mwanza 19683 1876776 95.8 52 72Kilimanjaro 13309 1108699 83.7 50 69Mtwara 16710 887583 53.2 35 45Tanga 26677 1280262 48.1 28 38Kagera 28456 1313639 46.6 32 36Mara 21760 952616 43.7 27 36Shinyanga 50760 1763960 34.9 17 25Dodoma 41311 1235277 30.0 17 23Mbeya 60350 1476261 24.0 12 18Kigoma 37040 853263 23.1 11 17Iringa 56850 1193074 21.3 12 16Arusha 82098 1352225 16.5 7 11Rukwa 68635 704050 10.1 4 6Lindi 66040 642364 9.8 6 8Tabora 76151 1036293 14.0 4 6Pwani 32407 638015 20.0 15 16Singida 49341 791814 16.0 9 12Morogoro 70799 1222737 17.0 9 13<strong>Ruvuma</strong> 66477 783327 12.0 6 8TOTALMAINLANDTANZANIA885987 23174443 26.1 12 19Source:1988 Population Census - National Profile15
Fig. 8: Population of <strong>Ruvuma</strong> Region as aPercent of Total Mainland Population, 1988<strong>Ruvuma</strong>Region3%TotalMainland<strong>Tanzania</strong>97%1.5.7 Distribution of People by Sex and Age Group:The population of <strong>Ruvuma</strong> is characterized by a significantproportion of the young men. Table IX indicates that theproportion of children under 15 years is 43.7% (an averagenumber of females and males) compared with 51.8% of the activeage group (15-64 years) and 4.5% of the old age (65 years andabove). This age distribution suggests rather high dependenceratio. About 48.2% of the total population according to the 1988population census are dependants. About 52 percent of thepopulation are women and 48 are men. High dependence ratiomeans more mouths to feed and this may not match with the rateof food production.16
TABLE IX: PERCENTAGE DISTRIBUTION OF POPULATION BY SEXAND AGE GROUPS 1988District Sex Age Groups0-14 15-64 65 and OverSongea (U) Male 41.1 57.4 1.5Female 40.5 57.1 2.4Total 40.8 57.2 2.0Mbinga Male 47.1 48.8 4.1Female 44.7 51.7 3.6Total 45.9 50.3 3.8Tunduru Male 46.8 47.7 5.5Female 42.7 53.1 4.2Total 44.7 50.5 4.8Songea (R) Male 48.2 47.3 4.5Female 45.1 50.9 4.0Total 46.6 49.1 4.7RegionMale 46.8 47.7 5.5TotalFemale 42.7 53.1 4.2Total 44.7 50.5 4.8Source: Population census Regional ProfileTABLE X:1997DistrictPOPULATION DISTRIBUTION AND DENSITY BY DISTRICTLand areaSq KmPopulation Population Density per Km 21978 1988 1997Estimates1978 1988 1997EstimatesSongea (U) 394 49,303 86,880 117,391 125.1 220.5 297.9Mbinga 11,396 196,167 271,845 365,814 17.21 23.85 32.1Tunduru 18,778 135,548 170,235 228,488 7.22 9.10 12.2Songea (R) 33,925 183,095 254,367 341,980 5.40 7.50 10.10Total 64,493 564,113 783,327 1,053,673 8.75 12.15 16.3Source: Region Planning 1997 - Population Census 1988TABLE XI: RELATIVE DISTRIBUTION OF RURAL AND URBANPOPULATION BY DISTRICTTotal Distribution Percentage (%)District Population 198817
Songea(U)DistrictPopulationRegionPopulationUrban Rural Urban Rural UrbanRural86,880 50,892 35,988 59 41 51 5Mbinga 271,345 6,332 265,513 2 98 6 39Tunduru 170,235 21,603 148,632 13 87 22 22Songea (R) 254,367 20,210 234,157 8 92 21 34Total 783,327 99,037 684,290 13 87 100 100Source: Planning Commission Analysis Based on 1988 Population CensusAlthough, <strong>Ruvuma</strong> region is being categorized as one of the mostsparsely populated regions in the country it is however, worthnoting that the population is unevenly distributed. The highlands inMbinga district and areas along the shores of lake Nyasa are themost populated with an estimated average of 60 persons per sqkm. At district level, Mbinga is the most populated with 32persons per sq km. Nevertheless, a good part of the region is stilluninhabited due to tsetse fly infestation.1.6 MIGRATION:Migration in the region is still very low and has so far not posed aserious phenomenon. It occurs mainly in response to foodshortages, drought, war (especially in the past), and inadequatesocio-economic facilities. Main migration is noticeable amongyouths who move from rural areas to urban centres such asSongea town, mining sites in Tunduru district and other districtheadquarters in search of employment opportunities and businessopportunities.During the past three decades the region had experienced an influxof people from outside the region. That is, there has been a netpopulation gain due to migration into the region following goodsocial-economic conditions obtainable in the region. Table XII18
indicates the region population net migration between 1967 and1988.TABLE XII: REGIONAL POPULATION NET MIGRATION 1967 - 1988:Year Population Annual GrowthRate(%)Rate of NaturalIncreaseNet Migration1967 395,408 3.0 2.7 +031978 564,113 3.2 2.7 +051988 783,327 3.4 2.7 +07Source: Planning Commission: Compiled data1.7 Agro-Economic & Ecological Zones:The Agro-economic and Ecological zones in <strong>Ruvuma</strong> region areseveral, and were defined in 1971 by a team of experts fromBRALUP. The agro-economic zone can be defined as part of aregion or district in which agricultural conditions are sufficientlysimilar to warrant adoption of a single agricultural policy at thedistrict or regional level. Some characteristics of the zone maychange with time like population density, types of technologyadopted and crops grown in one zone, and the farming systems.It is therefore, alluded here that the definition of a zone should notbe static, as the zones may be reviewed from time to time. TheAgro-economic Zones in <strong>Ruvuma</strong> region varies greatly in terms oflocation, altitude, rainfall, temperature, topography, and types ofsoils, crops grown and animals kept as detailed in the subsequentparagraphs and in the summary table III. The environmental andclimatic conditions dictate the type of economic activity within azone for example fishing, honey collection, and Livestock keeping.Table III: AGRO-ECONOMIC ZONES FOR RUVUMAREGION:ZONEGENERAL MORPHOLOGYAND TOPOGRAPHYECONOMIC ACTIVITIES19
The MatengoHighlands:The Zone coversLongiro Litemboand Ndengu,WesternMyangayanga andparts of SouthernKigonsera andMperamba.Lower Matengo:Area covered isTingi division, mostof Liperamba andEastern parts ofMyangayanga andKigonsera.Ruhuhu Valley:The zone bordersNjombe District andincludes Ruandadivision and thenorthwestern part ofKigonsera.Altitude: Hilly highland Altituderange at 200m. maximum.Rrainfall: Average annualrainfall is between 1200 - 1400mm.Soils: Dark brown to reddishbrown clay loams and clay sandyloams.Vegetation: Wooded grasslands.Population: Medium 30-49persons per Km 2 .Altitude: Very Hilly areaAltitude range between 800 -1500m.Rainfall: Average annualrainfall 1100 - 1300 mm.Soils: Deep, dark reddish brownto red sandy clay loams.Vegetation: Woodland.Population: Very low. Densityunder 15 person per Km 2 .Altitude: Very hilly and steeplydissected land.Rainfall: Extremely dry.Average annual rainfall is between900 - 1100 mm.Soils: Greyish brown loamysands and reddish brown clayloams.Vegetation: Woodland.Population: Very lowpopulation Density under 15person per Km 2 . There is highout migration from the area.Agriculture: Intensivecultivation popularly known asNgoro system is practiced.Crops: Coffee, maize, wheatsunflower, benas, and Irishpotatoes.Livestock: Cattle, goats,poultry, pigs, and sheep.Soil Conservation: Terracing,ridging mulching, crop rotationand interplanting.Agriculture: Mainly cultivationof crops.Crops: Tobacco, maize, cassava,beans, sesame and fingermillet.Livestock: Fewer cattle, goats,sheep, pig and poultry. Honeycollection is also important.Soil conservation: Donethrough shifting cultivation,interplanting, ridging mulch anduse of manure. Chemical fertilizerused sometimes.Agriculture: Much of the areais unsuitable for cultivation.Crops: Cassava, Pulses, Millet,tobacco, groundnuts and sesame.Livestock: Goats and Sheep.Soil Conservation: The mainmeans are fallow, shiftingcultivation interplanting andridging. Few people use chemicalfertilizers & insecticides.20
Lake Shore:This is a narrowzone bordering LakeNyasa, an area ofapproximately 1700Km 2 , 12 Km long by10 km wide alongnorth eastern shoreof Lake Nyasa. Itincludes almost all ofRuhekei division. Itis bounded on theeast by theLivingstonemountains.Mitomoni: Altitude:This is a very smallzone in the extremesouth east of Mbinga Rainfall:district, comprisingthe south easternpart of Liperambadivision.Ubena Highlands: Altitude:The zone is locatedin the extreme northof Songea district Rainfall:bordering Njombe.Altitude: Flood plains areabounded by mountainous land.Altitude rises from 500m. at theedge of Lake Nyasa to 600 metresin the foot hills of theLivingstone Mountains.Rainfall: Varies between100mm in the north to over1400mm south. The yearlyminimum rainfall is between 600 -1000mm.Soils: Very dark grey silts andclay with dark brown sands andloams with low fertility andpoorly drained.Vegetation: Mainly grass landand woodland on the higherland.Population: Medium 30 - 49person per Km 2 .Rolling low lying area.Altitude range between 600 -1500 m.Average annual rainfallis 1100 - 1300 mm.Dark reddish brown loam.Population: Density extremelylow, under 15 person per Km 2 .Hilly area with steeplydissected escarpment. Altituderaising to about 1500 m.Average annual rainfall1100 - 1400 mm.Well drained soil with dark reddishbrown loams.Vegetation: Dominantlygrassland.Population: Density very low,under 15 persons per Km 2 .Agriculture: Cultivation ofcrops.Crops: Cassava (stapple food)groundnuts, beans, groundnut,paddy, coconuts, maize, sorghum,some bananas, fruits and oilpalms.Livestock: Cattle, goats, sheep,pigs and poultry.Soil Conservation: Mouldridging, fallow, and interplantingare main methods.Crop cultivation.Cassava, paddy, pulses andcashewnuts.Negligible except poultry.There is fishing carried in <strong>Ruvuma</strong>river.Cultivation of cash and foodcrops.Maize, beans, Irish and sweetpotatoes, pigeon peas, sunflower,bananas, and coffee as cash crop.Livestock: Cattle, goats, sheepand poultry. Honey collectionimportant.Soil Conservation:Interplanting crop relation ridgingfallow mulching and use ofmanure.21
Western Songea:The zone extendsfrom the Mbingaborder to just east ofSongea town andincludes Northern<strong>Ruvuma</strong> division andparts of Msindo andWabaki divisions.Central Songea:The zone covers thearea east of Songeatown, includingLuegu division andadjoining parts ofMsindo, LigeraWabaki, Likuyu andNamtumbo division.Undendeule:The zone lies to theNorth of WesternSongea, and CentralSongea zone and itincludes northernpart of Undendeuledivision and much ofHanga divisionSouthern Songea:The zone covers thewhole of the southof the district fromthe Mbinga border tothe Tunduru border.It includes parts of<strong>Ruvuma</strong> Sasawalaand Undendeuledivision.Altitude: Fairly hilly area withundulating lower areas.Rainfall: The average animalrainfall is 1000 - 2000 mm.Soils: Dark reddish brown tored sandy clay loams and clayloams.Vegetation: Mainly Woodland.Population: Population densityvary from medium (30 - 49person per Km 2 ) near Songeatown and the Mbinga road to verylow in the south.Resembles zone 7 in terms ofaltitude, climate, soils, andvegetation. Only that thepopulation density varies fromlow (15 - 29 persons per Km 2 ) inthe central part along the mainroad to very low (under 15 personper Km 2 ) in the extreme northand south than is the case in theformer zone.Attitude: Very hilly area. Muchof the zone rugged and dissectedby narrow valley.Rainfall: The average annualrainfall is 900-1100mmSoils: Greyish brown loamy sandssome what darker in colour in theWestern part of the zone than inthe eastVegetation: Mainly woodlandPopulation: Extremely low,under 15 person per km 2Altitude: Rolling terrain areaRainfall: Average annual rainfallrange between 1100-1300mmSoils: Dark greyish brown toreddish loamy sandsVegetation: Mainly woodlandPopulation: Very low under 15person per km 2 especially in theWest. The zone is isolated.Agriculture: Crop cultivation.Crops: Maize, beans, paddy,cassava, groundnuts, fingermillet,sweat potatoes, peas and tobacco.Livestock: Cattle, goats, sheepand poultry.Honey collection: Is ofconsiderable importance in theZone.Agriculture: Same as in Zone 7.Crops: The main difference isthat tobacco replaces rice as themain cash crop.Livestock: More cattle arereared than goats.Agriculture: This zone is toorugged for cultivation.Crops: Tobacco, sesame, maize,rice, beans, cassava and fingermillet.Livestock: Few cattle because oftsetse fly infection.Honey: Honey collections fairlyan important economic activity.Agriculture: Main stay for thepeople in the areaCrops: Cashewnuts, Tobacco andSesame, maize, cassava, paddy,beans and groundnuts.Livestock: Negligible because oftsetse fly.Soil conservation: Is done throughinterplanting and leaving the landfallow.22
Matemanga:The zone covers thenorth-western partof the Tundurudistrict and includesalmost all ofMatemanga divisionSouthernTunduru:This zone covers thewhole of thesouthern part ofTunduru districtincluding thedivision ofLukumbule Nalasi,Namasakata,Nampungu andWestern MlingotiNakapanya:This is a small zonein the eastern partof Tunduru districtbordering Masasidistrict. It coversthat part of Mlingotidivision east ofNakapanya village.Altitude: Very hilly areadissected by narrow ValleysRainfall: The average annualrainfall is 900-1000mmSoils: Dark greyish brown toreddish brown loamy sandsVegetation: Predominantlywoodland.Population: Very low under 15person per km 2Altitude: An undulating orRolling area with some hillsRainfall: The average annualrainfall is 1000-1100mmSoils: Deep dark brown to darkreddish brown loamy sands andsandy loamVegetation: WoodlandPopulation: Density is higherthan other area in the district.Denstry is under 15 per personper km 2Altitude: An undulating plainarea broken by numerousinterbergs and rock out crops.Rainfall: Average annual rainfallrange between 900-1100mmSoils: Deep-dark brown to darkreddish brown loamy sands andsandy loamsVegetation: Mainly woodlandarea.Population: Very lowpopulation density under 15person per km 2 . due to tsetse flypresence.Agriculture: The zone is toorugged for cultivationCrops: Tobacco, sesame, maize,beans, sorghum and paddy.Livestock: Animal husbandry isof little importance due to tsetsefly infection only poultry arekept.Agriculture: Crop farming.Crops: Cashewnuts, Groundnuts,sesame, maize, and cassava.Livestock: Less important.Only poultry is undertaking bymost household.Fishing: Some fishing in <strong>Ruvuma</strong>river is done.Soil Conservation: Donethrough fallow, shifting andinterplantingAgriculture: Crop cultivation.Crops: Cashewnuts, sesame,groundnuts, maize, cassava, beanssorghum and little tobaccoLivestock: Very negligible exceptpoultrySoil conservation:The main means are fallow andinterplanting. Artificial fertilizerare occasionally used.23
1.8 TOPOGRAPHY AND DRAINAGE SYSTEM1.8.1 TOPOGRAPHY:The region lies in the Southern Highlands which rise from 300metres to 2000 metres above sea level. The western part of theregion is covered by Lake Nyasa which lies within the Westernarm of the Rift Valley. To the East of the Rift Valley there areMatengo Mountains ranges which rise up to 2000m. Similarly,towards the North there are Lukumburu Mountains whoseelevation rises up to 2000 metres above sea level. South of theregion runs through the lower plains which are dissected by<strong>Ruvuma</strong> River.1.8.2 DRAINAGE SYSTEMApart from being a natural boundary between the United Republicof <strong>Tanzania</strong> and Mozambique, <strong>Ruvuma</strong> River is also an importantriver in the Southern part drainage system. <strong>Ruvuma</strong> river drainsinto the Indian Ocean and it is constituted by several perennialtributaries such as Njuga, Likonde, Ngembambili and Lukimwa.Other rivers include Luegu, Mbarangandu, Lukukira - <strong>Ruvuma</strong>together with Ruhuhu and other many small streams also form themajor drainage system for the region.24
SECTION II2.0 THE REGION ECONOMY:2.1 INTRODUCTION:<strong>Ruvuma</strong> Region is mainly an agrarian region with over 87 percentof its population residing in rural areas and actively engaged in landbased production. The regional major economic activities areagricultural farming, livestock keeping, lumbering, fishing,beekeeping, mining and trade. Agriculture is the mainstay andleading productive sector accounting for a larger part of theregional GDP and per capita income. Livestock ownership is notwide spread through out the region due to diseases and highmortality rate. Farming especially crop production is undertakenby individual small-scale farmers. The main food crops in theregion are maize, cassava, paddy, sweet potatoes, legumes, milletsand sorghum, while coffee, tobacco, cashewnuts are major cashcrops. Other crops are sunflower, soya beans, simsim, fingermillet and groundnuts.There is high potential for natural resources development in<strong>Ruvuma</strong> region. There are about 21,334 sq.km. of forests inSongea district 2,526 sq km in Mbinga district, 46.10 sq km inSongea urban and 2,365 sq. km. of land for game reserve inTunduru district. Tourism, beekeeping, fishery and lumbering areamong important subsectors in the region not yet fully exploited.The region has very few industries therefore industrial productionand commerce is still nascent and contribute very little to theregional income. Mining is in small scale. There is gold mining atMpepo, Liparamba and Mipotopoto in Mbinga district and25
Tunduru district is famous for gemstone mining which includealexandrite, surphire, tormalin etc.TABLE XIII: CONTRIBUTION OF EACH SECTOR TO THE REGIONALECONOMY 1996:Sector Output in Tshs. Mill. Percent of ContributionAgriculture 45,489.6 75Livestock 1,213.1 2Natural Forest 3,032.6 5Industries 1,819.6 3Mining 2,426.1 4Trade 4,852.2 8Others 1,819.6 3Total 60,652.8 100Source: <strong>Ruvuma</strong> Regional Annual Report 1997.Fig. 9:Output Contribution inTShs. (Mill.) of Each Sector to theRegional Economy 1996.50000450004000035000300002500020000150001000050000AgricultureLivestockNaturalForestIndustriesMiningTradeOthers26
2.2 GDP AND PER CAPITA GDP:Regional GDP in 1997 is estimated to be Tshs 60,691,564,800/=while the per capita GDP is estimated at Tshs 57,600 (US $ 95)per annum. The per capita of 57,600/= per annum is relativelysmall and could explain better why <strong>Ruvuma</strong> region becomes oneof the poor regions in the country and why it experiences frequentmalnutritional problems and other social problems particularly,poor housing, clothing water services, etc. It is observed fromTable XIV that although, the per capita GDP of <strong>Ruvuma</strong> region atcurrent prices increased in absolute terms from T.shs. 52537/= in1994, the purchasing power of a shilling weakened in dollar termsfrom US $ 234 in 1980 to only US $ 95 in 1994. This means thatthe people in <strong>Ruvuma</strong> region in 1994 were about two timespoorer than what they were in 1980.27
TABLE XIV:GDP atTHE GDP AND PER CAPITA GDP OF RUVUMA REGION ATCURRENT PRICES AND PERCENTAGE CHANGES 1980 - 1994:Per Capita GDP at Current Prices in Tshs and US DollarsGDP atCurrent%CurrentYearPricesChangPrices as %in Tshseof NationalMillionGDPValue%ExchangeValue%in TshsChangRatein US$Changee1980 1155 - 1924 - 8.22 234 - 31981 1480 28.14 2384 23.91 8.35 286 22.22 31982 1253 -15.34 1952 -18.12 9.52 205 -28.32 21983 2089 66.72 3147 61.22 12.46 253 23.41 31984 2508 20.06 3655 16.14 18.11 202 -20.16 31985 3329 32.74 4691 28.34 16.50 284 40.59 31986 3886 16.73 5296 12.90 51.72 102 -64.08 31987 9163 135.80 12077 128.04 83.72 144 41.18 51988 17210 87.82 22023 82.35 125.00 176 22.22 51989 27412 59.28 34109 54.88 192.00 178 1.14 51990 18063 -34.11 21856 -35.92 197.00 111 -37.64 31991 22909 26.83 26954 23.33 234.00 115 3.60 31992 29567 29.06 33828 25.50 335.00 101 -12.17 31993 38638 30.68 42985 27.07 480.00 90 -10.89 31994 48565 25.69 52537 22.22 553.00 95 5.59 3Averag15149 34.01 17961 30.12 - 172 -13.34 3.3eSource: National Accounts 1976 - 1994 August, 1995.28
Fig. 10: The GDP and Per Capita GDP of <strong>Ruvuma</strong> Region atCurrent Prices 1980 - 19946000050000400003000020000100000198019811982198319841985198619871988198919901991199219931994GDP at Current Prices in Tshs MillionPer Capita GDP Value in TshsTABLE XV:RegionDar-es-SalaamREGIONAL ANNUAL AVERAGE CONTRIBUTION TOTHE NATIONAL GDP, 1980 - 1994:GDP (in Average Annual Ranking in Terms ofTshs.) 1994 Contribution (%)Contribution316,541,000 20.3 1Arusha 145,192,000 7.8 2Mwanza 107,553,000 7.7 3Mbeya 84,903,000 6.0 4Shinyanga 110,353,000 5.8 5Iringa 92,021,000 5.1 6Tanga 92,821,000 5.5 729
Morogoro 88,073,000 4.7 8Kagera 80,537,000 4.6 9Kilimanjaro 72,898,000 3.7 10Mara 50,127,000 3.5 11Tabora 55,012,000 3.4 12<strong>Ruvuma</strong> 48,565,000 3.3 13Mtwara 62,491,000 3.27 14Rukwa 66,160,000 3.1 15Dodoma 57,856,000 3.07 16Singida 51,995,000 2.9 17Kigoma 30,545,000 2.5 18Lindi 29,253,000 2.0 19Coast 17,033,000 1.0 20.Source: National Accounts 1976 - 1994, August, 1995.According to table XV above, <strong>Ruvuma</strong> region takes thethirteenth position in terms of annual average GDP contributionto the National GDP. It's contribution was just 3.33 percent forthe last 15 years (1980-1994). Measured against other MaizeSurplus Regions (Mbeya, Iringa and Rukwa), <strong>Ruvuma</strong>'scontribution is just slightly above that of Rukwa region and fallsbelow percentage contributions made by both Mbeya andIringa.30
TABLE XVI:YearPER CAPITA GDP FOR RUVUMA REGION COMPAREDWITH OTHER NEIGHBOURING REGIONS 1980 - 1994:ExchangeRate <strong>Ruvuma</strong> Iringa MbeyaTshs.USADollarsTshs.USADollarsTshs.USADollars1980 8.22 1924 234 1801 219 1838 2241981 8.35 2384 286 2325 278 2412 2891982 9.52 1952 205 2868 301 3055 3211983 12.46 3147 253 3131 251 3277 2631984 18.11 3655 202 3975 219 4437 2451985 16.50 4691 284 5204 315 5911 3581986 51.72 5296 102 6789 131 7517 1451987 83.72 12077 144 9390 112 5681 681988 125.00 22023 176 17010 136 9874 791989 192.00 34109 178 26339 137 15507 811990 197.00 21856 111 28144 143 21174 1071991 234.00 26954 115 34812 149 26374 1131992 335.00 33828 101 42028 125 31685 951993 480.00 42985 90 51659 108 38904 811994 553.00 52537 95 64502 117 59390 107Average- 17961 172 19999 183 15801 172Source: National Accounts 1976 - 1994, August, 1995.Fig. 11: Per Capita GDP for <strong>Ruvuma</strong>Neighbouring Regions 1980 -1994Region Compared with Other7000060000<strong>Ruvuma</strong> Iringa Mbeya5000040000300002000010000019801981198219831984198519861987198819891990199119921993199431
Table XVI compares the per capita GDP for three neighbouringregions and what comes out clearly is that <strong>Ruvuma</strong> region in1980 had the highest per capita GDP. However, as seen fromthe table, <strong>Ruvuma</strong> could not sustain its per capita GDP lead insubsequent years. Thus, by 1994 it had the lowest per capitaGDP compared with Mbeya and Iringa.2.3 EMPLOYMENT:In terms of employment opportunities a large part of economicactive population in <strong>Ruvuma</strong> region engages in farming (mixed).The remaining portion is employed in public and private sectorssuch as trade, carpentry, mansonary, shoe making, bicyclerepair, black smithery etc. Table XVII (a) and XVII (b) showthe participation of males and females population (10 years andabove) in the regional economy. Table XVII (c) shows thedistribution of working population (10 years and above) by mainoccupation, while table XVII (d) depicts the unemployment rateby age group as reported in the 1988 population census. It isseen from table XVII (d) that there is a high unemployment rateamong male youths, between 15 and 25 years of age comparedwith the females' unemployment rate. Unemployment problemof the males is said to be caused by their tendency to preferwhite coller jobs, which unfortunately are not readily available ortheir education levels are too low for the jobs. Unlike the males,the majority of the females content themselves with the housework activities.32
TABLE XVII (a): PERCENTAGE OF MALE PARTICIPATION IN THEREGION'S ECONOMY:Age GroupMalePopulationPercentage ofEconomic ActivePopulationWorkingorWorkedLooking forWorkPercentage of Not Economic Active PopulationHouseholdWorkersStudentsUnable toWorkOthers10-14 49655 8.2 0.3 5.9 76.8 1.3 7.615-19 42177 63.4 1.9 3.3 29.1 0.7 1.520-24 27755 91.1 1.7 2.6 3.1 0.8 0.625-29 25072 96.7 0.7 1.1 0.4 0.5 0.430-34 18134 98.2 0.1 0.6 0.1 0.5 0.435-39 16350 98.3 0.2 0.5 0.1 0.6 0.240-44 11300 97.7 0.2 1.1 0.03 0.8 0.145-Over 50202 87.5 0.01 0.7 0.0 2.8 8.8Not Stated 143 32.8 0.0 0.0 15.4 0.0 43.0TotalPopulation241588 70.4 0.7 2.5 21.3 1.2 3.8Source: 1988 Population Census.Fig. 12: Percentage of Male and Female Participation in <strong>Ruvuma</strong>Region by Age Group, 1988 Population Census.100908070605040302010010-14 15-19 20-24 25-29 30-34 35-39 40-44 45-OverMale Working or WorkedFemale Working or Worked33
TABLE XVII (b): PERCENTAGE OF FEMALE PARTICIPATION IN THEREGION'S ECONOMY:AgeGroupPopulationPercentage of EconomicActive PopulationWorkingorWorkedLookingfor WorkPercentage of Not Economic Active PopulationHouseholdWorkersStudentsUnable toWorkOthers10-14 48056 8.3 0.2 5.3 0.2 0.9 5.015-19 42196 67.9 0.9 6.9 23.1 0.4 0.720-24 33799 91.1 0.5 5.9 1.2 0.6 0.224-29 30674 93.9 0.01 5.1 0.2 0.3 0.330-34 21945 94.6 0.02 4.3 0.1 0.8 0.135-39 19288 95.9 0.01 3.1 0.03 0.6 0.140-44 13773 95.8 0.01 2.9 0.05 0.8 0.345 Over 53039 76.8 0.01 2.6 0.06 5.4 14.9Not280 21.7 0.0 0.3 11.8 8.9 8.2StatedTotalPopulation263050 70.6 0.3 4.7 18.6 1.6 4.2Source:1988 Population Census.TABLE XVII (c): WORKING POPULATION (10 YEARS AND ABOVE) BYMAIN OCCUPATIONS:Main OccupationLegislators,Managers, andAdministratorsProfessional Teacherand TechniciansTotalPopulation% ofTotal34DistributionMales Females Rural Urban1,041 0.2 943 656 3859,561 1.9 6,945 2,616 6,313 3,248Clerks 1,872 0.4 1,102 770 597 1,275Services and4,113 0.8 2,624 1,489 1,927 2,186ShopkeepingFarmers 324,680 64.3 146,259 178,421 299,971 24,709Mixed Farming 1,800 0.3 1,485 315 1,565 235Agricultural Workers 703 0.1 563 140 418 285Graft Men and4,086 0.8 3,912 174 1,627 24,559Machine OperatorsSmall Scale Traders5,658 1.1 4,655 1,003 1,629 4,029and LabourersNot Employed 148,252 29.4 71,234 77,018 123,238 25,014Other Workers 1,869 0.4 1,344 505 1,072 797Not Stated 971 0.2 506 425 866 105Total 504,606 100 241,572 465 439,879 64,727
Source:1988 Population Census.TABLE XVII (d): UNEMPLOYMENT RATE (10 YEARS AND ABOVE) BYAGE AND SEXAge GroupTotalMalesLookingfor WorkUsually Economically Active PopulationUnemployment RateTotalFemalesLookingfor WorkUnemployment Rate10-14 49,655 160 0.3 48,056 109 0.215-19 42,177 793 1.9 42,196 402 0.920-24 27,755 484 1.7 33,799 183 0.525-29 25,872 187 0.7 30,674 43 0.130-34 18,134 24 0.1 21,945 5 0.0235-39 16,350 33 0.2 19,288 2 0.0140-44 11,300 19 0.2 13,773 1 0.0145-Over 50,202 20 0.04 53,039 9 0.02Not Stated 143 0 0 280 0 0Source: 1988 Population Census.2.4 AGRICULTURE2.4.1 Food And Cash Crop ProductionAgriculture is the main economic activity contribution over 75percent of the Regional Gross Domestice Product. <strong>Ruvuma</strong>Region is among the Big Four regions as far as maize productionis concerned in the country. The three other regions are Iringa,Mbeya and Rukwa. The “Green Revolution in maize production inthe region began in the past two and half decades followingseveral efforts in previous years by the Regional Authority todevelop the economy through modernization of the agriculturalsector. Before the “Green Revolution” the region depended on the35
production of cassava, beans, seet potatoes and finger millets asmajor food crops. However, the intensive use of fertilizers in maizeproduction has resulted into the depletion of soil nutrients and insome areas it has caused environmental degradation. The effectsof intensive use of fertilizers manifest themselves in low maizeproduction as depicted in Table XIX. To avoid further the effectsof fertilizers on soil nutrients the people have began using fertilizerswhich reduce the concentration of soil acidity and at the same timerestores soil nutrients. Thus, the experts have recommended theuse of UREA, NPK and CAN in <strong>Ruvuma</strong> Region. Nevertheless,the problem of soil fertility being experienced by many people inthe region could be reduced if the people looked back andadopted the “Marejea” plant technology introduced in earlysixtees. According to the research done by both the priests ofPeramiho Catholic Church and Agricultural Institution, “Marejea”plant has been found to be capable of conserving soil nutrienbts orrestorung them once depleted. In addition, it is a cheaptechnology. It improves soil fertility through natural nitrogenfixation process. Although, “Marejea” technology has been triedin <strong>Ruvuma</strong> since early sixtees, its applicatuion has continued to beminimal. At most it has been applied in Namanguli in Mkongodivision, Litisha and Morogoro villages in<strong>Ruvuma</strong> division,Mpituimbi village in Malukuru division and in Peramiho A andPeramiho B villages.In the light of difficulties involved in securing modern farm inputs,high fertilizer prices and a fall in maize production, one would haveexpected many people taking interest in the adoption of“Marejea” plant technology but this has not been the case. Forpeople to take advantage of cheap and appropriate “Marejea”technol;ogy in farming, the government and the Regional Authorityin particulars should promote and populize the use of it.36
The regions major cash crops includes, coffee, tobacco andcashewnuts. Coffee is chiefly grown in Mbinga district andaccount for a higher percentage in the districts GDP and makesthe district one of the districts with high per capita income in thecountry. Tobacco is a major cash crop in Songea district followedby maize which serves both as food as cash crop. The fire curedtobacco grown in Songea is significant for its good quality andgood price in the world market. Over the recent years, productionof tobacco has been increasing steadily due to high demand for thecrop, and production yields are expected to double following thepolicy of trade liberalization on the marketing of the crop. Tundurudistrict is famous for cashewnuts production despite low yielscaused by “Milddaw Disease” However, the district Authority iscurrently undertaking a programme intended to improve the qualityof cashew trees and hence increase production. Table XVIIIbelow shows the production of food and cash crops in 1995/96season.TABLE XVIII: CROP PRODUCTION IN 1995/96:1995/96 Mbinga Songea Tunduru TotalTone % Tone % Tone % Tone %Maize 64,800 20.8 227,277 72.0 19,600 6.3 311,677100Paddy 4,685 9.9 22,683 48.1 19,800 42.0 47,108 100Tobacco 1,600 22.8 5,272 75.1 145 2.1 7,017 100Coffee 10,500 99.0 100 1.0 - - 10,600 100Cashewnuts 205 3.8 85 1.6 5,080 94.6 5,370 1001996/97Maize 51,235 22.3 158,563 69.1 19,530 94.6 229,328100Paddy 3,222 8.3 16,156 41.4 19,650 8.6 39,028 10037
Tobacco 400 2.9 12,913 95.8 159 50.3 13,472 100Coffee 8,000 98.9 85 1.1 - 1.3 8,085 100Cashewnuts 225 3.4 119 1.8 6,300 94.8 6,644 10038
Fig. 13: Crop Production in Mbinga, Songea and Tunduru Districts, 1995/96250,000200,000150,000100,00050,0000MaizePaddyTobaccoCoffeeCashewnutsMaizePaddyTobaccoCoffeeCashewnutsMbinga Songea Tunduru2.4.2 FOOD CROPS:Food crops are maize, paddy, cassava, beans, sweet potatoes,millet and sorghum. Table XIX indicates production levels foreach food crop from 1990 - 1996.39
Table XIX: TOTAL CULTIVATED AND PRODUCTION OF MAJORFOOD CROPS 1990-1996YearProductionTon/Ha.Crop typeMaize Cassava Paddy Beans/LegumeMillets/Sorghum1990 Tones 281583 53215 41097 22664 4528 403087Hectares 125396 31130 27200 27774 6638 218138Ton/Ha. 2.2 1.7 1.5 0.8 0.7 1.81991 Tones 303283 76974 53415 24008 5893 463573Hectares 127365 34729 32628 30615 9092 234429Ton/Ha. 2.4 2.2 1.6 0.8 0.6 2.01992 Tones 287644 82002 26089 21239 4583 421557Hectares 140919 50872 30359 32672 8643 263465Ton/Ha. 2.0 1.6 0.8 0.6 0.5 1.61993 Tones 238568 89731 41162 20508 4683 394652Hectares 104229 59145 30146 28296 8995 230811Ton/Ha. 2.3 1.5 1.4 0.7 0.5 1.71994 Tones 269047 65310 43251 23019 4554 405181Hectares 126320 36025 30579 30907 6523 230354Ton/Ha. 2.1 1.8 1.4 0.7 0.7 1.71995 Tones 260464 74208 43206 23402 3320 404600Hectares 116733 41597 27381 33240 5602 224553Ton/Ha 2.2 1.8 1.6 0.7 0.6 1.81996 Tones 229328 84382 41028 27766 2843 385347Hectares 124148 48113 26723 32366 4827 23177Ton/Ha. 1.8 1.7 1.5 0.8 0.6 1.6TotalSource: Regional agriculture Office 1997.Production trend over the years (Table XIX) is of a fluctuatingnature let alone low productivity per hectare. Productivity ofmaize per hectare fell from 2.2 tons per hectare in 1990 to 1.8tons per hectare in 1996. Productivity in cassava, paddy andpulses remained the same between 1990 and 1996. One maywonder why productivity in food crops is too low or static in<strong>Ruvuma</strong> region, especially when you consider the potentiality ofthe region in terms of climate, topography and its human capital.Could low productivity in food crops be attributed to poor roadinfrastructure in the region? I understand, roads make themovement of people, goods and services easy and where they40
(a)lack the incentive to produce and market the produce becomesvery low.MAIZE:Songea district is the main maize producing area in the region. InSongea district, maize is mainly produced in Undendeule,Mkongo, Hanga/Mputa divisions. In Mbinga district, maize isproduced in Matengo Lowlands, Mpepo and Namswea divisions.According to table XIX, maize production was highest in 1991followed by 1992. The region produced 303,283 tons in 1991.Surprisingly enough maize production went down by 24 percentfrom 303,283 tons to 229,328 tons in 1996. Poor maizeproduction in the region could be attributed to the maize diseaseknown as Maize Blight Disease. The disease attacked the regionin 1995/96, causing maize leaves to dry. Mbinga and Songearural were the most affected. Nevertheless, the region has takenthe following measures in order to mitigate the disease effects:-- Burning all maize stocks and other weeds beforenext planting season.- Encouraging the use of improved seeds, believedto be resistant to the disease.- Allowing the land to lie fallow for 2-3 years.(b)Paddy:Paddy is grown in all three districts of the <strong>Ruvuma</strong> region.Important areas for growing paddy in Mbinga district include,Lake Nyasa shores especially in Ruhekei and Ruhuhu divisions.In Songea district, the important paddy growing areas are inMuhukuru and Sasawala divisions and some few areas inHanga/Mputa division. In the district of Tunduru, paddy is grown41
along the Riverplains, the valleys of <strong>Ruvuma</strong> and Nampungu riversas well as small river basins particularly the Angalia basin. Paddyproduction according to table XIX, fluctuates between 26,089tons and 53,500 tons. Paddy productivity per hectare also wentdown as low as 0.8 tons per ha. in 1992 from 1.6 tons per ha. in1991.2.4.3 CASH CROPS:Table XX:Year1993/941994/95As already said, the most important cash crops in the region aretobacco, coffee and cashewnuts. Other cash crops includesunflower, simsim, groundnuts and soyabeans. Table XXhighlights production trend in cash crops between 1993/94 and1996/97. The table also shows the contribution of the region tothe total national production of tobacco, coffee and cashewnuts.It is observed from the table that the region contributed 38.1percent of the total tobacco production in the whole country, in1996/97, while the contribution of coffee was only 19.6 percent inthe same period. Percentage contribution of coffee in <strong>Ruvuma</strong>declined from 23.7 in 1993/94 to 19.6 in 1996/97.PERCENTAGE CONTRIBUTION OF RUVUMA REGION INTERMS OF MAJOR CASH CROPS TO TOTAL NATIONALPRODUCTION COMPARED WITH OTHER REGIONSCrops<strong>Ruvuma</strong> Other Regions National Total(Tone) %Contribution42(Ton) %Contribution(Tone) %Tobacco 4,640 17.8 21,470 82.2 26,110 100Coffee 9,100 23.7 29,294 76.3 38,394 10Cashewnuts 6,120 13.1 40,478 86.9 46,598 10Tobacco 6,453 29.2 15,657 70.8 22,110 10Coffee 8,763 17.9 40,226 82.1 48,989 10Cashewnuts 5,670 9.5 54,330 90.5 60,000 10
1995/961996/97Tobacco 7,017 24.7 21,353 75.3 28,370 10Coffee 10,600 19.3 44,400 80.7 55,000 10Cashewnuts 5,370 6.6 76,359 93.4 81,729 100Tobacco 13,472 38.1 21,934 61.9 35,406 100Coffee 8,224 19.6 33,776 80.4 42,000 100Cashewnuts 6,644 9.8 61,356 90.2 68,000 100Source:RALDO Office <strong>Ruvuma</strong>43
Fig. 14 (a):80,000Production Graphs of Major Cash Crops in <strong>Ruvuma</strong>Region Compared with National Production (Tone).70,00060,00050,00040,00030,00020,00010,0000<strong>Ruvuma</strong> Region(Tone)Other Regions (Ton)44
Fig. 14 (b):100Percentage Contribution of Major Cash Crops to TotalNational Production.9080706050403020100<strong>Ruvuma</strong> Region %ContributionOther Regions %Contribution(a)Coffee:Coffee thrives well in Mbinga district and Songea Rural. Theimportant areas which grow coffee in Mbinga district are theMatengo Highlands, where 90 percent of the coffee comes from.However, Mbuji division, particularly the Hagati valley is the mostfamous coffee growing areas. The most famous areas for coffeegrowing in Songea district are the Northern Highlands of Madabadivision, especially the areas in Limo whose attitude is similar tothe Matengo Highlands. Other small-scale coffee growing areas inSongea Urban includes the Matogoro Highlands, particularly theareas of Ndirima, Litembo, Mahilo and Lipanya. The production45
2.4.4 FARM IMPLEMENTS:The use of hand hoes is a predominant means of cultivation in theregion. Efforts to introduce mechanization farming has beenfruitless due to low level of people's awareness and little educationwhich has tended to prevent them from appreciating modernfarming techniques and the use of better farm implements. TableXXI shows clearly that the majority of the people in <strong>Ruvuma</strong>region still use the hand hoes. It is also evident that the use ofploughs in the region is still insignificant. There are only 49ploughs. It is also observed from the table below that SongeaRural has more tractors (82) against only 17 in Tunduru.Table XXI: AVAILABLE FARM IMPLEMENTS, 1997:DistrictHandHoesOx-CartsCultivatorsOx-RidgesImplementsOx-HarrowsOx-PloughsTractorsTractorsandPloughsSongea (U) 7,188 2 1 1 1 3 2 5Mbinga 243,720 8 4 5 4 17 37 27Tunduru 81,675 3 4 9 15 16 17 13Songea (R) 162,737 43 2 4 5 13 82 57Total 495,320 56 11 19 25 49 138 102Source:RALDO Office <strong>Ruvuma</strong>.2.4.5 FARM INPUTSThe nature of soils in the region requires an application offertilizers otherwise, the yields become poor. Thus, for betterproduction of various crops in the region, large quantities offertilizers and improved seeds are very essential. Table XXIIbelow highlights what pertains to the demand and supply of farminputs in the region.47
TABLE XXII:DistrictSongea(U)Type ofInput(Tones)FERTILIZER AND IMPROVED SEEDS MADEAVAILABLE TO DISTRICTS 1990 - 1995DemandandSupply1990 1991 1992 1993 1994 1995 1996Fertilizers Demand 4,115 3,949 2,219 4,419 4,420 4,420 3,172Improved SeedsSupply 2,424 3,034 2,807 3,680 3,613 3,639 2,298Shortage 1,691 915 +588 739 807 781 874Demand 16.20 14.70 24.00 NA NA NA NASupply 12.40 12.00 15.00 NA NA NA NAShortage 3.80 2.70 9.00 NA NA NA NAMbinga Fertilizers Demand 19.071 16.409 17,314 16,834.0 16,834 17,406 11,327Supply 6599.25 6168.25 1,877 8,538 9,247.3 2,600.3 2,669Shortage 12471.75 10240.75 15,437 8,296 7,586.7 14805. 8,6587Improve Demand 66 40 32 32 32 32 52d SeedsSupply 6 2.44 5 3 1.5 6 2.5Shortage 60 37.56 27 31 30.5 26 49.5Tunduru Fertilizers Demand 1,482 6,291 6,259 6,259 6,145 6,100 4,100Supply 1,358.45 2215.85 633 166.35 1369.40 17,081. 1,6321Shortage 123.55 4075.15 5,626 6092.65 4775.6 4,391.9 2,468Improve Demand 33 8 6.50 6.0 6 5.00 21.00d SeedsSupply - 0.349 0.30 - - 10.00 -Shortage 12,354 7.651 6.20 6.0 6.0 +5.00 21.0Songea Fertilizers Demand 16612.25 12,451 15,910 13,796 14,042 8,358 15,573(R)Supply +4258.25.14,462.7 15,979 15401.3 40359.65 +18819 18985.95Shortage 105 2011.7 +69 +1605 +26317.65 +10,461+3412.95Improve Demand 80.6 96.0 80 80 61.0 75.0 75.0d SeedsSupply 24.4 63.5 45 25 38 48 20.5Shortage 32.5 35 55 23 27 54.5YearSource:RALDO Office <strong>Ruvuma</strong>From Table XXII we see clearly that the low crop productionlevels observed in the previous sections are mainly caused byinadequate supply of the needed farm inputs. How do youexpect good harvest if the amount of fertilizers required does notreach the farmers!48
In Mbinga district in 1990 for instance, the people needed19,071 tons of fertilizers but only 6,599.25 tons were supplied.In Songea Rural in 1995, they needed 48 tons of improvedseeds but got only 27 tons.2.4.6 IRRIGATION:Table XXIII:DistrictIrrigation development in <strong>Ruvuma</strong> began in early sixties and wasmore strengthened in Mid-seventies when Indian Engineersmanaged to construct several intakes in the region. Theseinclude Likarasi, Mtonya, Masonya and Likonde. Financialconstraints hindered further irrigation development despite bigpotential of the irrigatable land in the region. Crops which can begrown under irrigation are rice and sugarcane.IrrigationPotentialArea (Ha)LAND UNDER IRRIGATION, POTENTIAL AREA ANDMAIN SOURCE OF IRRIGATION WATERArea UnderIrrigation(Ha)Main Source of IrrigationWaterSongea (U) 13,000 60 Streams and Rain waterharvestMbinga 18,000 500 Rivers, Streams and Rainwater harvestTunduru 1,800 800 Rivers and Streams Rainwater harvestSongea (R) 32,930 30 Rivers, Streams/Rainwater harvestTotal 65,730 1,390Crop IrrigatedSweet Potatoes, VegetablesPaddy, Beans, Sugarcane andVegetablesPaddypaddy, Sugarcane, FruitsSource: RALDO Office <strong>Ruvuma</strong> 1997It is observed from table XXIII above that despite huge potential inIrrigation in the Region, only 2 percent of the land is irrigated. The Regioncould produce more food for the nation if more hectares of land were put49
under irrigation. Until the end of 1997 the Region managed to irrigate only1390 hectares out of 65,730.2.4.7 FOOD ADEQUACY:Table XXIX: THE REGION FOOD POSITION AND BALANCES 1996DistrictNumberof villagesNumberofHouseholdsPopulationEstimate1996foodproductionin tonesfoodRequirementin tonesfoodBalanceSongea165 24,342 135,581 8,923 31,923 -22,487(U)Mbinga 168 61,215 349,582 86,798 104,875 -18,077Tunduru 98 37,686 204,721 76,459 74,692 1,767Songea116 106,003 330,576 273,525 99,173 174,352(R)Total 546 229,246 1,020,461 445,705 310,150 135,555Source: RALDO <strong>Ruvuma</strong>It is reported that <strong>Ruvuma</strong> region normally does not face foodshortages to the extent necessitating food importation from otherregions. The region has the potential to produce enough food forits population and sell surplus food to other regions in need.However, there are some few areas like those along Lake Nyasashores in Mbinga district and some of the villages near <strong>Ruvuma</strong>River in Songea and Tunduru districts which sometimes face foodshortages. The food shortages are said to be caused by reluctancyof the local people to adopt the cultivation of drought resistantcrops such as cassava.It is seen from table XXIX that in 1996 the region had a surplus offood to the tune of 135,555 tons. Although, Songea Urban andMbinga District appear to have had food shortage, we believe thegap was bridged by food surpluses from Songea Rural andTunduru district. Food sufficiency notwithstanding, the region doesexperience a lot of cases of malnutrition believed to be caused by50
inadequate intake of animal protein, especially for children underthe age of 5 years. Thus, it is important for the people in theregion to increase animal protein in their diet. This can be done byencouraging people to keep more livestock.2.4.8 STORAGE FACILITIES:Table XXX: NUMBER OF MODERN STORAGE FACILITIESIN RUVUMA, 1996:District Number of Godowns Capacity in TonesSongea (U) 15 36,500Mbinga 129 8,160Tunduru 37 11,300Songea (R) 175 52,500Total 352 108,460Source:RALDO Office <strong>Ruvuma</strong>Storage facilities for crops are increasingly loosing their originalmeaning and importance as well. This stems from the fact thatthe present trade liberalisation policy does not encourage storageof crops in the godowns for longer periods. Free competition inbuying and selling of crops also means competition for marketsas well as minimisation of costs. This means the sooner you buyand sell the better to avoid unnecessary storage costs (charges).2.4.9 LIVESTOCK:The region has small Livestock population. Mbinga district hasrelatively more livestock than other districts. Efforts are beingmade by the District authorities in collaboration with InternationalOrganisations such as World food Programme, Caritas and foodAid Counterpart Fund to bring in more cattle and goats from the51
other regions. Table XXXI below indicates livestockdistribution by District.52
Table XXXI: LIVESTOCK POPULATION GROWTH BY DISTRICT 1984-1994Type of Number of LivestockDistrict Livestock% Growth1984 1994Songea (U) Cattle 700 3,286 369.43Goats 5,343 10,177 90.5Sheep 340 567 66.74Pigs 1,413 3,002 112.46Cattle 29,990 52,655 75.6goats 77,182 118,168 53.1Sheep 10,906 19,154 75.6Pigs 28,406 53,098 86.9Tunduru Cattle 1,617 4,521 179.59Goats 49,693 102,565 106.4Sheep 4,560 7,614 66.97Pigs 176 476 170.45Songea (R) Cattle 6,703 11,341 66.97Goats 50,184 67,667 34.84Sheep 4,818 8,021 66.47Pigs 11,987 31,896 166.10Total Region Cattle 39,010 71,803 84.1MbingaGoats 182,402 298,577 63.7Sheep 20,624 35,356 71.4Pigs 41,982 88,462 110.7Source: RALDO <strong>Ruvuma</strong> 1997In a period of ten years (1984 - 1994) livestock population in<strong>Ruvuma</strong> region increased very significantly. For instance, thenumber of cattle increased by 99 percent from 39010 in 1984 to77,803 in 1994. It is reported that the increase in the number ofcattle is mainly due to the efforts made by various institutionsincluding the Heiga Project International (HPI). The HPI projectintroduced into the region new cattle breeds as well as importingcattle from neighbouring regions. Luhimba and Hanga are used aslivestock breeding centres.53
2.4.10 LIVESTOCK DISTRIBUTION:TABLE XXXII: DISTRIBUTION OF CATTLE BY TYPE IN RUVUMA REGION 1994Cattle Type Number of Cattle % of TotalBulls 6,303 8.45Oxen 766 1.22Cows 40,368 57.95Steers 4,631 7.38Heifers 8,194 9.87Calves 12,307 15.13Total 71,803 100.00Source: RALDO <strong>Ruvuma</strong> 1997.Fig. 15: Distribution of Cattle by Type in <strong>Ruvuma</strong> Region 199445,00040,00035,00030,00025,00020,00015,00010,0005,0000Bulls Oxen Cows Steers Heifers Calves54
Table XXXIII: DISTRIBUTION OF DIARY CATTLE AND OWNERS BY DISTRICT 1994DistrictSmall Scale OwnersNumber ofCattleOwnersDiaryCattleNumber ofFarmsBig Cattle FarmsDiary CattleSongea (U) 314 189 - -Mbinga 12,208 141 1 -Tunduru 1,651 15 2 -Songea (R) 4,942 102 4 2Total 19,115 447 7 2Source: RALDO Office <strong>Ruvuma</strong>.Large population of cattle in the region belongs to farms owned bylocal government authorities, missionary and prisons department.These farms are in Luhimba and Muhullum (Songea district),Peramiho and Liganga (Peramiho Mission) Masonya and Majimaji(Tunduru district) and Matiri in Mbinga district.2.4.11 LIVESTOCK IN FRASTRUCTUREThe region has very few Livestock infrastructure to cater for theincreasing number of animals. This is due to the fact thatLivestock are owned by small scale farmers scattered all-over theRegion, making it difficult for the Government to provide therequired facilities.55
Table XXXIV: AVAILABLE LIVESTOCK INFRASTRUCTURE BYDISTRICT 1996District Dips Crusher health Clinics AbattoirHides andSkinshedsSongea2 - 1 2 1(U)Mbinga 22 - - 2 -Tunduru 12 - - 1 -Songea 30 19 - - -(R)Total 66 19 1 5 1Source: RALDO Office <strong>Ruvuma</strong> 1997The most interesting observation we can make on table XXXIV isthat Mbinga District which happen to have more cattle thanSongea Rural has only 21 dips. Songea Rural with 11,341 (1994estimates) cattle has 30 dips and 19 crushers.2.5 NATURAL RESOURCES<strong>Ruvuma</strong> Region is endowed with very high natural resourcepotential, including the Miombo woodlands. The potentialsinclude natural forests, game reserves, fish minerals deposits,honey and bees wax.2.5.1 FORESTRY:<strong>Ruvuma</strong> region is one of the regions in the southern part of thecountry endowed with natural miombo woodlands. The regionhas a total number of 13 forest reserves with a total area of695,775 Ha. Out of this area, catchment forest reserves take upan area of 629,805 Ha, equivalent to 90.52% of the total forestreserve area.56
TABLE XXXIV (a): FORESTS COVERAGE BY DISTRICTDistrictNumber ofForest ReservesCatchmentForest ReservesForestReserves (Ha.)RESERVE AREACatchmentforest Reserves(Ha.)Songea (U) 1 1 3,723 3,723Mbinga 3 2 59,769 2,719Tunduru 4 4 315,386 315,386Songea (R) 5 3 316,897 307,977Total 13 10 695,775 629,805Source:Regional Natural Resources Office-<strong>Ruvuma</strong>.The problem with forests is that there is no effective protection ofthe existing forests. In most cases people over exploit them in theprocess of gathering firewood and cutting wood for buildingmaterials, and other uses. However, as we can see in TableXXXIV (b) the Regional Authority is making some effort to avoidfurther depletion of forests by preserving some of them. Apartfrom preserving the forests for the future other measures should betaken to replenish the barren areas with trees, (raising seedlingsand planting them). As evidenced by the data on Table XXXIV(b) tree planting by various Institutions has been increasingtremendously.TABLE:XXXIV (b)InstitutionsInvolvedDistrictCouncilsNUMBER OF SEEDLINGS PLANTEDNumber of Seedlings planted in <strong>Ruvuma</strong> Region1990 1991 1992 1993 1994 1995 19962millio 2.5 4 Million 3.5 2 Million 2.6 1 Millionn MillionMillionMillionSchools 75,000 80,000 100,000 208,000 200,000 50,000 26,000Villages 800,000Individualgroups100,000950,000 1.2Million571.5Million1 Million 1Million0.4Million250,000 800,000 750,000 600,000 600,000 30,000Other 50,000 75,000 25,000 30,000 30,000 20,000 10,000
Source:Regional Natural Resources Office-<strong>Ruvuma</strong>The success story of tree planting in <strong>Ruvuma</strong> Region has beenmade possible by European Union Funds. These funds haveenabled the District Councils to raise and plant 17.6 millionseedlings between 1990 and 1996. The Regional and DistrictAuthorities should continue to encourage and support thoseinterested in tree planting as well as the overall environmentalpreservation endeavours. Apart from balancing deforestation andafforestation, people earn incomes through sales of fuelwood,charcoal, poles etc, while the government gets its revenue fromsale tax. Therefore, promoting afforestation programme in theRegion benefits both the government and the people.It is reported that between 1991 and 1996 the revenue collectedfrom the sale of various forest products amounted to10,650,300/= (TShs), of which TShs 14,343,175 came from thesale of charcoal, logs fuel wood etc.Table XXXV below, highlights the volume of forest productsproduced between 1991 and 1996.Table.XXXV: FORESTRY PRODUCTION 1990 - 1996Type of Product1991 1992 1993 1994 1995 1996Timber (Logs) 80,000 200.0 150.0 100.00 120.00 90.565Fuel woods M 3350.0 400.05 500.00 450.00 400.00 387.25StackedCharcoal (M 3 )500 800 850 600 700 958(Bags)Poles Number 200 500 600 450 500 180Source: Regional Natural Resources Office <strong>Ruvuma</strong>58
2.5.2 Wildlife:<strong>Ruvuma</strong> Region is also rich in wildlife, especially the elephants,sable, lesser Kudu, hippo, lions, leopards, zebra, buffalo etc. Theregion has one game Reserve (Selous) and game controlled areasnamely, Muhuwesi, Undendeule and Mwambesi. Liparamba inMbinga district is still a proposed Game Reserve. Liparambaoccupies about 570 sq km Muluwesi and Mwambesi Gamecontrolled areas are in Tunduru district, while Undendeule is inSongea district. Like in other Game controlled areas, gamepoaching is always a problem, that the government will need tofind a lasting solution. Other problems disturbing game includesbushfire.2.5.3 Bee-Keeping:Bee-keeping if taken seriously it becomes a very good alternativesource of income for many people. In other regions wheremiombo woodlands are plenty, you find bee-keeping activitiesvery lucrative to many people. The same could happen in <strong>Ruvuma</strong>region if people could be made aware of the potential still nottaped effectively. It is reported that in 1996, <strong>Ruvuma</strong> regionproduced only 1.43 tons of honey and 0.3 tons of wax. In Iringaregion in 1994/95 season for instance, it produced 116 tons ofhoney and 7 tons of wax (Iringa region Socio-Economic Profile,Page 77). According to Iringa Socio-Economic Profile, people inNjombe district earned 51,770,000/= from the sale of honey in1994/95 season.Table XXXVI below highlights low production levels in honey andwax between 1990 and 1996.60
TABLE.XXXVI: PRODUCTION HONEY AND BEE-WAXBETWEEN 1990-1996YearHoney(Tones)Bee-Wax(Tones)1990 10.5 3.81991 10.2 3.41992 8.5 2.51993 5.6 2.21994 6.8 1.11995 3.4 0.451996 1.43 0.304Source: Region Natural resource Office <strong>Ruvuma</strong> 1996Fig. 16: Production of Honey and Beeswax (Tones) Between1990 - 1996, <strong>Ruvuma</strong> Region.1210864201990 1991 1992 1993 1994 1995 1996Honey (Tones)Bee-Wax (Tones)2.5.4 FISHING INDUSTRY:Fishing plays an important role in the economy of <strong>Ruvuma</strong>Region in particular in Mbinga District. It is a supplier of fish61
protein and a major source of employment. Fishing activities aremaily carried out in lake Nyasa, covering an area of 2978 km 2 .Minor fishing in the waters of Ruhuhu, Ruhuji, Lukimwa,<strong>Ruvuma</strong>, Mwambesi, Nampungu and Muhuwesi rivers also docontribute substantial amount of fish. There are about 5000 fulland partime artisanal fishermen using over 1000 dug out canoes.Fish catches fluctuate between 18,000 and 25,000 metric tonesannually with a declining tendency mainly due to a markedshortage of modern fishing gear. Mbinga exports about 50,000live aquarium fish to European markets per year. In inland areasthere are about 5,000 fish ponds, where some people practicesmall-scale fishing. Nevertheless, fishing in the region is not tothe level that meets demand and in most cases necessitates theimportation of fish from other regions. The region receives about1000 tones of processed fish from Lake Victoria (Mwanza),Lake Tanganyika (Kigoma, Rukwa), Mtera Dam, Kilomberoand Indian Ocean (Coast Dar es Salaam, Lindi Mtwara)annually.TABLE XXXVII: FISH PRODUCTION (LAKE NYASA)Year No. of No. of Vessels Weight of fish (Ton)Fishermen1990 5,087 1,255 23,381.21991 4,018 857 24,091.61992 2,184 1,482 41,591.31993 2,184 1,482 37,5501994 4,957 1,572 28,020.61995 4,203 1,056 18,3551996 4,002 1,022 25,154Source:Report on fisheries report from 1985-1995 <strong>Ruvuma</strong> region.- Fisheries Annual Report <strong>Ruvuma</strong> Region.62
Fig. 17: Fish Production (Lake Nyasa) (Tones) in <strong>Ruvuma</strong> Region, 1990 - 1996.45,000.0040,000.0035,000.0030,000.0025,000.0020,000.0015,000.0010,000.005,000.000.001990 1991 1992 1993 1994 1995 19962.5.5 MAJOR FISHING AREAS:Lake Nyasa provides a major fishing ground in the region and itoccupies 2978 sq. kms. Minor fishing areas include rivers, naturaldams and ponds (man-made): Important rivers are Ruhuji, Pitu,Lukimwa and <strong>Ruvuma</strong> in Songea district. The rivers in whichfishing is carried out in Tunduru district are Muhuwezi, Mwambesi,Nampungu and <strong>Ruvuma</strong>. There are 5301 fish ponds of which1184 are in Songea Urban, 1985 are in Songea Rural, 1142 are inTunduru and 990 are in Mbinga district.2.5.6 MINING:The mineral deposits potential of the region includes gold.Various gemstones, coal and building materials, diamond havealso been reported to exist especially in the southern most end ofthe region. The deposits concentration spread as follows:-63
(i)Gold:Gold prospecting and mining is mostly carried outin Mbinga District, by small-scale miners. RecentGeological investigations indicated that there were somegold deposits along Muhuwesi river in Tunduru district.Mineral potential is believed to be enormous, specially inTunduru and Songea districts.(ii)Gemstones:Gemstones mining in Tunduru has only startedrecently but the potential appears to be high.Gemstones spotted include, sapphire, chrysobery,Alexandrite, spinel and Garnets. Agua marine depositshave been found in Songea district. However, a detailedexploration work is still needed to confirm the existence ofthe gemstones, the grade, quality and etc.(iii)Coal:Geological investigations in <strong>Tanzania</strong> wasconducted mainly by the Colonial DevelopmentCorporation (Madini - Dodoma) and NDC, and foundFive basins in <strong>Ruvuma</strong> Region to be containing some coal.The existing basins are Ngaka, Muhukuru, Mbamba-Bay,Njuga and Lumecha. More work is still needed by theGeologists to confirm the existence of the coal, quantityand quality.(iv)Building Minerals:64
Building minerals like rocks, stones, gravel, sand,murram and clays are available in the region. The mineralsare good for road contruction, house building and generalmasonry and brick making.2.5.7 SECTOR PROBLEMS1. Mineral prospecting and mining activities in theregion are being carried out with minimal mechanization,(prospecting is by visual inspection and or by developmentof shallow trenches).2. Most miners employ inferior equipments (picksand shovels).3. Lack of transport for supervising mining activities.4. Lack of reliable market since early 1995 (thebank of <strong>Tanzania</strong> stopped buying gold). This has affectedMbinga District most.2.5.8 INDUSTRY ACTIVITIES:The region has three big factories, namely, tobacco processingfactory owned by Songea Agricultural Marketing and CooperativeUnion (SAMCU), coffee curing factory owned byMbinga Marketing Co-operative Union (MBICU) andcashewnuts factory owned by Cashewnut Marketing board of<strong>Tanzania</strong>. Table XXXVIII highlights the number of existingindustries in each district.65
Table. XXXVIII: THE NUMBER OF SMALL SCALE INDUSTRIES, 1996:Type of Industry Songea (U) Mbinga Tunduru Songea (R) Total(No.) (No.) (No.) (No.)Ginneries NIL - - - -Farm Implements 1 - - - 1Griding Mills 208 159 90 99 556Machenised Saw Mill 2 3 2 2 9Pit Saw 4 - - - 4Caprentry Works 4 1 2 1 8Printing Press 1 - - 1 2Oil Extraction 5 - - - 5Bakery 5 3 2 2 12Grain Milling 1 5 - 4 10Fruit Canning - - - - -Textiles - - - - -Hand Loom5 1 - 1 7WeavingGarment Tailoring 10 - - - 10Tanneries -0 - - - -Shoe Making 2 - - 1 3SoapsUtensilMetal 5 5Fabrication 1 1Transport 2 2 4Workshops 2 2Auto-Garages 2 2Blacksmiths 1 137 6 - 5 48Source: Regional Manager SIDO - <strong>Ruvuma</strong> 19962.5.9 SECTOR PROBLEMS:The Industrial sector in the region has various setbacks whichhinder the development of the existing industries and theestablishment of new industries.1. Poor infrastructure such as Roads, storage facilities,power, and water,2. Lack of market for some products.66
3. Low entrepreneurship ability among the people.4. Lack of Credit facilities.67
SECTION III3.0 ECONOMIC INFRASTRUCTURE:3.1 Roads Network:<strong>Ruvuma</strong> Region has a total of 3,921 kms. of road network. Theroad network includes trunk, regional, district and feeder roads.Songea the regional headquarter is served by major roads such as,Makambako - Songea tarmac road of 387 km, Tunduru - Songeaearth road of 264 km and Songea -Mbambabay earth road of170km.TABLE XXXIX: ROAD NETWORK BY DISTRICT AND TYPE 1996Type of RoadDistrictTotalTrunk(Km)Regional(Kms)District(Km)Feeder(Km)Songea (U) 36 12 41.0 85 174Mbinga 115 334.2 379.1 225.1 1053.4Tunduru 208 142 242 520 1,112Songea (R) 325 426 722 63 1,536Total 684 914.2 1384.1 893.1 3875.4Source: Regional Engineers Office 1997.Unlike in other regions, the number of kilometers of feeder roadsare incredibly smaller than both kilometers of district and regionalroads. Feeder roads account for only 23 percent of the totalroads length, while district roads account for 35 percent andregional roads 24 percent. Normally feeder roads network areexpected to cover more kilometers because they constitute themost important routes of the regional economy. Various actors inthe economy need feeder roads more than any other route toenable them move and distribute their products to the needy areas.68
ROAD NETWORK - RUVUMA REGIONNLAKESONGEASongeaTUNDURUMBINGATUNDURUNYASARegional boundaryDistrict boundariesRoad networkWater bodies edgeLake NyasaComputer Graphic design & Cartography by: L.V.Mtaroni (97).LEGENDBackground Tanga regionDistrict Urban centers.70
TABLE XL: TYPE AND QUALITY OF ROAD NETWORK 1996Type by SurfaceDistrictTotalTarmac Gravel Earth (Km)(Km) (Km)Songea30 47 97 174(U)Mbinga - 183 870.9 1053.9Tunduru - 12 1100 1112Songea (R) 154 175.8 1206.2 1536Total 184 417.8 3274.1 3875.4Source: Regional Engineer's Office 1997.Improvement of road surface increases the efficiency and reducesthe costs of transportation of goods and services. It is observedfrom Table XL that only 5 percent of the regional road networkare tarmac surfaced and the rest are either gravel or earthsurfaced. The more kilometers of earth roads the more problemspeople face during rainy season as most roads tend to beimpassable. This is evidenced by the condition of the roadbetween Songea and Tunduru during rainy season. Tunduru inmost cases is temporarily cut-off from the Regional Headquarterduring the peak of the wet season.Table XLI highlights the condition of district and Feeder roads inthe region.TABLE .XLI: LENGTH AND CONDITION OF REGION'S ROAD NETWORK 1996:DistrictType ofRoadCondition of Road (Kms.)Good Fair PoorSongea (U) District 0 41Feeder 0 84Mbinga District 0 380.2Feeder 0 230.5Tunduru District 0 242Feeder 0 520Songea (R) District 0 722Feeder 0 63Total District 0 41 1,344.271
Feeder 0 84 813.5GRAND TOTAL 125 2,157.7Source:Regional Engineer's Office.It is observed from Table XLI that there is not any good Districtor Feeder roads. Only 41 and 84 kilometers of district and feederroads are fairly good respectively and the remaining 2,157.7kilometers (District and Feeder roads) of roads network are inpoor state. It also shows the seriousness of the poor roadscondition in <strong>Ruvuma</strong> region. The poor state of roads in the regionis attributed to inadequate allocation of funds for roadsmaintenance. The district councils have very limited capacity tomaintain districts roads. In general the region is faced with poorroad infrastructure which is a big constraint in the exploitation ofthe agricultural potential in the region.Table XLII below shows the names of selected roads which haverecently been rehabilitated.TABLE XLII: UPGRADING AND ROAD MAINTENANCE PROJECTS IN THE REGION1996:District Road (Name) LengthType of WorkCoverageSongea (U) Mkulima road 1 km Upgrading to tarmacstatus5 km Upgrading to gravelstatus40 km Upgrading to earth roadSongea (R) Mlete - Matimira 24.1 km RehabilitationLumecha - Hanga 21.8 km RehabilitationNamabengo - Mbimbi 11.5 km RehabilitationNamtumbo - Namigongo 8.5 km RehabilitationMbinga Ndengu - Mbuji 14.8 km RehabilitationUnyoni - Hanga 32.1 km RehabilitationBambo - Mikalanga 6.5 km RehabilitationMaguu - Hinga 4.2 km RehabilitationGodown access road 7.0 km RehabilitationMbinga - Kitulo 32 km RehabilitationMyangayanga -5.3 km RehabilitationMpitachinunuGela - Ituru 21.2 Rehabilitation72
Pelekano - Lugari 4.3 km RehabilitationLonga - Linda - Matiri 19.5 km Spot ImprovementKilanga juu - Mahenge 7.3 km Spot ImprovementLonga - Litoho 33 km "Mbinga - Litindo 28.5 km "Mapera - Kihongo 6.2 km "Kihulila - Ungano 10 km "Ngima - Litembo 9.7 km "Lituhi - Mbamba Bay 113 km "Ndongosi - Lituhi 32 km UpgradingTrunk Road Songea - Tunduru -Lumesule336 km Spot ImprovementSource:Regional Engineer's Office - <strong>Ruvuma</strong>.73
3.2 Air Transport:Songea Town is served by a small Airport of grade III standard,and mainly suitable for small aircrafts. Apart from small charterplanes, Fokker 50 uses the airport as well.3.3 Marine Transport:Marine transport is only possible in Lake Nyasa by steamerbetween Malawi Ports and Mbamba-Bay port and between Itungiport and Mbamba-Bay on the <strong>Tanzania</strong> side.3.4 Communication Net Work:Telecommunication services have improved in the last five years,during which STD system, was installed and Telex, Fax and EMSfacilities have been put in place as well. Table XLIII shows thetype of telecommucation systems available in the region.TABLE XLIII: TELECOMMUNICATION SERVICES AVAILABILITY INRUVUMA REGION:Type of ServiceYearLetter BoxesTelephone Telex Fax Post OfficeLines1990 999 12 - 3 30251991 1021 12 - 3 30251992 1226 14 14 3 30251993 1257 13 16 3 29751994 1363 14 22 3 30751995 1399 13 24 3 30751996 1306 11 24 3 30751997 1386 11 24 3 3075Source: Manager Kampuni ya Simu <strong>Ruvuma</strong> 1997.74
3.5 Energy and Electricity:TABLE XLIV:Songea Rural is a fast developing district in <strong>Ruvuma</strong> regioncreating high electricity demands. For instance, the presentelectricity demand in Songea town is estimated at 4.0 MW againstthe installed capacity of 3.08 MW. The Township depends onelectric power generated by 4 Generators which are only capableof producing 1.2 MW. Mbinga town still lacks electric powersupply by TANESCO. It's electricity demand is estimated at 2.0MW. Unlike Mbinga town, Tunduru town is supplied withelectricity generated by diesel engines. Demand is still low andtherefore, the existing power is exceeding the demand of thepeople.DistrictURBAN DEMAND AND SUPPLY OF ELECTRICITY INRUVUMA REGION, 1996:Electricity SupplyPercentagewith ElectricityTotalDemandInstalledCapacityTotalSupplySongea (U) 4 MW 3.08 MW 1.5 MW 37.5Mbinga 2.0 MW - - -Tunduru 0.35 MW 0.4 MW 0.35 MW 87.5Songea (R) - - - -Total 6.35 MW 3.48 MW 1.85 MW 57.5Source: TANESCO Songea 199775
3.6 ALTERNATIVE SOURCES OF POWER:3.6.1 Fuel/Fire Wood:Most people in <strong>Ruvuma</strong> Region use firewood for domesticpurposes. About 2 mill m 3 of wood is used every year. Electricpower is used by few people, mainly in towns. Nevertheless,care must be taken to ensure that deforestation does not takeplace in the region due to over cutting of trees in order togenerate the energy needed. Measures should be devised tohelp avoid environmental degradation by pursuing bettermethods of efficient utilization of fuel-wood. Deliberate effortsneed to be made to encourage people to use improved charcoalstoves and tobacco curing methods. Other uses of alternativesources of energy such as coal for tobacco curing, biogas andsolar energy for cooking and lighting should be tried. Biogastechnology has been introduced in the region but very fewpeople are using it. The use of Solar energy is yet to beintroduced in the region. Many people in the region seem not tohave heard of it.76
SECTION IV4.0 SOCIAL SERVICE SECTORS:4.1 EDUCATION SECTOR:Formal education in <strong>Ruvuma</strong> regions begins with the works of theMissionaries particularly, the Catholic Church whose entry into theregion dates back to 1898 <strong>Ruvuma</strong> region therefore is one of thefew regions in the country that could boast of having benefitedfrom the educational activities of the Christian Missionaries.However, the impact of the Missionary education system in theregion is difficult to qualify but we may probably attempt tomeasure it by the output of the early Middle Schools like, Nkaya,Mango, Mpitimbi, Litembo, Kigonsera, Peramiho and St.Michael, etc. In order to provide education to all school goingage in the country without discrimination the government launcheda Universal Primary School Education Programme (UPE) in 1974.The idea here was to provide primary school education to allchildren aged 7-13 and to reduce the adult illiteracy rate from69% to 5% throughout the country. This programme resulted intomany children going to school and many schools being built.4.1.1 Primary School Education:Primary school education in <strong>Ruvuma</strong> region has been expandingespecially in Mbinga district. According to Table XLV below, theregion increased the number of schools from 345 in 1975 to 493in 1996, of which 40 percent are in Mbinga district. An increasein the number of primary schools notwithstanding, schoolenrolment dropped from 76.4 percent in 1991 to 73.8 percent in1996. Another interesting observation we can make from Table77
XLV is that Mbinga district with a smaller land surface has moreprimary schools than Songea and Tunduru districts with biggerland surface. As shown in table XLV Mbinga, Tunduru andSongea Urban districts have made great progress in buildingschools between 1985 and 1996, while Songea rural managed tobuild only 4 schools compared with 7 in Mbinga, 15 in Tunduruand 10 in Songea Urban.TABLE XLV: EXPANSION OF PRIMARY SCHOOLS 1994-1996District 1975 1985 1996Mbinga 127 153 200Songea (R) 112 143 147Tunduru 77 97 112Songea (U) 15 24 34Total 345 408 493Source: Regional Education Office - <strong>Ruvuma</strong> 1997.Fig. 17: Expansion of Primary Schools 1994 - 1996200180160140120100806040200Mbinga Songea (R) Tunduru Songea (U)1975 1985 199678
Another further striking observation from Table XLV above isthat between 1985 and 1996 (about ten years), Mbinga Districtmanaged to increase the number of schools by 31 percent, whileSongea Rural and Tunduru Districts by only 3 and 15 percentrespectively. More primary schools in Mbinga District also helpexplain the cause of higher gross enrolment rate in Mbingacompared with other districts. It appears from the observationsthat Mbinga people take education more seriously than in otherdistricts.4.1.2 Primary School Enrolment:According to Table XLVI we witness a higher Gross EnrolmentRate of about 86 percent in 1996 in Mbinga district comparedwith only 57 percent in Tunduru District.TABLE XLVI: STANDARD I ENROLMENT BY DISTRICT 1996 (7-13YEARS)District Eligible for Actual Not Enroled GrossEnrolmentRegisteredEnrolmentRate (%)Songea (U) 20,243 16,919 3,324 83.6Mbinga 67,527 57,781 9,746 85.6Tunduru 45,039 25,732 19,307 57.1Songea (R) 62,652 43,924 18,728 70.1Total 195,461 144,356 51,105 73.8Source: Regional Education Office - <strong>Ruvuma</strong> 199779
Fig. 18: Standard I Enrolment by District 1996 (7-13 Years)Songea (R)TunduruMbingaSongea (U)0 10000 20000 30000 40000 50000 60000 70000Actual RegisteredEligible for EnrolmentIn Table XLVII it is observed that in all six years (1991 -1996), Gross Enrolment Rate for Girls exceeded that of boys. Itis still not clear why more girls have always been registered thanboys in <strong>Ruvuma</strong> region.80
TABLE XLVII: PUBLIC SCHOOL ENROLMENT IN STD I - VII BY SEX 1991-1996Year SexNumberEligible forEnrolmentActualRegisteredNotRegisteredGrossEnrolmentrate %199119921993199419951996BoysGirlsTotalBoysGirlsTotalBoysGirlsTotalBoysGirlsTotalBoysGirlsTotalBoysGirlsTotal8361781753165370864608463217099289400874071768792439903781828179558293451189033888329662919546162199641941263936552767115132642680466880813685468595705831391786979271684141476703577399914435621418175593897720933174173835021354185993995323844197954363925790217674755728475226305110574.478.576.475.879.477.676.178.777.474.278.176.173.076.774.571.276.673.8Source: Regional Education Office - <strong>Ruvuma</strong> 1997TABLE XLVIII NUMBER OF PUPILS IN PRIMARY SCHOOLS, 1990 - 1996:G R A D EYearTotalI II III IV V VI VII1990 20119 18720 19109 18019 14854 16321 15877 1230191991 22251 19025 18669 19021 17383 14804 16314 1274671992 24199 20651 18865 18608 16593 16627 14367 1299091993 26587 21750 19431 19373 16618 15975 16455 1361891994 26002 24311 20320 19855 15146 16202 15589 1374301995 26919 23646 22674 19859 17418 14595 15769 1402771996 27511 25096 22945 23001 15263 16792 13708 144356Source: Regional Education Office <strong>Ruvuma</strong> 199781
Fig. 19: Number of Pupils in Primary Schools, 1990-19961450001400001350001300001250001200001150001100001990 1991 1992 1993 1994 1995 1996Under normal circumstances, one would have expected morechildren completing Grade VII now than in the past due to severaleducational campaigns that have been made by the leaders topopularize the importance of education, including UPE programmethat has been effective since 1974. Nevertheless, what we see intable XLVIII is different, especially the number of children whocompleted Grade VII from 1990 to 1996. The number fluctuatesso much, beginning with 15,877 pupils in 1990 to only 13,708pupils in 1996. Causes for the drop-out will be clearer when wediscuss a section on school drop-outs. Table XLIX below showspupils/classroom ratio by district. By National standards, the ratioshould be 45:1, that is, 45 pupils per classroom.TABLE XLIX: CLASSROOM PUPIL RATIO BY DISTRICT - 1996District No. of Pupils Available RationClassroomsSongea (U0 16919 222 74Mbinga 57781 1132 51Tunduru 25732 216 119Songea (R) 43924 947 46.4Regional 144356 2524 57.082
Fig. 20: Classroom Pupils Ratio by District, <strong>Ruvuma</strong> Region 1996140120100806040200Songea (U) Mbinga Tunduru Songea (R)Surprisingly enough in Tunduru District, the ratio is as high as119 pupils per classroom. It is only in Songea Rural where theratio is close to the standard ratio of 45 to one. The number ofschools in Tunduru district is not adequate and more schoolsneed to be built soon in order to avoid congestion in classrooms.The more the number of pupils in the classroom the moreineffective teachers become and hence poor educationalperformance at the end of the day. Tunduru district will need356 additional classrooms in order to attain a ratio of 45 pupilsper classroom. Mbinga district would only need 152 additionalclassrooms in this respect.TABLE L (a): DROP OUT CASES:Year 1990 1991 1992 1993 1994 1995 1996 TotalBoys 286 327 393 300 542 404 471 2723Girls 340 446 447 384 517 444 502 3080Total 626 773 840 684 1059 848 973 5803Source: Regional Education Office <strong>Ruvuma</strong> Region 199783
Basic Education Statistics - Ministry of Education (1990 - 1995)Fig. 21: Droup-Out Cases by Sex, 1990 -1996, <strong>Ruvuma</strong> Region60050040030020010001990 1991 1992 1993 1994 1995 1996BoysGirlsUnlike, enrolment rates in Grade I girls tend to drop-out of schoolas they advance into higher grades. Table L (a) above showssuch a drop-out cases. In all years except 1994, drop-out casesin girlss tended to be higher than that of boys. The incidencies ofgirls drop-out from school are further confirmed by the subsequenttables of L (b) and L (d). School drop-out cases, when lookedat from the rural districts point of view, we observe that SongeaRural with fewer schools and pupils than Mbinga district recordedhigher drop-out cases for both girls and boys. For instance, in1990 in Songea rural 138 boys and 160 girls dropped out ofschool against 96 boys and 106 girls in Mbinga district. Similarly,in 1996, 168 boys and 191 girls in Songea rural left schoolcompared with only 96 boys and 109 girls in Mbinga district(Table L (b). Table L (a) shows that the last three years of84
Primary school education have more drop-out cases, especiallythe girls.85
TABLE L (b) DROP OUT CASES BY DISTRICTS1990 1992 1994 1996DistrictB G B G B G B GSongea (U) 6 11 9 21 12 12 18 26Mbinga 96 106 71 90 120 154 96 109Tunduru 46 63 111 124 250 157 189 176Songea (R) 138 160 202 212 160 194 168 191Total 286 340 393 447 542 517 471 502Source: Regional Education Office <strong>Ruvuma</strong> 1997Fig. 23:250Droup-Out Cases by Sex, Boys(B) and Girls (G) forDistricts under the Key, 1990, 1992, 1994 and 1996.200150100500BGBGBGBG1990199219941996Songea (U) Mbinga Tunduru Songea (R)86
TABLE L (c): MAGNITUDE OF DROP-OUTS BY SEX AND DISTRICTStd. I Enrolment Number Percentage Drop-outsDistrict1990Completed StdVII 1995Boys Girls Boys Girls Boys GirlsSongea (U) 1036 1055 888 948 14.3 10.1Mbinga 3510 3438 2988 3235 14.8 5.9Tunduru 2484 2378 1457 1550 41.3 34.8Songea (R) 2997 2967 2280 2443 23.9 17.7Total 10027 9838 7613 8176 24.1 16.9Table L (c) highlights the magnitude of drop-outs by district.When we compare the four districts of <strong>Ruvuma</strong> region in terms ofdrop-out cases, between Grade I and Grade VII, we see thatTunduru and Songea rural command higher percentage drop-outcases. For example out 2484 boys and 2378 girls in Tunduruwho enrolled for Grade I in 1990 only 1457 boys and 1550 girlscompleted Grade VII in 1995. While, in Mbinga district, out of3510 boys and 3438 girls registered in Grade I in 1990 2988boys and 3235 girls completed Grade VII in 1995. The reasonsfor drop-out cases in schools are highlighted in Table L (d).According to the table in question, it is obvious that truancy is themain cause for drop-outs. Truancy claimed 430 drop-out cases in1991, 500 in 1995 and 626 in 1996. While, pregnancy which isunique and peculiar to girls claimed 171 drop-out cases in 1991,190 in 1993 and 173 in 1996.TABLE L (d): CAUSES OF DROP-OUTS1991 1993 1995 1996Truancy 430 333 500 626Pregnancy 171 190 153 173Death 103 127 129 72Others 69 34 66 10287
Total 773 684 848 973Source: Basic Statistics in Education, Regional Data -Ministry of Education and Culture 1991-1995Fig. 24: Causes of Drop-outs in <strong>Ruvuma</strong> Region, 1991, 1993, 1995 and 19967006005004003002001000Truancy Pregnancy Death Others1991 1993 1995 1996Truancy applies to both boys and girls. Out of 773 casesreported in 1991 truancy constituted 55% while out of 973 casesreported in 1995 truancy constituted 64%. Songea urban districthas the lowest incidence of school drop outs while Tunduru districthas the highest (As table L (e) below). Pregnancy is the secondcause indicating high occurrence. Both Tunduru and Songea ruraldistricts have high incidents of girls leaving school due topregnancy related causes. For example, out of 173 casesreported in 1996, Songea rural had 69 cases (39%) whileTunduru had 52 (30%). Songea urban district had only 7 cases(13%) of the total cases reported while Mbinga reported 45 cases(18%).88
TABLE L (e): SCHOOL DROP-OUT CAUSES BY DISTRICT 1996C A U S E SDistrictSongea (U)MbingaTunduruSongea (R)Truancy Pregnancy Death Others TotalB G B G B G B G6 8 - 7 8 6 4 5 4472 51 - 45 16 - 8 13 205148 101 - 52 8 - 33 23 365137 103 - 69 22 12 9 7 359Total 363 263 - 173 54 18 54 48 973Source: Regional Education Office - <strong>Ruvuma</strong> 1997According to Table L (f) drop-out cases in primary schools werenot very pronounced in <strong>Ruvuma</strong> region compared with otherregions. In 1994 there were only 969 pupils who dropped out ofschool in <strong>Ruvuma</strong> region compared with 1,145 in Iringa, 6406 inMbeya, 5745 in Kagera and 4,752 pupils in Kilimanjaro region.TABLE L (f):DROP OUTS FROM PRIMARY SCHOOLS IN NINESELECTED REGIONS, 1994:GRADESI II III IV V VI VIITOTALRANKING<strong>Ruvuma</strong> 88 60 91 138 108 241 243 969 9Iringa 76 89 126 231 119 209 295 1145 8Kilimanjar 242 436 710 976 645 848 895 4752 3oArusha 392 486 486 773 543 641 695 4016 4Dar es 225 298 451 641 426 432 326 2799 6SalaamKagera 210 420 653 1131 105 1134 1145 5745 22Mara 211 224 295 437 418 355 567 2107 7Mbeya 334 403 368 552 584 584 638 6406 1Tanga 293 408 444 760 517 397 418 3237 589
Source: Iringa Region, Socio-Economic profile, 1997Fig. 25: Drop-Outs from Primary Schools in Nine Selected Region, 1994.700060005000400030002000100004.1.3 Education Facilities<strong>Ruvuma</strong> region like other regions of <strong>Tanzania</strong> is facing seriousshortage of educational facilities. These include infrastructuressuch as classrooms, teachers houses, latrines and other basiceducation facilities such as desks, tables, chairs and cupboards.The absence of these facilities have at times made school life tosome pupils and teachers difficult. Congestion in classrooms hascontributed to poor performance in schools and a cause fortruancy. Poor educational facilities also are cause for teacherslow morale in teaching. Table LI below shows the magnitude of90
educational facilities shortage in 1991 and 1996. According to thetable it appears many teachers go without proper houses to livein. Similarly, most pupils lack desks. In such a situation itbecomes difficult to get good results from the schools. Asobserved from the table, in 1991 on average, educational facilitiescould be met by less than 50 percent. It is also observed that in1996 there was a general decline in terms of requirements. Forexample in 1991 requirements for classrooms were 5212compared to 3487 in 1995. The same applies to other facilities.The overall performance in 1991 and 1996 indicates thatshortages were more pronounced in 1991 than in 1996. Table L Ibelow shows the situation pertaining to educational facilities ineach District.TABLE L I: SITUATION OF EDUCATION FACILITIES BY DISTRICT 1996DistrictType ofFacilityRequiredAvailableShortage%ShortageSONGEA URBAN ClassroomsTeachersHousesLatrinesDesksTables3535956357167889995229743484604272326124521287256361766935.187.645.2366967MBINGATUNDURUSONGEA RURALClassroomsTeachersHousesLatrinesDesksTablesClassroomsTeachersHousesLatrinesDesksTablesClassroomsTeachersHousesLatrinesDesksTables1370171629882402923972084811101011241225016761846104813201516176701992201891113263316421830311131456447257216590541840994754897212057109411002381083134657261284628364753908634712581435101772544561389891817.463.145.024.054.030.044.974.580.852.075.077.09.658.535.932.045.046.0
TOTAL REGIONClassroomsTeachersHousesLatrinesDesksTables3582464162636111669546943275515123178408672897329182731293085202493957365223.167.449.333.057.053.0Source: Regional Education Office - <strong>Ruvuma</strong> 1997It can be observed from table LI above that lack of latrines is aserious problem facing schools in the region which causes alsosanitation problems. Only 51% of the requirements are met andthis could contribute to health hazards particularly during the rainyseasons. Tunduru District is the most affected in terms ofeducational facilities. It had fewer desks even.TABLE L II:1996DistrictSongea (U)MbingaTunduruSongea RuralTotal(Region)TEACHERS DISPOSITION BY DISTRICT AND CATEGORYRequired Actual Strength ShortageIII A III B III A III B III A III B427 244 401 260 -26 +16774 762 655 982 -119 +220433 750 305 705 -128 -45759 710 723 1108 -36 +3982393 2466 2084 3055 -309 +679Source: Regional Education Office - <strong>Ruvuma</strong> 1997Table L II shows the disposition of teachers in the region. It isobserved from the table that the region had 5139 teachers in1996. This gives a ratio of 10. teachers for every school. About40% of the teachers are Grade IIIA while 60% are Grade IIIB. Itis further noted that Grade IIA teachers are fewer in Mbinga andTunduru district schools than in Songea Urban and Songea Ruralschools. However, in terms of Grade IIIB teachers, all Districtshave a surplus except Tunduru.92
4.1.4 Secondary School Education<strong>Ruvuma</strong> Region is one of the Regions with few secondary schoolscompared with say Iringa and Kilimanjaro. Nevertheless, theRegion increased the number of its secondary schools by 255percent from just 9 in 1985 to 32 in 1996. Out of the 32secondary schools, 20 belong to private Institutions. Table LIIIhighlights the expansion of both public and private secondaryschools between 1985 and 1996.TABLE LIII EXPANSION OF SECONDARY SCHOOLS (1985-1996)Year Public Private Total1985199119921993199419951996510111010121246991114209162019212632Source: Basic Education StatisticsMinistry of Education 1991-1995TABLE LIV: DISTRIBUTION OF SECONDARY SCHOOLS BY DISTRICT1996District 1985 1996Public Private Total Public Private TotalSongea UrbanMbingaTunduruSongea Rural311--3-134113531261115114125 4 9 12 20 32Source: Regional Education Office - <strong>Ruvuma</strong> 199793
The distribution of secondary schools in the region is unevenlydistributed among districts. As noted in table 1 Tunduru district,although bigger in size than Mbinga and Songea urban has theleast number of secondary schools in the region with only threepublic and one private secondary schools. Another observationwe make on table LIV is that most of the secondary schools areprivate. There are 20 private secondary schools in the region andabout 55 percent of them are in Songea Rural. Tunduru has onlyone Private Secondary School. Selection to Secondary Schoolsis based on a quota system policy although there are few caseswhere pupils are selected on a competitive basis. As in otherdistricts, Day Secondary Schools tend to remain solely for pupilsleaving around a particular school. Thus, a district with the largestnumber of Day Schools has the advantage of enrolling more pupilsinto its secondary schools.TABLE LV: PUPILS SELECTED TO JOIN FORM I BY DISTRICT 1990-19961990 1993 1996DistrictBoys Girls Boys Girls Boys GirlsSongea Urban 54 64 55 65 93 63Mbinga 163 133 228 194 235 235Tunduru 92 72 109 89 124 121Songea Rural 67 36 110 82 84 87Total 378 305 502 429 536 506Source: Regional Education Office - <strong>Ruvuma</strong> 1997Form I Enrolment by DistrictFig. 26: Pupils Selected to Join Form I by Sex and District, 1990-199694
250200150100500Boys1990GirlsBoys1993GirlsBoys1996GirlsSongea UrbanMbingaTunduruSongea RuralTable LV shows the number of boys and girls selected for Form Iin the region in 1990, 1993 and 1996. It has been reported that9366 pupils in <strong>Ruvuma</strong> region sat for Grade VII Exams in 1990and only 683 pupils were selected for Secondary Schooleducation. The number selected for Secondary School educationcome to only 7 percent. The number of pupils who sat for GradeVII Exams in 1996 was 13300 and we are told only 1042 (equalto 7.8 percent) were selected for secondary school education.Naturally Mbinga District with more public schools absorbedmore pupils from within followed by Tunduru district. On thewhole, more boys join public Secondary Schools than girls astable LV indicates. In 1990, boys were more than girls by 19percent while in 1996 boys were more by only 6 percent.Nevertheless the information available says that disparity betweenthe number of girls and boys joining public secondary schools iscaused by the fact that boys have more boarding schools andsome of them join seminaries. This gives them an advantage overthe girls.95
4.1.5 Adult EducationThere seem to be high response to adult education programme inthe region, since 1967. According to table LVI 59 percent of theAdult population in <strong>Ruvuma</strong> region was illiterate in 1967 but thisnumber dropped to only 4.6 percent in 1992, making the regionthe second in the country with the lowest number of illiteratepeople.96
TABLE LVI:RegionPERCENTAGE OF ILLITERATE POPULATION AGED10 YEARS AND ABOVE BY REGION 1967, 1988 AND 1992Percentage of Illiterate1967 1978 1988 1992Kilimanjaro 44 25.4 19.2 4.7Dar es Salaam 40 26.7 19.3 3.3<strong>Ruvuma</strong> 59 33.7 29.5 4.6Tanga 60 39.4 34.0 9.6Morogoro 63 41.4 37.2 14.2Mara 65 43.6 36.1 12.3Iringa 69 46 31.7 13.8Kagera 60 47.1 40.5 17.9Mtwara 72 48.6 42.9 20.4Dodoma 76 50.5 44.5 17.7Mbeya 71 50.8 38.4 20.7Rukwa - 51.5 41.4 21.7Lindi - 51.6 46.2 21.6Singida 76 53.3 42.6 25.6Mwanza 75 55.7 42.76 25.6Coast 74 56 48.9 17.3Kigoma 81 56.3 44.9 16.4Arusha 74 58.1 41.9 22.2Tabora 73 59.5 49.5 28.0Shinyanga 84 66.8 51.7 31.9Source:1988 Population Census Basin EducationStatistics Data Analysis 1961-199297
Fig. 27: Percentage of Illiterate Population Aged 10 Yearsand Above, 1967, 1978, 1988 and 1992.198823%19924%196746%197827%It is observed from table LVII that the percentage of illiteracy ishigher in Tunduru district than in any other district. Illiteracypercentage is lowest in Songea urban followed by Mbinga District.TABLE LVII: ILLITERATE POPULATION BY DISTRICTNo. ofNumber of Illiterate PopDistrict AdultPopMale Female Total % ofIlliteracySongea Urban 62125 415 979 1394 2.2Mbinga 25414 2831 4260 7091 2.8Tunduru 132741 58767 9030 14897 11.2Songea Rural 165414 2724 5821 8545 5.2Total 614421 11837 20090 31927 5.2Source: Regional Education Office - <strong>Ruvuma</strong> 199798
Fig. 28: Illiterate Population by District and Sex, <strong>Ruvuma</strong> Region6000050000400003000020000100000Songea Urban Mbinga Tunduru Songea RuralMaleFemale4.1.6 Nursey Schools:<strong>Ruvuma</strong> Region has 65 nursery schools which can accommodate5480 children. About 34% of the schools are located in Songeaurban while 24% are located in Songea Rural district. Mbingaand Tunduru districts accommodate 23% and 19% of the schoolsrespectively. Pre-school education is the most significant factor inthe mental and social development of children. Early childhoodeducation helps to prevent stunted cognitive development and hasbeen associated with better performance in school. Pre-schooleducation is thus very important in laying a foundation for furthereducation and future productivity. Table LVIII below shows theabsorptive capacity of the existing Pre-schools in <strong>Ruvuma</strong> Region.Considering the importance of the pre-schools, the Districts needmore of them to cater for more children.99
Table LVIII: PUPILS IN NURSERY SCHOOLS BY DISTRICT AND 1996Numberof1990 1996District NurserySchoolsNumber of Pupils Number ofNurserySchoolNumber of PupilsBoys Girls Total Boys Girls TotalSongea (U) 7 163 154 317 22 746 563 1,309Mbinga 5 115 97 212 15 850 968 1.818Tunduru 2 24 40 64 12 594 726 1,320Songea (R) 5 117 120 237 16 435 598 1,033Total 19 407 391 798 65 2,625 2,855 5,480Source: Regional Education Office <strong>Ruvuma</strong>, 19974.2 HEALTH SECTOR4.2.1 Health Situation:The health status in <strong>Ruvuma</strong> region portrays almost the samegloomy picture experienced by even more developed regions inthe country. It is evident that <strong>Ruvuma</strong> region has considerablyenough health facilities in all districts but like in other regions theylack medicine and qualified medical staffs. In 1996 there were 8hospitals, 15 health centres and 146 dispensaries. Measuredagainst the estimated population of 1996, except the dispensaries,both hospitals and Rural Health Centres serve more people thanthe number required by National Standards. This situation lowersthe quality of service in hospitals and Rural Health Centres andmay help explain the frequenct occurnence of certain diseases.The common and most occurring diseases in <strong>Ruvuma</strong> Regioninclude malaria, URTI, diarrhoea, pneumonia and anaemia. Skinand meningitis diseases are most common in Mbinga and Tundurudistricts respectively. During rain seasons dysentery is also100
common in Songea (R) and Tunduru districts. However, theoccurrence of these diseases is a clear manifestation of poorenvironmental Sanitation. Tables LX, LXI and LXII are enoughindication of efforts made by the private sector in supporting thegovernment in health service provisions. Private sector supportcomes from St. Benedictine Fathero of Peramiho Songea district,Anglican Diocese of <strong>Ruvuma</strong> in Mbinga district, the ChristianMissionary of Mary Lands in Tunduru district. In total there are 52private dispensaries and 5 hospitals owned by ReligionsInstitutions against 94 public dispensaries and only 3 hospitals inthe whole region. Table LIX highlights the number of casesassociated with the diseases mentioned above.TABLE LIX:DiseasesOCCURRENCES OF THE MOST TEN COMMON DISEASESREPORTED BY DISTRICT IN RUVUMA REGION 1995/96CasesMbinga Songea (R) Songea(U)Tunduru Regional1. Malaria 10,728 116,912 44,932 84,446 257,0182. Diarrhoea 1,488 14,827 3,462 25,955 457323. Pneumonia 957 - 4,101 3,325 8,3834. URTI 1,242 50,421 8,547 20,776 80,9865. Anaemia 582 38,091 1,097 9,722 49,4926. Intestinal378 10,071 2,198 2,936 15,583Worms7. Gonorrhea 360 - - - 3608. Eye diseases 918 10820 2,287 8,019 22,0449. Ear diseases 290 - 1,356 - 164610. Skin diseases - 13,514 832 13,038 14346Source: Regional Medical office-<strong>Ruvuma</strong>.The table above shows that the majority of people in <strong>Ruvuma</strong>Region do suffer from malaria, URTI and anaemia. But unlikeother districts, the people in Songea Rural experience more casesof malaria and URTI disease. The people in Tunduru suffer moreoften from diarrhoea and URTI. It was only in Mbinga district101
where the ten most common diseases in the region did not affectmany people. For instance, in 1995/96 season only 10,728people suffered from Malaria against 116,912 in Songea Rural,44,932 in Songea Urban, 84,446 people in Tunduru district.While, URTI cases in Mbinga were only 1,242 and 50,421 inSongea Rural.4.2.2 DispensariesBy the end of 1996, there were 146 dispensaries in <strong>Ruvuma</strong>Region catering for an estimated population of 1,020,464 people(1996 estimates). By National Standards, a dispensary issupposed to serve 10,000 people, this means <strong>Ruvuma</strong> Regionbased on 1996 population estimates appears to have less than theNational Standards requirements of a dispensary. That is, insteadof each dispensary serving 10,000 people in the Region it serves6989. This is good and it assumes better service by thedispensaries.TABLE LX: NUMBER OF DISPENSARIES AND POPULATION PERDISPENSARY 1996DispensariesPopulatio Population perDistrictTotal n (1996 DispensaryEstimates)Public PrivateTunduru 27 2 29 204721 704Songea urban 6 11 17 135581 7975Songea Rural 27 18 45 330576 7346Mbinga 34 21 55 349582 6356Total 94 52 146 1020464 6989Source: <strong>Ruvuma</strong> Regional Medical Office, 1997.4.2.3 Health Centres:102
1996At district level, Rural health Centres (RHC) are the secondreferral health facilities after the dispensaries. By National averagestandards, RHC is supposed to serve 50,000 people and it isstaffed by a medical Assistant and several health auxiliaries.According to table LXI there were 15 Rural Health Centres in<strong>Ruvuma</strong> Region in 1996.TABLE LXI: DISTRIBUTION OF HEALTH FACILITIES BY DISTRICT,DistrictRural Health centresPopulation(1996EstimatesPopulationper RHCPublic Private TotalTunduru 4 - 4 204721 51180Songea Urban - - - 135581 0Songea Rural 5 1 6 330576 55096Mbinga 5 - 5 349582 69916Total 15 - 15 1020464 68031Source: <strong>Ruvuma</strong> Regional Medical Office, 1997It is observed from Table LXI that the existing Rural Healthcentres in all districts serve more than 50,000 people. SongeaRural and Mbinga districts need one more RHC each in order toimprove the quality of medical services offered. All in all, thesituation of RHC services in the Region has not yet reachedalarming state compared with other Regions like Iringa. However,the Authorities must always ensure that people get better medicalservices.4.2.4 Hospital Services:<strong>Ruvuma</strong> Region by the end of 1996 had only 8 hospitalscompared with 17 in Iringa Region. There were only 3 publichospitals and 5 private hospitals as shown below.TABLE LXII:DISTRIBUTION OF HOSPITALS AND SERVICE CAPACITIES103
DistrictNumber of HospitalsNumberof BedsPopulationper Bed(1996)Population perDoctor (1996)Population perHospital(1996)Public Private TotalTunduru 1 1 2 328 624 20472 102361Songea1 - 1 221 613 11298 135581UrbanSongea Rural - 1 1 451 733 55096 330576mbinga 1 3 4 634 551 38842 87396Total 3 5 8 1635 624 3986 127558Source: <strong>Ruvuma</strong> Regional Medical Office, 1997By national average standards a doctor is supposed to serve only24930 people, but what we see in Table LXII is that a doctor inSongea Rural and Mbinga districts serves 55,096 and 38842people respectively. Thus, Songea Rural requires one moredoctor so that the available ones work much more comfortably.The situation may also apply to Mbinga district, where a doctor in1996 served 38,842 people. Further observation on Table LXIIreveals that Songea Rural had only one Private hospital in 1996and it happened to serve 330,576 people against the requiredfigure of 150,000 people per hospital. Songea Rural is the onlyrural district with just a single hospital. In order to avoidcongestion and hence poor hospital services, more hospitals areneeded. If the government can't then the private people shouldcome in. According to Table LXIII the medical personnel in theregion appears to be inadequate compared with the existing healthfacilities. For instance, the Regional and District hospitals still lackmedical specialists such as physicians, patricians, surgeons andpharmacists.TABLE LXIII:PersonnelCategoriesMEDICAL PERSONNEL AND SUPPORTING STAFFDISPOSITION BY DISTRICT 1996Songea (U) Mbinga Tunduru Songea (R)104
TotalEstablishmentActualStrengthTotalEstablishmentActualStrengthTotalEstablishmentActualStrengthTotalEstablishmentActualStrengthMedical9 3 3 1 3 1 2 1DoctorsAssistant 10 8 5 2 5 1 2 -MedicalOfficersMedical 15 20 8 8 8 8 5 6AssistantsSurgeons 1 - 3 1 3 1 1 1Dentists 1 1 1 - 1 - 1 1Dental 2 - 3 - 2 - 3 1Technicians 1 11 1 1 1 2 2Clinic- - - - - - - -OfficersX-ray 2 2 1 1 1 1 2 2Laboratory 3 2 1 - 1 - 2 2TechniciansLaboratory 6 5 3 2 3 1 4 2AssistantsPharmacists 2 - 1 - 1 - 1 1Pharmacists 4 3 3 1 2 - 2 2AssistantsNurse25 30 10 10 15 10 5 11OfficersNurse75 79 35 44 50 45 20 19MidwifesNurse110 24 30 19 75 104 85 74AssistantsHealth12 7 6 4 4 3 6 8OfficersHealth2 12 1 18 1 21 1 22AssistantsMch Aides 30 18 70 56 37 30 58 45Rural33 7 65 45 36 28 56 27MedicalAidesAttendants 88 12 10 5 10 8 12 2Source: Regional Medical Office-<strong>Ruvuma</strong> 1997.105
4.2.5 Life Expectancy at BirthAccording to 1978 and 1988 Population Census, <strong>Ruvuma</strong>'saverage Life expectancy at birth was hardly 50 years especiallyfor the males. Table LXIX shows Life Expectancy at Birth for theMainland region.106
TABLE LXIV: LIFE EXPECTANCY AT BIRTH BY REGION 1978 AND1988 CENSUS TANZANIA MAINLAND1978 1988RegionTotal Male Female Total Male FemaleArusha 50 50 57 57 57 58Coast 47 47 48 48 46 51Dar Es Salaam 50 50 50 50 50 50Dodoma 45 45 46 46 45 47Iringa 41 41 45 45 44 47Kagera 45 45 45 45 44 45Kigoma 40 40 48 48 47 49Kilimanjaro 58 58 59 59 57 62Lindi 42 42 47 47 46 48Mara 44 44 47 47 46 48Mbeya 41 41 47 47 45 48Morogoro 44 44 46 46 45 48Mtwara 40 40 45 46 45 48Mwanza 44 44 48 48 46 50Rukwa 40 40 45 45 44 48<strong>Ruvuma</strong> 43 43 49 49 48 51Shinyanga 42 42 50 50 48 51Singida 44 44 55 55 54 55Tabora 44 44 53 53 53 54Tanga 49 44 49 48 48 51Total 44 49 50 50 49 51Source: Population Census 1978 and 1988 Health Statistic Abstract 1996.It is observed from table LXV that compared with Arusha,Kilimanjaro, Singida and Tabora, the people in <strong>Ruvuma</strong> regionlived shorter on average than those in the above mentionedregions.4.2.6 Nutritional Status<strong>Ruvuma</strong> Region is usually self-sufficient in food production,despite experiencing low animal protein in people's diet. This ismainly caused by fewer livestock available Nevertheless, the107
animal protein shortage is always supplemented by highconsumption of beans and other types of pulses. The Nutritionalprogramme introduced by UNICEF in collaboration with theGovernment of <strong>Tanzania</strong> in 1987 helped a great deal in improvingthe health situation of those who were in poor nutrition status(extreme severe nutrition) from 8.5 percent in 1990 in Tunduru to1.7 percent in 1996 and from 1.7 percent in 1990 in Mbinga to0.6 percent in 1996. In Songea Rural the programme reducedsevere cases from 4.9 percent in 1990 to 1.7 percent in 1996.Table LXVI highlights the success of CSPD programme.TABLE LXVI: PERCENT DISTRIBUTION OF SEVERE AND MODERATECASES UNDER 5 YEARSDistrictSevere1990 1992 1994 1996ModerateSevereModerate108SevereModerateSevereModerateSongea (U) 1.2 28.5 0.5 18.9 0.4 18.3 0.3 15.8Mbinga 1.7 29.0 0.6 25.3 0.8 25.2 0.6 27.6Tunduru 8.5 49.3 4.1 38.9 2.3 44.1 1.7 39.1Songea (R) 4.9 39.7 2.9 33.0 1.5 35.9 1.7 30.9Total 4.1 36.6 2.0 29.0 1.2 30.9 1.1 28.3Source: Regional Medical Office-<strong>Ruvuma</strong>TABLE LXVII:RegionSeverePERCENTAGE DISTRIBUTION OF SEVERE ANDMODERATE UNDER WEIGHT CHILDREN 0-5 YEARS)in CSPD areas -Mainland <strong>Tanzania</strong> 1990-19941990 1991 1992 19993 1994ModerateSevereModerateSevere Moderate Severe ModerateSevereModerateCoast - - - - - - 7.1 46.5 4.4 42.5Iringa 1.7 38.8 1.4 34.0 1.3 32.8 1.1 33.0 1.1 34.8Kagera 2.0 29.5 2.1 33.6 1.6 29.3 1.2 27.2 1.2 25.0K/manjaro 0.6 15.4 0.4 13.2 0.3 12.5 0.2 12.1 0.2 12.8Mara 6.9 32.2 3.0 27.0 2.8 23.1 1.6 20.0 1.4 18.2Morogoro 3.2 38.6 3.3 36.4 2.2 35.85 1.6 31.8 1.5 30.8Mtwara 6.3 43.4 5.5 41.4 1.8 35.5 1.9 35.8 2.0 37.1Mwanza - - - - - - 3.2 20.9 2.3 18.7<strong>Ruvuma</strong> 4.1 36.6 3.7 34.4 2.0 29.0 1.6 30.4 1.2 28.3Shinyanga 2.0 27.2 1.4 26.8 1.5 29.4 1.1 31.0 1.1 30.1Singida 3.5 34.6 1.8 31.5 1.5 33.6 1.5 30.0 1.6 29.6
Total 2.8 34.0 2.5 33.3 1.6 30.6 1.6 28.9 1.4 28.3Source: Health Statistics Abstract 1996Table LXVII above compares achievements attained by eachCSPD implementing Regions. In 1990, Mara, Mtwara and<strong>Ruvuma</strong> regions had serious or severe malnutrition for the underfive children compared with the other regions. However, thissituation changed very much in 1994. It is observed that the casesfor severe malnutrition dropped to only 1.2 percent in <strong>Ruvuma</strong>region, while in Mara region it dropped to 1.4 percent. Theseimprovements in nutrition by and large explain the success of theCSPD programme introduced by UNICEF.4.2.7 INFANT AND UNDER FIVE MORTALITY RATESApart from the existence of the above said common diseases inthe region, there has been a decline in infant and child mortalityrates over the past ten years. This trend has been attributed togeneral improvements in the provision of public health servicesincluding immunization and nutrition programmes implemented bythe government in collaboration with external agencies particularlyDANIDA, WHO,UNICEF and local religious Institutions.According to Table LXVIII both Infant and Under Five MortalityRates in <strong>Ruvuma</strong> Region tended to decline. For example between1975 and 1995 <strong>Ruvuma</strong> region recorded the highest decline ofboth IMR (39.3%) and U5MR (41.6%) compared to Lindi IMR(14.6% and U5MR (14.5%) and Mtwara IMR (26.1%) andU5MR (24.3%) regions.109
TABLE LXVIII: INFANT AND U5 MORTALITY RATES OF RUVUMA REGIONCOMPARED TO LINDI & MTWARA REGIONS AND THENATIONAL AVERAGE:IMRU5MRRegion1975 1985 1995 1975 1985 1995<strong>Ruvuma</strong> 145 113 88 245 188 143Lindi 151 140 129 255 236 218Mtwara 161 138 119 267 233 202National 137 115 96 231 191 158Source: Health Statistics Abstract 1996Fig. 29: Infant and Under Five Mortality Rates for Selected Neighbouring Regionsof Lindi and Mtwara Compared to the National Average in 1975 and 19853002502001501005001975 1985 1995 1975 1985 1995<strong>Ruvuma</strong>MtwaraLindiNational AverageTable LXVIII above shows how many children we lost in everyone thousand in 1975 in the regions of Lindi, Mtwara and<strong>Ruvuma</strong>. The number nevertheless, kept on decreasing and by1995, <strong>Ruvuma</strong> region for instance, lost 88 infants out of 10,000110
and 143 children under five years compared with 245 lost in1975. Similarly in Table LXIX we see that in 1985 and 1995Songea district had the highest IMR and U5MR compared toother districts. For example in 1985 it had 136/1000 IMR and230/1000 U5MR while in 1995 the rates were 115/1000 and171/1000 respectively. This implies that in Songea district inevery 1000 infants 136 died in 1985 and 115 in 1995.TABLE LXIX: INFANT AND U5 MORTALITY RATES BY DISTRICT INRUVUMA REGION FOR THE YEAR 1995YEAR 1985 YEAR 1995DistrictIMR U5MR IMR U5MRSongea (U) 108/1000 178/1000 37/1000 60/1000Mbinga 79/1000 126/1000 67/1000 93/1000Tunduru 131/1000 222/1000 98/1000 186/1000Songea (R) 136/1000 230/1000 115/1000 171/1000Source: Regional Medical Office-<strong>Ruvuma</strong>4.2.8 Maternal Mortality Rate (MMR)Maternal mortality is defined as the death of women whilepregnant or death within 42 days after baby born. In <strong>Ruvuma</strong>region, the maternal mortality is still a major problem facingwomen. However it is observed in Table LXX that, between1990 and 1996 the number of maternal deaths fluctuate between39 and 66 deaths. Table LXXI on the other hand attempts tohighlight the magnitude of UMR in each region in 1992 -1994. Itis noted that, UMR for <strong>Ruvuma</strong> region was relatively high in 1994compared to UMR of poor regions such as Coast, Lindi andMtwara. Maternal Mortality rate of <strong>Ruvuma</strong> region was 225 in1992, while that of Coast region was 209 and 144 for Kigomaregion.111
112
TABLE LXX: MATERNAL MORTALITY RATE OF RUVUMA REGION 1990-1996Year Number ofNumber of MaternalDeathsMaternal Mortality Rateper 100,000 BirthsBirths1990 16546 39 236/100,0001991 25760 51 198/100,0001992 27602 62 225/100,0001993 29508 58 197/100,0001994 28969 54 187/100,0001995 30453 54 187/100,0001996 29423 66 225/100,000Source: Regional Medical office <strong>Ruvuma</strong>The Maternal Mortality Rate (MMR) of <strong>Ruvuma</strong> dropped to 186deaths in every 100,000 births in 1994, which implies that theremay probably be some improvements in maternal health careprogrammes.TABLE LXXI: MATERNAL MORTALITY RATE BY REGION FOR THREECONSECUTIVE YEARS 1992,1993 AND 1994Maternal Mortality Rate (MMR) perRegion100,000 Births1992 1993 1994Arusha 102 158 114Coast 209 111 70Dar es salaam 220 308 237Dodoma 197 214 208Iringa 331 321 276Kagera 304 343 190Kilimanjaro 126 46 107Kigoma 144 155 105Lindi 262 289 193Mara 67 361 436Morogoro 289 172 190Mtwara 264 212 161Mwanza 221 186 266Rukwa 172 294 243<strong>Ruvuma</strong> 225 189 186Shinyanga 143 188 199113
Singida 242 171 238Tabora 151 185 130Tanga 255 172 220Total 199 211 1974.2.9 Immunization Coverage:The immunization programme is being carried out by the Ministryof Health in collaboration with International agents such as WHO,UNICEF and others in order to control six diseases common tochildren. The diseases are Measle, Polio, Tuberculosis,Diphtherial, Tetanus and Whopping Cough. Table LXXII belowshows the extent of immunization coverage of BCG, DPT 3POLIO and measles, TT I -s doses.TABLE LXXII: PERCENTAGE IMMUNIZATION COVERAGE OFCHILDREN 0-1 YEAR FOR BCG,DPT-3,POLIO 3 ANDMEASLES BY DISTRICT 1990-1996:BCG% DPT-3% POLIO-3% MEASLES%District1990 1996 1990 1996 1990 1996 1990 1996Songea (U) 93.2 83.7 79.1 98.7 63.7 98.7 69.7 86.8Mbinga 78.8 79.8 67.4 94.9 81.6 94.8 75.2 86.3Tunduru 89.6 84.0 93.4 60.9 89.4 62.5 86.8 65.3Songea (R) 84.7 77.0 70.5 74.2 82.6 72.9 68.9 72.9Total 86.6 81.1 77.6 82.6 79.3 82.2 75.1 77.8Source: Regional Medical Office <strong>Ruvuma</strong> 1997.TABLE LXXIII: PERCENTAGE IMMUNIZATION COVERAGE FOR DPT3-AND T. TOXOID BY DISTRICT 1990-1996:DPT-3%T.T1-5 DOSES%District1990 1996 1990 1996Songea (U) 79.1 98.7 66.6 75.8Mbinga 67.4 94.9 70.4 47.5Tunduru 93.4 60.9 87.3 38.3Songea (R) 69.6 74.2 67.8 39.2Total 77.4 82.2 73.0 50.2114
115
4.2.10 HIV - Infection and AIDS Disease:In general, the number of HIV victims and Aids Cases in <strong>Ruvuma</strong>region has increased since 1987 when the first victim wasrecognised (45 people). Mbinga district is having more HIVinfection and Aids cases than other districts. Up to 1997 thenumber of HIV and AIDS cases have increased to 2512 people inthe region. Table LXXIV shows the number of HIV and Aidscases since 1987 to 1996.TABLE LXXIV: SITUATION OF HIV AND AIDS CASES IN THE REGION,1996:District Number of AIDSCases DiagnosesReported Deaths Rate of Aids per100,000 PopulationSongea (U) 454 272 414Mbinga 1055 633 297Tunduru 291 175 131Songea (R) 712 427 212Total 2512 1507 245Source:Regional Medical Office - <strong>Ruvuma</strong>.4.3 WATER SECTORThe major water sources in <strong>Ruvuma</strong> region include Lake Nyasacovering an area of 2978 km 2 in (Mbinga district) and the greatrivers of Ruhuhu and Ruhuji. <strong>Ruvuma</strong> and Likimwa rivers inSongea district, and Nampungu, Mwambegi and Muhuwezi inTunduru district do provide water as well. The main watersources for the rural population in the region are lakes, rivers,streams, traditional wells, ponds and water springs, hand pumpwells, gravity schemes, hydro schemes and rain water harvested.116
4.3.1 Rural Water SupplyIn <strong>Ruvuma</strong> region many villages have an improved water supplyschemes. These are fairly spread through out the region. Thelevel of rural water coverage in the region is not satisfactory.Mbinga district has the lowest water coverage of only 34 percentof the rural population. The low water coverage in Mbinga districtis attributed mainly to the type of topography (mountainoushighlands) only suited by gravity schemes. Songea and Tundurudistricts mainly depend on hand pump wells, which are also easilymaintained by the local people.Water accessibility however is not a real problem in <strong>Ruvuma</strong>region as most of water sources are less than 400m from theusers. Only in dry areas does this distance increase as manytraditional sources dry up.TABLE LXXV: PERCENT OF PEOPLE GETTING WATER FROMDIFFERENT SOURCES<strong>Ruvuma</strong> Region<strong>Tanzania</strong> MainlandLevel of serviceRegion Urban Rural Total Urba RuralTotalnPiped water inside the 4.01 25.20 1.05 9.47 28.12 5.41house or villagePiped water outside the 16.54 35.17 13.93 18.85 49.97 12.07house or villageWell water in plot or 14.95 6.62 16.12 19.26 5.90 22.17villageWell water outside plot 55.40 31.02 58.82 34.24 12.38 39.00or villageOther water in plot or 0.78 1.04 0.74 5.65 0.56 6.76villageOther water outside plot 8.27 0.86 9.30 12.41 2.96 14.47or villageNot stated 0.04 0.90 0.04 0.11 0.10 0.11Total 100.00 100.00 100.00100.00 100.00100.00117
Source: Population Census 1988 ResultsOn the whole, there are 52 gravity water systems, 19 bore holesand 134 hand pumped wells, of which 38 percent, 84 percent and8 percent of the gravity system, bore hole and hand pumped wellsare not functioning respectively.TABLE LXXVI: RURAL WATER COVERAGE IN RUVUMA REGION 19961988 1996DistrictTotal Rural%populationServedPopulationservedTotalRuralPopulationPopulationServed%ServedMbinga 271,845 90485 33 329582 112058 34Tunduru 170,235 99580 59 171121 76830 45Songea (R) 254,367 138015 54 330576 155370 47Total 696447 328080 47 831279 344258 41Source: Regional Water Engineer <strong>Ruvuma</strong>It is observed from Table LXXVI that Mbinga rural populationhave less access to clean and safe water than those in otherdistricts, although percentages of the population served with cleanwater in 1996 are still low in all districts. From the table itappears no single district managed to provide clean water to morethan 47 percent of its population by the end of 1996. Mbingamanaged only 34 percent.4.3.2 Urban Water supplyThe water demand in urban towns in <strong>Ruvuma</strong> Region is currently27233 M 3 per day. Estimated urban population is 189,181 (1996estimates) people. It is reported that Songea Urban required20,000 m 3 of water per day but only 8500 M 3 of water issupplied per day, which is equivalent to only 43 percent. Similarly118
in Mbinga and Tunduru only 52 percent and 28 percent of waterdemand is supplied per day. Table LXXVII highlights thesituation of water supply in urban centres of <strong>Ruvuma</strong> Region.Table LXXVII : URBAN WATER DEMAND AND SUPPLY 1996DistrictTownPopulation(Estimate)Demand m 3per daySupply m 3 perdayShortfall m 3per daySongea(U) 135,581 20,000 8500 11500Mbinga 20000 2380 1246 1134Tunduru 33600 3870 1088 2782Total 189181 26250 10834 15416Source: Region Water Engineer <strong>Ruvuma</strong>Adequate water supply in the three towns (Songea Mbinga andTunduru) are made difficult by the continued use of the aged watermachines, inadequate supply sources as well as a rise in urbanpopulation which was not anticipated. Consequently, by the endof 1996 only 41 percent of the total urban population was servedwith water. Table LXXVIII below indicates the population of theurban people served with clean water.TABLE LXXVIII: URBAN POPULATION SERVED WITH CLEAN WATERBY DISTRICT 1988-19971988 1996DistrictTotalPopulationNoserved%ServedTotalpopulationNoserved%ServedSongea86880 34482 50 135581 56760 42(U)Mbinga 12665 4270 45 20000 10500 53Tunduru 21603 5235 24 33600 11000 33Total 121148 43987 36 189181 78260 41Source: Regional Water Engineer <strong>Ruvuma</strong>119
When compared with few selected Regions, <strong>Ruvuma</strong> appears toserve clean water to very few people in the urban centres (towns).Table shows the percent of the population in the urban townsserved with clean water in six regions.TABLE LXXIX : COMPARISON OF POPULATION WITH ACCESS TOCLEAN WATER IN FIVE SELECTED REGION 1996RegionUrbanPopulationNo PopulationServed%Served'000'<strong>Ruvuma</strong> 189181 78200 41Dodoma 156000 95000 61Mbeya 214000 161000 75Lindi 113000 93000 82Kilimanjaro 155000 77000 50Shinyanga 172000 129000 75<strong>Tanzania</strong> Mainland 4753000 321000 67Source: Regional Water Engineer <strong>Ruvuma</strong> 1996The inadequate water supply in Songea town may be solved byconstructing a dam, while in Mbinga town the Authorities shoulddraw water from Luwaita river and Tukuzi stream. For Tundurutown there is water potential at Masonya situated 5 kilometresfrom the town. Water supply in <strong>Ruvuma</strong> region is mostlyundertaken by the Government and some donor agencies such asDANIDA and UNICEF. There is also a significant contributionby the NGOs like, CDTF, SODA operating through the LocalGovernment as well as Religious organisations. Songea urbanwater supply is also being improved by the assistance from TCRS,TAMMOFA and EEC. Nevertheless, for better water supplymanagement, several water schemes are now being executed bythe local people through community participation. The localpeople are involved right from the identification and the planning of120
the project stage, cash contribution and finally the operation andmaintenance of the schemes. The number of village committeesresponsible for the management of water schemes in <strong>Ruvuma</strong>region are shown in Table LXXX.TABLE LXXX:ESTABLISHED VILLAGE WATER COMMITTEES (VWC)AND VILLAGE WATER FUNDS (VWF) BY DISTRICT 1996District Number of Number of % Number of %village V.W.CV.W.FMbinga 168 26 16 26 16Tunduru 98 49 50 33 34Songea (R) 116 47 41 47 41Total 382 122 32 106 28Source:Regional Water Engineer <strong>Ruvuma</strong>TABLE LXXXI: RURAL/URBAN SANITATION STATUS, 1996:Number ofDistrict HouseholdsHouseholdsInspectedHouseholdswithGoodLatrinesHouseholdswithBadLatrineshouseholdswithoutLatrines%CoverageofHouseholds withLatrinesSongea (R) 49,170 49,170 42,890 4,232 2,048 95.83Songea (U) 22,958 22,610 21,153 1,362 95 98.07Mbinga 54,192 50,171 48,506 5,036 650 98.80Tunduru 34,549 25,303 16,587 6,954 1,564 68.13Total 160,869 147,254 129,136 17,584 4,387 91.20Source:Regional Medical Office - <strong>Ruvuma</strong>.Table LXXXI shows the situation of sanitation (latrines) in theregion as revealed by the Latrine Promotion Report of 1996. It isobserved from the table that about 91 percent of the households in<strong>Ruvuma</strong> region had latrines in 1996. Mbinga district had the121
highest percentage compared with other Rural Districts. SongeaRural had the highest number of households without latrinesfollowed by Tunduru.122
TABLE LXXXII: BASIC FACILITIES IN RUVUMA REGION BY DISTRICT1994:Type of FacilitySongea Mbing Tundur Songea Total(U) a u (R)Nursery Schools 22 15 12 16 65Primary Schools 34 200 112 147 493Secondary Schools 4 11 5 10 30University (Out) 1 - - - 1Teachers Training Colleges 1 - - - 1Technical, Folk or Vocational5 7 6 7 25Training CentresHospitals 1 4 2 1 10Health Centres 1 5 5 7 18Dispensaries 17 56 31 45 149Health Posts 17 100 50 43 210Day Care Centres 36 8 4 21 69Guest House 94 49 37 22 202Shop 623 617 300 525 2,065Post Office 2 1 1 1 5Garages 18 4 5 3 20Butcheries 43 54 4 8 109Abattoir 1 1 1 1 4Saw Mills 12 5 4 2 23Petrol Station 7 4 3 3 17Grain Mills 138 105 22 95 360Banks 2 2 1 - 5Source: District Profiles 1996.TABLE LXXXIII:IndicatorsRegional GDP inTshs Million (1994)Per Capita Income inTshs (1994)Population GrowthRateRUVUMA REGION SOCIO-ECONOMIC INDICATORSCOMPARED WITH FIVE NEIGHBOURING REGIONS:<strong>Tanzania</strong>Mainland(Averages)<strong>Ruvuma</strong> Mbeya Iringa MorogoroLindiMtwa82,996 49,565 84,903 92,021 88,073 29,253 62,4962,138 52,537 48,737 64,502 59,370 38,340 59,532.8 3.4 3.1 2.7 2.6 2.0 1.4ra13123
Population Density 16 12 25 21 17 10 53Life Expectancy50 49 47 45 46 47 46(1988)Maternal Mortality197 186 436 276 190 193 161(1994)Infant Mortality96 143 163 187 189 218 202(1995)Crude Death Rate 14.7 12.8 13.9 15.3 13.6 14.7 12.6No. Primary Schools547 493 827 714 628 267 488(1996)Primary School74.2 79.5 79.6 80.9 69.7 58.5 54.3Gross EnrolmentRate (1996)Primary School Net54.2 56.5 56.6 62.9 48.3 46.8 54.3Enrolment Rate(1996)Illiteracy Rate (1996) 16 4.1 20.7 13.8 14.2 11.4 20.4Number of175 149 238 187 193 105 111DispensariesPeople Per10,000 7,072DispensaryNumber of Health15 18 20 19 17 12 11CentresPeople Per Health50,000 58,537CentresNumber of Hospitals 10 10 11 15 12 7 5People Per Hospital 150,000 105,367Number of Doctors 54 31 26 29 37 13 21People Per Doctor 48,000Number of Surgeon's2 1 3 1 4 2 2(1994)Accessible to Clean 50.52 47.0 48.7 48.2 48.0 59.2 84.7Water (1996)No. of Secondary30 30 39 48 38 13 13SchoolsPercent Household66 80 66 80 76 71 46with Latrines (1996)Source: Planning Commission Compiled Data 1997.124
SECTION V5.0 OTHER RELATED DEVELOPMENT ISSUES5.1 WOMEN IN DEVELOPMENT:The empowerment of women and improvement of their status inthe society are important ends in themselves and are essential forthe achievement of suitanable development. The objectives are toachieve equality and equity between men and women and toenable women to realize their full potential. Women projects in<strong>Ruvuma</strong> region are mainly supported by funds from RegionalWomen Development Fund, Songea Development Action(SODA), <strong>Tanzania</strong> Mozambique Federation (TAMOFA), TheInternational Fund for Agriculture Development (IFAD),Community Development Trust fund (CDTF), the CRDB 1996,National Bank of Commerce and UNDP. However, lack ofsufficient level of education make many projects of women fail.5.2 YOUTH IN DEVELOPMENT:Youth programmes have been introduced in <strong>Ruvuma</strong> Region since1979. By the end of 1997 there were 272 Youth groups. Thesegroups have engaged themselves in various economic activities.Some of these activities are farming, Livestock keeping, Miningand engagement in Small Scale Industries. Table LXXXIVbelow summarises the number of groups by sex in the region.125
Table LXXXIV: THE YOUTH GROUPS BY DISTRICT IN RUVUMA REGIONDistrict Number of girls Number of boys Mixed Groups TotalGroupGroup (boys and Girls)Mbinga - 7 18 25Songea34 36 26 96(R)Songea(U)3 80 31 114Tunduru 10 21 6 37Total 47 144 81 272Source:Youth programmes have tended to get financial support from theGovernment and the NGOs' and they have also provided thetraining aspect for the youth groups. Table LXXXV below showsfund allocated in each district for Youth Projects.Table LXXXV: FUND ALLOCATED IN EACH DISTRICT IN RUVUMAREGIONYear Tunduru Songea Rural Songea urban Mbinga Total1994/95 1,850 2,400 1,350 1,900 7,5001995/96 1,500 1,500 2,500 1,500 7,0001996/97 1,000 2,000 1,000 2,000 6,000Grand Total 4,350 5,900 4,850 5,400 20,500Source:5.3 COOPERATIVES DEVELOPMENT:In <strong>Ruvuma</strong> Region, there are three Cooperative Unions, (one ineach District). There is Songea Agricultural and MarketingCooperative Union Ltd. with 25 affiliated Primary CooperativeSocieties. Mbinga Cooperative Union Ltd. With 54 PrimaryCooperative Societies. Tunduru District is served by TunduruAgricultural and Marketing Cooperative Union Ltd. which has 13Primary Cooperative Societies. Songea Agricultural marketingcooperative Union Ltd. owns a tobacco factory with processing126
capacity of 8,000 tons. The factory has a capacity of employingbetween 1,500 - 1,800 people. Coffee Curring Factory inMbinga is owned by MBICU and has a capacity of processing10,000 tons per year. Tunduru agricultural and Marketing CooperativeUnion has one cashewnut factory which is notfunctioning due to low production of cashewnuts.5.4 NON GOVERNMENTAL ORGANIZATIONALACTIVITIES IN THE REGION:The Region has more than 40 Non Governmental Organizationsperforming Various/different economic and social activities .Some of the activities includes the provision of agricultural skills,education, health facilities, road construction, food storageconstruction and modern house roofing. The PEHOLE-Tiles isfamous for house roofing.DONORS SUPPORT IN RUVUMA REGION:DonorActivity undertakenUNICEFChild Survival protection and DevelopmentEECSongea - Mitomoni road" Rural road Programme" Masasi - Tunduru - Songea - Mbinga" Mbamba-Bay Road" Construction of the Storage facilitiesFAOFinancial Storage ProgrammeDANIDARural Water ProgrammeSongea Development action(SODA)CARITASIFADIDACODEWFPUNDPIntergrated Rural Development ProgrammeIntroduction of Cattle in Songea DistrictAgricultural ProjectsPrimary School Rehabilitation ProgrammeEducation ProgrammeLivestock ProgrammeEnvironmental Conservation Programme127
Christian Social Services(CSSC)GTZBenedictine Fathers(Peramiho)WINOTunduru district Health ProgrammeSelon Conservation ProgrammePublic Health Care and Medical SuppliersAgricultural, Health, Cooperative Savings andCredit Scheme.5.5 INVESTMENT POTENTIAL SECTORS:5.5.1 Agriculture:<strong>Ruvuma</strong> region covers an area of 63,498 sq km; of which 50,836sq kms are arable land. Thus, the arable land is about 84 percentof the total area. Studies conducted reveal that out of 50,836 sqkm of the arable land only 3000 sq km are under cultivation. Itmeans 47,836 sq km (78 percent) of the arable land are idle.Potential crops for further development are coffee, tobacco andcashewnuts. Irrigation potential is also possible along lake Nyasa.There are 13,000 suitable hectares for paddy and sugar cane atChiulu and Lundo basins in Ruhekei division in Mbinga district.Other paddy irrigation potential areas include 18,000 ha. of riverplains in Tunduru district and 2000 hectares for sugar cane inLiganga and Hanga plains in Songea district.5.5.2 Livestock:Growth in livestock has been going on at a very low pace duringthe last decades. The potential exists for more and betterlivestock production. Therefore investments in livestock arewelcome especially in meat processing industries, tanneries andassociate industries such as shoe factories.128
5.5.3 NATURAL RESOURCES:(a)(b)Forestry:Natural forest in the region is fast disappearingdue to over cutting of trees for various domestic usesincluding tobacco curing. Thus, investments are requiredin the afforestation programmes.Fishing:5.5.4 POWER SUPPLY:An area of 2,979 Sq. Km. are covered by waterin the region, which makes the region one of the fewregions with fish potential. Potential Industries in fishprocessing recommended are fish drying, canning and fishfreezing. And the associated Industries includes boatmaking and fishing gear. Lake Nyasa provides the majorfishing ground, with fishing potential of 100 tonnes peryear.Some Min-hydropower of 12 MW. could be produced bydeveloping Nakatuta in Songea district, following studiesconducted by KFW Consultant from Germany. However, thedemand for power in Songea and Mbinga is over 12 MW.5.5.5 MINERALS:There are huge mineral deposit potentials in Tunduru and Mbingadistricts. Mineral deposits includes various gemstones, coal, gold,diamond and building minerals. However, these deposits require129
further exploration work in order to confirm existing potentials,tonnage, grade and quality.5.5.6 INDUSTRIAL ACTIVITIES:Coffee and tobacco factories require further expansion. With theincrease of coffee production the establishment of another coffeecuring factory is inevitable. Also the increase of tobaccoproduction from 13,400 tons in 1996/97 to 30,000 tons in 2001will necessitate the establishment of other three tobaccoprocessing factories. The existing factory has a capacity of 6,000tons only. The cashewnut processing factory at Tunduru is notworking and this gives a lot of potential in cashewnut processingfactories in Tunduru district to be built.5.5.7 TRADE:<strong>Ruvuma</strong> communication network has improved for the last 10years. The regional headquarter (Songea) is linked by a tarmacroad from Songea to Dar es Salaam, gravel road from Songea toMbinga - Mbamba-Bay Road, Songea - Tunduru road and earthroads from Songea to rural areas. The region is also linked bysteamer services between Malawi ports and Itungi Port in Mbeya.Existing Transport and Communication system in the region isenough attraction to potential investors. The region will in the nearfuture be linked by gravel road from Masasi to Songea andMbamba Bay. This step will extend the volume of trade in theregion.130