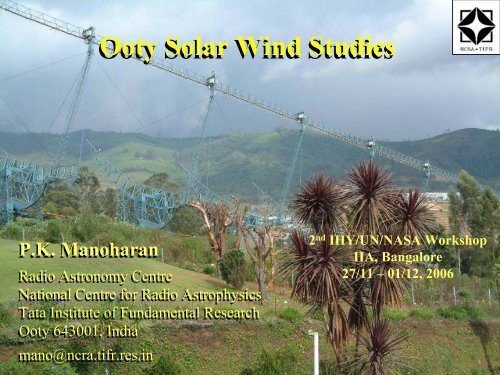
Ooty Solar Wind Studies - Indian Institute of Astrophysics
Ooty Solar Wind Studies - Indian Institute of Astrophysics
Ooty Solar Wind Studies - Indian Institute of Astrophysics
- No tags were found...
Create successful ePaper yourself
Turn your PDF publications into a flip-book with our unique Google optimized e-Paper software.
Interplanetary ScintillationRadio sourceL-O-SSunEarth
IPS temporal spectrum provides• spatial spectrum <strong>of</strong> density turbulence• radio source size (size cut-<strong>of</strong>f)• solar wind speedscintillationI(t)Time
<strong>Solar</strong> wind Density Spectrum and Speed• For a radio source <strong>of</strong> known size(q source = 2πf/V and Φ(q) ~ q -α )– source-size cut<strong>of</strong>f on the temporal spectrumprovides the solar wind speed– Power - Frequency distribution gives shape <strong>of</strong>the spatial spectrum <strong>of</strong> density turbulence
<strong>Solar</strong> wind Density Turbulence(also spectrum)Density Turbulence* Scintillation index, m, is a measure <strong>of</strong> level <strong>of</strong> turbulence* Normalized Scintillation index, g = m(R) / * Quasi-stationary and transient/disturbed solar wind• g > 1 → enhancement in δNe• g ≈ 1 → ambient level <strong>of</strong> δNe• g < 1 → rarefaction in δNeScintillation enhancement w.r.t. theambient wind identifies the presence<strong>of</strong> the CME along the line-<strong>of</strong>-sightdirection to the radio source
Scintillation Temporal Spectrum
f -apower @ large-scalepower @ small-scalespeed
power @ large-scalepower @ small-scalespeed
PKS1445-161power @ large-scalepower @ small-scalef -aspeed
<strong>Solar</strong> <strong>Wind</strong> Speed and Density Fluctuations (10 – 50 R )• Acceleration <strong>of</strong> speed is observed up to ~30 R • Acceleration pr<strong>of</strong>ile <strong>of</strong> high-speed wind: shows quick risewithin ~20 R ; it is different from the low-speed wind;• Scale size <strong>of</strong> irregularities a >100 km dominates at R < 20 R • Scale size a 20 R • Spectrum <strong>of</strong> spatial density turbulence becomes steeper withdistance from the Sun– Radial evolution <strong>of</strong> the spectrum (or dissipation <strong>of</strong> energy)is important to understand the solar wind acceleration– Useful to constrain solar wind acceleration model
<strong>Solar</strong> <strong>Wind</strong> Density Turbulence and Speed (3 days)
δn e mapCR 2041
<strong>Solar</strong> wind speed synoptic mapCR 2041
<strong>Ooty</strong> IPS measurements: Density Turbulence and Speed<strong>of</strong> the <strong>Solar</strong> <strong>Wind</strong> in the Inner heliosphereCR2027February 25 –March 25, 2005
1<strong>Solar</strong> Cycle 23
<strong>Solar</strong> Cycle 23 – <strong>Solar</strong> <strong>Wind</strong> Density DistributionAp
Radial Evolution <strong>of</strong> CIRs75 solar radii100 solar radiiexpansion150 solar radii
<strong>Solar</strong> Cycle 23 – <strong>Solar</strong> wind Speed Distribution
Latitudinal Structure <strong>of</strong> CIRs• With heliocentric distance, interaction becomes stronger.• The interaction observed at latitudes away from the solarequator is caused by the tilt <strong>of</strong> the solar magnetic dipolerelative to the solar rotation axis.• The wind outflow from the Sun is structured as a function <strong>of</strong>solar magnetic latitude [e.g., Pizzo 1994].• With increasing heliocentric distance, the interaction regionsexpand in the directions transverse to the interfaces.
Coronal Mass Ejections Largest phenomenon associated with the dissipation <strong>of</strong>magnetic flux at and above the surface <strong>of</strong> the Sun Travel outward at range <strong>of</strong> speeds, 10 -- 2500 km/s Mass involved in each ejection is ~10 14 –10 15 g Main cause <strong>of</strong> large geo-magnetic storms CMEs appear to be an important factor <strong>of</strong> space weather,which has multiple geospheric, biospheric, and technologicaleffects. A great interest in understanding the propagation and arrival<strong>of</strong> Earth-directed CMEs, which cause major storms at theEarth’s magnetosphere. However, there are many open questions concerning CMEsorigin, evolution, structure/extent in the interplanetary space To progress in understanding the effects <strong>of</strong> CMEs requiresdetail 3-D data on them from Sun to Earth
IPS Imaging <strong>of</strong> interplanetary disturbances (CIRs and CMEs)Radio SourceShockSunCMEEarth
Radial Evolution <strong>of</strong> CMEs– LASCO and IPS measurements between Sunand 1 AU– Halo and Partial Halo CMEs– ICME at 1 AU (<strong>Wind</strong> and ACE data)– Initial Speeds in the range 250 – 2600 km/s
June 25, 1992West Limb CME on June 25, 1992* X3.9 Flare, X-ray LDEType-IVManoharan et al. ApJ., 2000
Some example <strong>of</strong> November 2003 CMES
Fast CME on April 2, 2001: <strong>Ooty</strong> Images
CME in the interplanetary mediumLASCO Images
CME Propagation Speed (from Sun to Earth)Height – Time plotRadial Evolution <strong>of</strong> SpeedK.E. lost/dissipated within 100 R
LASCOGopalswamy et al. 2005A fast CME EventJanuary 20, 2005
Speed Pr<strong>of</strong>iles: V CME(R)V CME(R) <strong>of</strong> 30 CMEs• IPS & LASCO provide sky-plane speeds• Include constant speed, accelerating anddecelerating events•V CME(R) can be represented by power-lawforms:V CME(R) ~ R -βR < 50 R (Manoharan 2006)decelerationconstant speedaccelerationV CME(R) ~ R -α• 2-step effective accelerationR ~ 100 - 200 R • Transition around 70 – 80 R • at R < 70 R : -0.3 < β < +0.06• at R > 70 R : -0.76 < α < 0.58• slope > 0 : acceleration• slope < 0 : deceleration• index ‘β’ shows no significant dependenceon the initial speed <strong>of</strong> the CME• index ‘α’ shows dependence on the initialspeed
CME Initial Speed vs Acceleration Slope at R > 70 R deceleration zoneV = 380 km/sα = 0.2-6.4×10 -4 V+1.1×10 -7 V 2acceleration zone‘zero’ acceleration lineAerodynamic drag force:Interaction between the CME cloudand the ambient solar wind plays animportant role in the propagation <strong>of</strong>CMEsK.E. utilized/gained times α against the“drag force” imposed by the ambientsolar wind [~ (V CME–V AMB) 2 ] showsgood linear correlation (~97%)
Initial Speed – Arrival Time at 1 AUT CME = 109 - 0.5 × 10 -1 V CME + 1.1 × 10 -5 V 2 CME hoursV CME = 400 km/s, T CME = 90 hours (considerable assistance by CME expansion)V CME = 2000 km/s, T CME dominated by interactionIncludes energy provided by CME Expansion + SW interaction
Axial ratio, AR, greater than 1.25 is indicated by ellipse.The ratio <strong>of</strong> major to minor axes indicates the anisotropy.Axial ratio is large at regions where the CME interactswith preceding CME(s)
Three-dimensional view <strong>of</strong> CME
CME Propagation - summary• CME Speed pr<strong>of</strong>ile, V(R), shows dependence on initial speed• CME goes through continuous changes, which depend on CMEinteraction with the surrounding solar wind• Arrival time and Speed <strong>of</strong> the CME at 1 AU predicted by the speedpr<strong>of</strong>ile are in good agreement with measured values• Mean travel time curve for different initial speeds suggests that upto a distance <strong>of</strong> ~80 Rsun, the internal energy <strong>of</strong> the CME (or itsexpansion) dominates and however, at larger distances, the CME'sinteraction with the solar wind appears to control the propagation• Most <strong>of</strong> the CMEs tend to attain the speed <strong>of</strong> the ambient flow at1 AU or further out.• These results are useful to quantify the ‘drag force’ imposed on theCME by the interaction with the surrounding solar wind and it isessential in modeling the CME propagation.• Present study also indicates, Size <strong>of</strong> CME, a CME ~ R 1.0• Large anisotropy seems to be associated with the turbulence caused bythe CME-CME interaction.
Thank you
Spectra associated with ambientlow- and high-speed solar wind flows<strong>Solar</strong> windDensity turbulence spectrumDensity turbulence spectrum associatedwith propagating CMEcut-<strong>of</strong>f (inertial) scale = V A /ω P= N –1/2V A Alfven speedω P Proton cyclotron frequencyN Plasma density


