COUNT BACK LINE STOP LOSS
COUNT BACK LINE STOP LOSS
COUNT BACK LINE STOP LOSS

Create successful ePaper yourself
Turn your PDF publications into a flip-book with our unique Google optimized e-Paper software.
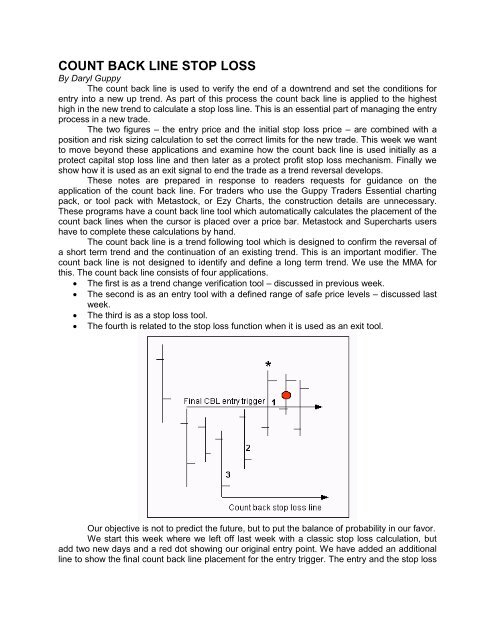
<strong>COUNT</strong> <strong>BACK</strong> <strong>LINE</strong> <strong>STOP</strong> <strong>LOSS</strong>By Daryl GuppyThe count back line is used to verify the end of a downtrend and set the conditions forentry into a new up trend. As part of this process the count back line is applied to the highesthigh in the new trend to calculate a stop loss line. This is an essential part of managing the entryprocess in a new trade.The two figures – the entry price and the initial stop loss price – are combined with aposition and risk sizing calculation to set the correct limits for the new trade. This week we wantto move beyond these applications and examine how the count back line is used initially as aprotect capital stop loss line and then later as a protect profit stop loss mechanism. Finally weshow how it is used as an exit signal to end the trade as a trend reversal develops.These notes are prepared in response to readers requests for guidance on theapplication of the count back line. For traders who use the Guppy Traders Essential chartingpack, or tool pack with Metastock, or Ezy Charts, the construction details are unnecessary.These programs have a count back line tool which automatically calculates the placement of thecount back lines when the cursor is placed over a price bar. Metastock and Supercharts usershave to complete these calculations by hand.The count back line is a trend following tool which is designed to confirm the reversal ofa short term trend and the continuation of an existing trend. This is an important modifier. Thecount back line is not designed to identify and define a long term trend. We use the MMA forthis. The count back line consists of four applications. The first is as a trend change verification tool – discussed in previous week. The second is as an entry tool with a defined range of safe price levels – discussed lastweek. The third is as a stop loss tool. The fourth is related to the stop loss function when it is used as an exit tool.Our objective is not to predict the future, but to put the balance of probability in our favor.We start this week where we left off last week with a classic stop loss calculation, butadd two new days and a red dot showing our original entry point. We have added an additionalline to show the final count back line placement for the entry trigger. The entry and the stop loss
calculation occur simultaneously. Once the entry is made, and prices move to a new high that ishigher than bar, the count back line calculation starts again.The stop loss line calculation is still based on bar 1 because neither of the two bars tothe right is higher than bar 1. The fact that some of these new bars are lower than bar 1 isunimportant. In tracking a new rising trend our interest is in the relationship between new highsas these define the limits of bullish strength.The next diagram shows several features of the calculation. First the shift in thesignificant bar to the right. The new high means this bar is now bar 1. We complete the stop losscalculation by moving down to the bottom of this bar and then moving back to the left to the nextlowest bar. This is shown as bar 2. In the calculation in the first example above this bar wasirrelevant. Now it becomes part of the calculation because it is the first lowest bar after the newbar 1.We move down to the bottom of bar 2 and across to the left until we hit the next lowestbar. This means we ignore bar A, because it has a higher low than bar 2. We also ignore bar Bbecause the low is equal to the low of bar 2. It is not until we hit bar C that we find the nextsignificant bar. We move to the bottom of this bar and draw a line to the right to define the newstop loss point.The stop loss application is the exact reverse of the entry calculation. We use thehighest high in the series as the starting point, and then calculate the cumulative three dayrange using the next two significant bars. The calculation may extend over many more calendardays before we locate the significant bars.The second point to note in this chart is that the calculation still acts as a protect capitalstop loss. Should prices fall below this level we would exit the trade at a loss even though thecurrent closing price suggests the trade is in profit when compared with the red dot showing ourentry point.The purpose of the count back line stop loss calculation is to provide a signal that tellsus the new up trend has ended. We get to act on this signal the next day in the market. Whilethe stop loss line is below our original entry point the trade is still technically a loser that puts ourtrading capital at risk.
As each new higher high is made, the count back line calculation is recalculated. Thisexample illustrates two significant features. The first is the way the gap between bar 2 and bar 3is ignored. When we encounter a gap we move to the next lowest bar in the current trend. Thecount back line is designed to give us information about the current trend so there is no value inextending the line all the way across to the left until we hit another trend.The second feature is the way the nature of the count back line calculation has changed.It is no longer a protect capital stop loss. The count back line is now above the red circle of ourentry point. This trade is now fully in profit. If we were to act on the exit signal generated by aclose below the count back line the trade would now be closed with a small profit.
Until the new up trend comes to an end, the count back line now retains this newcharacter and acts as a protect profit trailing stop loss. This change in character also provides anew entry signal in the Grow-Up money management strategy discussed in Better Trading.The count back line can also be applied to a rising trend in mid trend as a way ofconfirming the trend strength and managing the trade. We do not need to apply it just tobreakout situations. The green dot shows an entry point in the developing up trend. The countback line protects profit stop loss for the trade entered at the red dot is used to set the stop losspoint at the bottom of bar 3. This bar is significant for both trades. A close below the linesuggests the up trend is weakening and signals an exit. The first trader gets out with a profit.The second trader exits with a small loss.The new trader who entered on the green dot applies the same management techniquesas the trader who entered with the red dot. His new trade does not become profitable until thevalue of the trailing stop loss line rises above the entry point.A close below the count back line suggests the trend is changing direction. It is an earlywarning that it is time to get out. The dip with bar B is not an exit signal because the close is stillabove the value of the count back line. The close with bar A is below the count back line andsignals an exit on the next day of trading.This is often difficult to act upon because greed gets in the way. This is particularly so ifthe next day opens higher. We look for excuses to hang on and in certain circumstances, asshown below, this is acceptable. However, generally we should use this as an exit signal unlessthere are exceptional circumstances. Just as the count back line did not get us in at the verypivot point low of the downtrend; it will not get us out at the very pivot point high of the up trend.
Some traders tend to use the count back line as stand alone indicator and this result infalse exits from strong trends. This is a misapplication of the technique. When we applied thecount back line as an entry tool we stressed the need to verify the signals with another indicator.We prefer to use the Guppy Multiple Moving Average to confirm the end of the downtrend andthe potential for a new up trend. The count back line helps to set exact entry conditionsThe same thinking is applied to exit signals generated when the count back line hasturned into a protect profit stop loss. The signal should be verified with another indicator toprevent false exits.Traders should note that at the critical point where a downtrend changes to an up trend,we do not verify any exit signal with a second indicator. While the count back line acts as aprotect capital stop loss we act immediately on any exit. This is the weakest part of any newtrend, and the most dangerous from a trading perspective. The risk of new trend failure isalways high so we focus entirely in protecting capital.As soon as the exit signal is generated by a close below the trailing stop loss count backline the trader immediately changes the application of the count back line technique. It reverts to
its entry tool application. The significant bar is now the lowest bar in the new trend, shown bythe * and marked as bar A. The next two significant bars are shown as bars B and C.What new trend? The new trend starts as soon as the old trend is finished. The end ofthe old up trend is signaled by the close below the count back line trailing stop loss, so bydefinition the new price action is a down trend until it is able to close above the new count backline applied as an entry tool.This has several applications. The first is the classic end of up trend exit confirmed byother indicator combinations. In this application we continue following the downtrend down,making a new count back line calculation with every new lower low and looking for a verifiedsignal of a trend change. This takes us back to the very first chart in the first of this series ofnotes.The second application applies to traders working with the temporary dip in a majortrend. Here the other indicators do not confirm a trend change. This dip signals the potential fora cheaper entry into an established trend, shown by the black dot. The entry point is confirmed,along with trend strength, by a close above the new count back line. Waiting for thisconfirmation also adds confirmation to the other trend indicators and reduces the risk in thetrade.As soon as there is a close above the count back entry line the trader immediatelyapplies the count back line as a stop loss tool. The significant bars are shown as 1, 2 and 3. A
new trend has been established and will remain in place until there is a close below the newstop loss line.This final example shows how the count back line, by itself, can trigger whipsaw entriesand exits. It is acceptable in this situation because we are trying to stay with a strong trend asverified by other indicators. This whipsaw condition is not acceptable if we are trying to enterinto a new breakout trade.Verification from additional indicators is an important modifier in the application of thecount back line technique.The count back line applies equally as effectively to trades from the short side as totrades from the long side. In the example shown, the count back line calculation remains thesame, starting with the pivot point low in the new downtrend. However, a close above this lineno longer signals an entry. For the trader going short with an entry at the green dot, a closeabove this line signals an exit from short positions because it suggests there is an increasedprobability that the downtrend has turn into an up trend.We have just one more application of the count back line technique and that covers itsapplication to IPO trading. We look at this next week.TRADING TECHNIQUESCBL <strong>STOP</strong> <strong>LOSS</strong>This stop loss rule uses the range activity of the stock to set a stop loss point. The range is thedistance between the high and the low for the day. It is calculated using the Count back Line approach.Taking the most recent highest high in the intermediate term trend the stop loss point is calculated bycounting back three lower bars. The horizontal line drawn at the bottom of the third bar is the stop losspoint. This stop loss is not related to the 2% rule. The line suggests the conditions where the trend maybe weakening. When used with open profits, it provides an exit signal to protect those profits.