<strong>Winthrop</strong>-<strong>University</strong> <strong>Hospital</strong> 2011 <strong>Annual</strong> <strong>Report</strong>Growth in overall employment, and for the medical staff as well, reflects avibrant clinical environment. Our people enjoy working at <strong>Winthrop</strong>.One of the busiest hospitals on LI, <strong>Winthrop</strong> has been able to consistently lowerlength of stay for our patients, especially compared to other teaching hospitals.Length of Stay(average per day)Number of <strong>Winthrop</strong> Employees5,3025,665 5,993 6,217 6,619Number of <strong>Winthrop</strong> 5.89 5.97 Medical Staff5.69 Length of Stay(average number of days)5.166.33 6.246.21,6001,5501,5001,4001,3005.85.8PMS 431 PMS 618 PMS 7419 PMS 5635.45.45.05.0ployees6,619’07 ’08 ’09 ’10 ’11Source: <strong>Winthrop</strong>St. FrancisNumber of <strong>Winthrop</strong> Medical Staff1,6001,5501,5001,4001,3004.610,0009,0008,000’09Q1North Shore’09Q2’07 ’08 ’09 ’10 ’11<strong>Winthrop</strong>75th Percentile Teaching <strong>Hospital</strong>Median Teaching <strong>Hospital</strong> 25th Percentile Teaching <strong>Hospital</strong>Source: <strong>Winthrop</strong>’09Q3’09Q4’10Q1’10Q2’10Q3’10Q4Discharges 2011(average (less newborns) per month)’11Q1’11Q2’11Q3Source: AAMC Council of Teaching <strong>Hospital</strong>s (COTH), Quarterly Survey of <strong>Hospital</strong> Operations, 2011 Q449,038<strong>Winthrop</strong>Stonybrook33,85231,673South NassauBrookhavenSt. Francis’11Q44.64.2120001100010000900080005000040000300007,0006,00022,75120,83917,96970006000200005,0004,000’08Q4NSUH Manhasset’09Q1’09Q2<strong>Winthrop</strong>’09Q3Stony Brook’09Q4’10Q1South Nassau’10Q2NUMC’10Q3’10Q4St. Francis’11Q1’11Q2’11Q35000400010000’11’07 ’08 ’09 ’10 ’11Source: <strong>Winthrop</strong><strong>Winthrop</strong> Source: Nassau-Suffolk <strong>Hospital</strong> Council75th Percentile Teaching <strong>Hospital</strong>Median Teaching <strong>Hospital</strong> 25th Percentile Teaching <strong>Hospital</strong>038Source: Nassau Suffolk <strong>Hospital</strong> Council, <strong>Hospital</strong> Statistics and Service Utilization <strong>Report</strong>, Dec. 2011
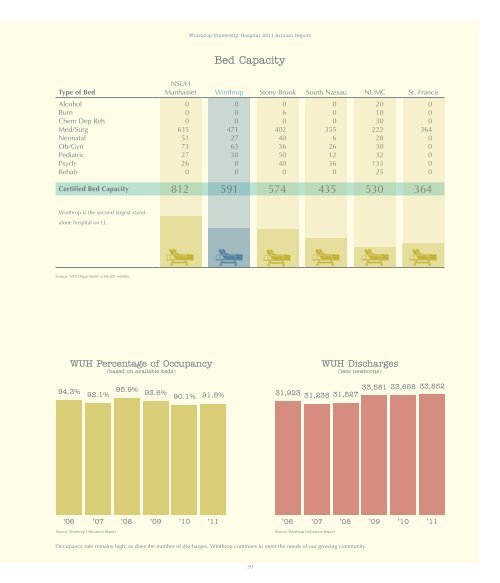
<strong>Winthrop</strong>-<strong>University</strong> <strong>Hospital</strong> 2011 <strong>Annual</strong> <strong>Report</strong>Bed CapacityType of BedNSUHManhasset <strong>Winthrop</strong> Stony Brook South Nassau NUMC St. FrancisAlcohol 0 0 0 0 20 0Burn 0 0 6 0 10 0Chem Dep Reh 0 0 0 0 30 0Med/Surg 635 471 402 355 222 364Neonatal 51 27 40 6 28 0Ob/Gyn 73 63 36 26 30 0Pediatric 27 30 50 12 32 0Psych 26 0 40 36 133 0Rehab 0 0 0 0 25 0Certified Bed Capacity 812 591 574 435 530 364PMS 5405PMS 5405PMS 542 PMS 542PMS 431 PMS 431PMS 618 PMS 618PMS 7419PMS 7419 PMS 563 PMS 563<strong>Winthrop</strong> is the second largest standalonehospital on LI.Source: NYS Department of Health websiteWUH Percentage WUH Percentage of Occupancy of Occupancy(based on (based available on beds) available beds)WUH DischargesWUH Discharges(less newborns) (less newborns)94.3% 94.3% 95.9% 95.9% 92.1% 92.1% 93.6% 93.6% 90.1% 90.1% 91.5%33,581 33,581 33,658 33,658 33,852 33,85291.5% 31,923 31,923 31,238 31,238 31,527 31,527’06 ’06 ’07 ’07 ’08 ’08 ’09 ’09 ’10 ’10 ’11Source: <strong>Winthrop</strong> Source: Utilization <strong>Winthrop</strong> <strong>Report</strong> Utilization <strong>Report</strong>’11 ’06 ’06 ’07 ’07 ’08 ’08 ’09 ’09 ’10 ’10 ’11 ’11Source: <strong>Winthrop</strong> Source: Utilization <strong>Winthrop</strong> <strong>Report</strong> Utilization <strong>Report</strong>Occupancy rate remains high, as does the number of discharges. <strong>Winthrop</strong> continues to meet the needs of our growing community.39