ArticleDo Lasers Bring Light Underneath theCanopy?Laser scanning systems, also known as Lidar,which work with laser rays have so far beenrestricted to airborne systems. As in Radar, therun time of the transmitted and then backscatteredlaser ray is measured. The backscatteringof the Lidar signal takes place not only in onemain backscattering layer, but on differentlevels. Thus, a digital elevation model as wellas a digital surface model containing buildingsand vegetation can be generated with laserscanning.Due to the split of the signal in differentbackscattering levels, Lidar is suitable for identifyingvegetation composition, especially foreststructure. Here scientists see great potential,not yet fully known and still a topic of research.Due to its high accuracy, laser scanning is alsoused to monitor changes on the glacier surface,such as the appearance of crevasses, whichindicate instability of the glacier tongue and canrepresent a possible danger to people.A disadvantage is that the laser beam has arestricted range which comes up against itslimits in the Alpine environment. Additionally, itis difficult, costly and dangerous to operate airbornesensors in the Alps.Spaceborne and Airborne RemoteSensing as an Early Warning System?Neither Lidar, Radar, nor optical systems aresuitable for early risk warning systems. Dueto their limited temporal revisiting time, possibleatmospheric and geometric problems inthe images, as well as the time necessary forprocessing and analysis, remote sensing doesnot fulfil the requirements of an early warningsystem.However, it is very valuable in determiningrisk potential and risk disposition, and identifyingpossible sources of high mountain hazards.DInSAR can, for example, determineunstable slopes while optical sensors are wellsuited to detect periglacial lakes which are adanger when the moraine dam breaks.They are therefore suitable for identifyingplaces where an in situ early warning systemshould be installed. Once damage to infrastructureand settlement has happened,remote sensing is helpful in determining itsdimensions.ResuméWhile optical remote sensing is a well-establishedtechnique, Radar and Laser scanningsystems and their application are a topic ofcurrent research that will provide many waysof tracing climate change in the Alps.Due to their long-standing availability andlimited temporal repetition rate, passive opticalsystems, notably multispectral, are moreFigure 3: Growth of a periglacial lake in the Bernina Range between 1976 and 1999, derived from LandsatMSS and ETM+ data. (copyright: K. Spannraft)suitable for looking at long-term changes insurface cover and land use change. In termsof surface cover changes, they have theadvantage of large time series and largesurface coverage as well as established techniquesof analysis.Radar and Lidar systems have higher temporalrepetition and reliability, and due to theirmeasurement of run time and sensor-targetdistance, they are suitable for identifying locationsat risk of mass movements. Comparisonof Radar data over a long period of time isdifficult due to reduced coherence.Remote sensing cannot substitute for in situsensors for hazard prediction, but can contri -bute to the assessment of the places wherethese sensors need to be installed.Both passive and active remote sensing systemshave value and a future in the tracingof climate change in the Alps and can complementone another.Essential for all kinds of remote sensing applicationsis available ground truth data to confirmthe observations made with the help ofsatellite images.The WorkshopWithin the framework of the EGEA Congressin April <strong>2010</strong>, a three-day workshop was heldon the application of optical remote sensingin the Alps with regard to climate change. Thefocus was on optical remote sensing, as theparticipants were mostly novice and time wasshort. In addition, the workshop used freewareand freely-available data, which iseasier to get for optical remote sensing.The European Geography Association forStudents and Young Geographers (EGEA)forms a network around Europe. The mainfocus is to exchange information and know -ledge for geography students and younggeographers. EGEA tries to promote geographywithin Europe and encourages scientificas well as cultural exchanges between differentcountries and cities.The topic of the workshop was chosenbecause remote sensing is an important toolin different areas of geography, especiallyurban planning, land use classification andnatural hazards. The goals of the workshopwere gathering knowledge about climatechange and creating awareness of the impactsof climate change in the Alps. The participantswould learn the basics of optical remote sen -sing, be able to understand the behavior ofsurfaces on multispectral images and learnhow to monitor the environment. The know -ledge was imparted via two practical exerci -ses, presented below. The workshop concludedwith a visit to Dr. Marc Zebisch at theEurac, who emphasized the necessity ofground truth in gaining valuable informationfrom remote sensing data.Monitoring Vegetation Stress withthe NDVIOne topic related to the expected climatechange is an increase in hot and dry summers.Climate change predictions assume thathot and dry summers, such as in 2003, willbecome more frequent in Europe. Droughtscause water stress to plants and have a negativeeffect on their vitality. A possible way ofmeasuring the vitality of plants is the norma -lized difference vegetation index (NDVI) whichuses the red and near infrared (NIR) bands in22<strong>September</strong> <strong>2010</strong>
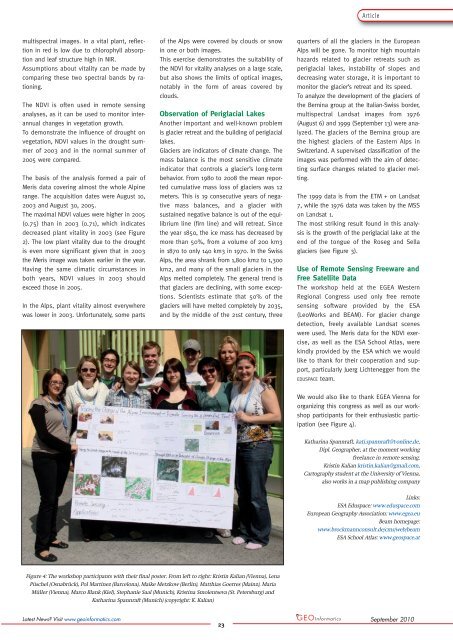
Articlemultispectral images. In a vital plant, reflectionin red is low due to chlorophyll absorptionand leaf structure high in NIR.Assumptions about vitality can be made bycomparing these two spectral bands by ra -tioning.The NDVI is often used in remote sensinganalyses, as it can be used to monitor interannualchanges in vegetation growth.To demonstrate the influence of drought onvegetation, NDVI values in the drought summerof 2003 and in the normal summer of2005 were compared.The basis of the analysis formed a pair ofMeris data covering almost the whole Alpinerange. The acquisition dates were August 10,2003 and August 30, 2005.The maximal NDVI values were higher in 2005(0.75) than in 2003 (0.71), which indicatesdecreased plant vitality in 2003 (see Figure2). The low plant vitality due to the droughtis even more significant given that in 2003the Meris image was taken earlier in the year.Having the same climatic circumstances inboth years, NDVI values in 2003 shouldexceed those in 2005.In the Alps, plant vitality almost everywherewas lower in 2003. Unfortunately, some partsof the Alps were covered by clouds or snowin one or both images.This exercise demonstrates the suitability ofthe NDVI for vitality analyses on a large scale,but also shows the limits of optical images,notably in the form of areas covered byclouds.Observation of Periglacial LakesAnother important and well-known problemis glacier retreat and the building of periglaciallakes.Glaciers are indicators of climate change. Themass balance is the most sensitive climateindicator that controls a glacier’s long-termbehavior. From 1980 to 2008 the mean repor -ted cumulative mass loss of glaciers was 12meters. This is 19 consecutive years of negativemass balances, and a glacier withsustained negative balance is out of the equilibriumline (firn line) and will retreat. Sincethe year 1850, the ice mass has decreased bymore than 50%, from a volume of 200 km3in 1870 to only 140 km3 in 1970. In the SwissAlps, the area shrank from 1,800 km2 to 1,300km2, and many of the small glaciers in theAlps melted completely. The general trend isthat glaciers are declining, with some exceptions.Scientists estimate that 50% of theglaciers will have melted completely by 2035,and by the middle of the 21st century, threequarters of all the glaciers in the EuropeanAlps will be gone. To monitor high mountainhazards related to glacier retreats such asperiglacial lakes, instability of slopes anddecreasing water storage, it is important tomonitor the glacier’s retreat and its speed.To analyze the development of the glaciers ofthe Bernina group at the Italian-Swiss border,multispectral Landsat images from 1976(August 6) and 1999 (<strong>September</strong> <strong>13</strong>) were analyzed.The glaciers of the Bernina group arethe highest glaciers of the Eastern Alps inSwitzerland. A supervised classification of theimages was performed with the aim of detec -ting surface changes related to glacier mel -ting.The 1999 data is from the ETM + on Landsat7, while the 1976 data was taken by the MSSon Landsat 1.The most striking result found in this analysisis the growth of the periglacial lake at theend of the tongue of the Roseg and Sellaglaciers (see Figure 3).Use of Remote Sensing Freeware andFree Satellite DataThe workshop held at the EGEA WesternRegional Congress used only free remotesensing software provided by the ESA(LeoWorks and BEAM). For glacier changedetection, freely available Landsat sceneswere used. The Meris data for the NDVI exercise,as well as the ESA School Atlas, werekindly provided by the ESA which we wouldlike to thank for their cooperation and support,particularly Juerg Lichtenegger from theEDUSPACE team.We would also like to thank EGEA Vienna fororganizing this congress as well as our workshopparticipants for their enthusiastic participation(see Figure 4).Katharina Spannraft, kati.spannraft@t-online.de,Dipl. Geographer, at the moment workingfreelance in remote sensing.Kristin Kalian kristin.kalian@gmail.com,Cartography student at the University of Vienna,also works in a map publishing companyLinks:ESA Eduspace: www.eduspace.comEuropean Geography Association: www.egea.euBeam homepage:www.brockmannconsult.de/cms/web/beamESA School Atlas: www.geospace.atFigure 4: The workshop participants with their final poster. From left to right: Kristin Kalian (Vienna), LenaPüschel (Osnabrück), Pol Martinez (Barcelona), Maike Metzkow (Berlin), Matthias Goerres (Mainz), MariaMüller (Vienna), Marco Blank (Kiel), Stephanie Saal (Munich), Kristina Smolentseva (St. Petersburg) andKatharina Spannraft (Munich) (copyright: K. Kalian)Latest News? Visit www.geoinformatics.com23<strong>September</strong> <strong>2010</strong>