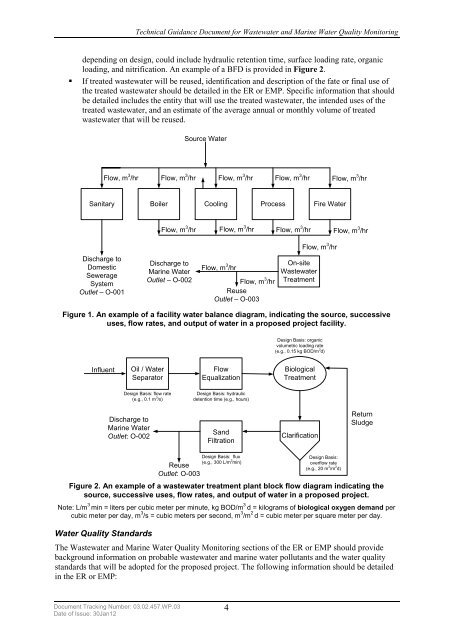
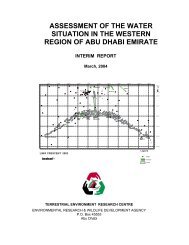
<strong>Technical</strong> <strong>Guidance</strong> <strong>Document</strong> <strong>for</strong> <strong>Wastewater</strong> <strong>and</strong> <strong>Marine</strong> <strong>Water</strong> Quality Monitoringdepending on design, could include hydraulic retention time, surface loading rate, organicloading, <strong>and</strong> nitrification. An example of a BFD is provided in Figure 2.• If treated wastewater will be reused, identification <strong>and</strong> description of the fate or final use ofthe treated wastewater should be detailed in the ER or EMP. Specific in<strong>for</strong>mation that shouldbe detailed includes the entity that will use the treated wastewater, the intended uses of thetreated wastewater, <strong>and</strong> an estimate of the average annual or monthly volume of treatedwastewater that will be reused.Source <strong>Water</strong>Flow, m 3 /hrFlow, m 3 /hrFlow, m 3 /hrFlow, m 3 /hrFlow, m 3 /hrSanitaryBoilerCoolingProcessFire <strong>Water</strong>Flow, m 3 /hrFlow, m 3 /hrFlow, m 3 /hrFlow, m 3 /hrFlow, m 3 /hrDischarge toDomesticSewerageSystemOutlet – O-001Discharge to<strong>Marine</strong> <strong>Water</strong>Outlet – O-002Flow, m 3 /hrFlow, m 3 /hrReuseOutlet – O-003On-site<strong>Wastewater</strong>TreatmentFigure 1. An example of a facility water balance diagram, indicating the source, successiveuses, flow rates, <strong>and</strong> output of water in a proposed project facility.Design Basis: organicvolumetric loading rate(e.g., 0.15 kg BOD/m 3 d)InfluentOil / <strong>Water</strong>SeparatorFlowEqualizationBiologicalTreatmentDesign Basis: flow rate(e.g., 0.1 m 3 /s)Design Basis: hydraulicdetention time (e.g., hours)Discharge to<strong>Marine</strong> <strong>Water</strong>Outlet: O-002S<strong>and</strong>FiltrationClarificationReturnSludgeReuseOutlet: O-003Design Basis: flux(e.g., 300 L/m 3 min)Design Basis:overflow rate(e.g., 20 m 3 /m 2 d)Figure 2. An example of a wastewater treatment plant block flow diagram indicating thesource, successive uses, flow rates, <strong>and</strong> output of water in a proposed project.Note: L/m 3 min = liters per cubic meter per minute, kg BOD/m 3 d = kilograms of biological oxygen dem<strong>and</strong> percubic meter per day, m 3 /s = cubic meters per second, m 3 /m 2 d = cubic meter per square meter per day.<strong>Water</strong> Quality St<strong>and</strong>ardsThe <strong>Wastewater</strong> <strong>and</strong> <strong>Marine</strong> <strong>Water</strong> Quality Monitoring sections of the ER or EMP should providebackground in<strong>for</strong>mation on probable wastewater <strong>and</strong> marine water pollutants <strong>and</strong> the water qualityst<strong>and</strong>ards that will be adopted <strong>for</strong> the proposed project. The following in<strong>for</strong>mation should be detailedin the ER or EMP:<strong>Document</strong> Tracking Number: 03.02.457.WP.03Date of Issue: 30Jan124
<strong>Technical</strong> <strong>Guidance</strong> <strong>Document</strong> <strong>for</strong> <strong>Wastewater</strong> <strong>and</strong> <strong>Marine</strong> <strong>Water</strong> Quality Monitoring• The probable pollutants in wastewater, including stormwater, discharged into a seweragesystem <strong>and</strong>/or marine waters or wastewater treated prior to reuse should be described.• The probable pollutants created with dredging <strong>and</strong> reclamation activity should be described.This in<strong>for</strong>mation should provide a detailed account of the locations <strong>and</strong> probable amounts ofmaterials that will be dredged <strong>and</strong> reclaimed.• The pollutants that will be monitored in wastewater discharged into sewerage or marinesystems, marine water (monitored at sampling locations in the marine waters receivingwastewater <strong>and</strong>/or dredged material pollutants), <strong>and</strong> treated wastewater that will be reusedshould be described.The water quality st<strong>and</strong>ards to be adopted by the monitoring programs <strong>for</strong> wastewater, marine water,<strong>and</strong> treated wastewater that will be reused should be described. UAE st<strong>and</strong>ards must be applied, whenavailable. In the absence of such st<strong>and</strong>ards, international st<strong>and</strong>ards should be adopted. In all instances,the proposed UAE or international st<strong>and</strong>ards must be appropriate <strong>for</strong> the water type <strong>and</strong> end use(wastewater discharged into a sewerage system, wastewater discharged into marine waters, pollutantswithin marine waters, or wastewater treated <strong>for</strong> reuse). In addition, all proposed st<strong>and</strong>ards must bejustified by the proponent <strong>and</strong> subsequently approved by EAD. See Annex B <strong>for</strong> EAD’s water qualityst<strong>and</strong>ards <strong>for</strong> wastewater discharged into marine waters <strong>and</strong> <strong>for</strong> receiving marine waters, as outlinedin Resolution of the Council of Ministries No. 37 of 2001 concerning regulations of Law No. 24 <strong>for</strong>the year 1999, System of protection of the marine environment. Annex 8 Characteristics of TreatedIndustrial Waste <strong>Water</strong> at Point of Discharge into the Sea (FEA, 2001).The pollutants that will be monitored <strong>and</strong> their associated water quality st<strong>and</strong>ards should be presentedin a tabular <strong>for</strong>m <strong>for</strong> each monitored wastewater <strong>and</strong>/or marine water.Monitoring ProgramThe <strong>Wastewater</strong> <strong>and</strong> <strong>Marine</strong> <strong>Water</strong> Quality Monitoring sections of the ER or EMP should providerelevant in<strong>for</strong>mation <strong>and</strong> detailed descriptions of the wastewater <strong>and</strong> marine water quality monitoringprograms that will be adopted by the proposed project. In<strong>for</strong>mation should be provided in text, maps,<strong>and</strong>/or tabular <strong>for</strong>mat. In<strong>for</strong>mation should also include: a sampling regime; in situ measurements;sample collection, h<strong>and</strong>ling, <strong>and</strong> analysis; monitoring in the event of st<strong>and</strong>ard limit exceedances oroccurrences of an incident; <strong>Wastewater</strong> <strong>and</strong> <strong>Marine</strong> <strong>Water</strong> Quality Monitoring Report preparation <strong>and</strong>submission; <strong>and</strong> corrective actions <strong>for</strong> non-compliance. This in<strong>for</strong>mation is described in the followingparagraphs.Sampling RegimeThere should be detailed descriptions of the sampling regimes that will be implemented as part of thewastewater <strong>and</strong> marine water quality monitoring programs. Specific in<strong>for</strong>mation that should beprovided includes descriptions of sampling locations, sample collection frequency, <strong>and</strong> the types ofsamples, which are discussed in the following paragraphs.Sampling LocationsThe total number of <strong>and</strong> locations <strong>for</strong> sample collections should be indicated. For pre-treated <strong>and</strong> nontreatedwastewater discharged into a sewerage system or marine waters, a sample should be collectedat each outlet <strong>and</strong> associated with an outlet identifier number (e.g., O-001, O-002). For the receivingmarine waters, sampling locations should be determined by ambient conditions <strong>and</strong> mixing zoneanalyses <strong>and</strong> should also be labeled with numeric identifiers (e.g., M-001, M-002). Both the mixingzone <strong>and</strong> the waters adjacent to the mixing zone should be adequately sampled horizontally <strong>and</strong>vertically to assess the extent of impact. In cases in which the impact of discharge or dredging onmarine systems is expected to be significant <strong>and</strong>/or alternate methods of determination are notappropriate, the coverage of the mixing zone should be determined by a hydrodynamic model.Examples of suitable models <strong>for</strong> mixing zone analyses are presented in Table 2. If dischargedwastewater is expected to have minimal impact on marine systems, delineation of the mixing zone canbe determined by using an alternate method. The model or method used to determine the mixing zone<strong>Document</strong> Tracking Number: 03.02.457.WP.03Date of Issue: 30Jan125